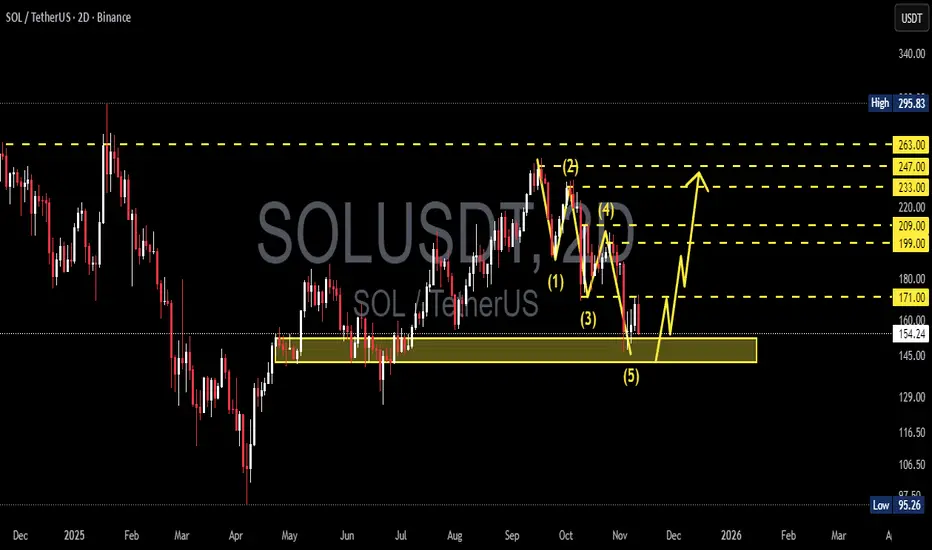
SOL/USDT — Will Solana Start a Major Reversal from Here?Solana (SOL/USDT) is now sitting at a critical turning point, as the market tests a major historical demand zone between 152–142 USDT. After completing a clear 5-wave impulsive decline, sellers appear to be losing momentum, while buyers are starting to react around this key area.
This yellow zone has previously acted as a strong demand base, triggering powerful rallies in the past. Now, it’s once again becoming the battlefield between bulls and bears — and the outcome could define Solana’s direction for the coming months.
---
Pattern & Structure
1. 5-Wave Decline (Elliott Wave Structure):
The chart shows a clean 5-wave downward pattern, often marking the end of a corrective phase. If valid, the next move could be an ABC corrective rally, signaling the start of a broader bullish reversal.
2. Critical Demand Zone (152–142):
This area serves as a strong institutional accumulation zone, where smart money often steps in. A confirmed rebound from here could ignite the next leg higher.
3. Layered Resistance Levels:
Key resistance levels are lined up at
171 → 199 → 209 → 233 → 247 → 263.
Each breakout acts as a step confirming a stronger bullish trend.
4. Fibonacci Confluence:
The 38–61% retracement levels align with 199–263, strengthening the case for this region as a natural recovery target zone in the next upward phase.
---
Bullish Scenario — “The Reversal Zone Awakens”
If price holds above 152 and forms a strong bullish reversal candle (engulfing / hammer on the 2D chart), we could see:
Target 1: 171 → first confirmation of trend reversal.
Target 2: 199–209 → mid-level recovery zone.
Target 3: 233–247 → full corrective phase.
Extended Target: 263 → upper resistance and profit-taking zone.
This scenario represents the potential end of a multi-month bearish phase and the beginning of a fresh bullish cycle.
A 2D close above 171 would strongly confirm the reversal structure.
Additional confirmation: bullish divergence on RSI, increasing buy volume, or formation of higher lows on the 2D timeframe.
---
Bearish Scenario — “Breaking the Floor”
If the price closes below 142, the current demand zone will flip into resistance, signaling continuation of the downtrend toward:
First target: around 116 (minor demand).
Main target: 95 (previous historical low).
A breakdown below 142 would suggest that wave (5) may not yet be complete, indicating one final capitulation wave before a potential long-term bottom forms.
---
Strategy & Outlook
Conservative traders: Wait for a confirmed 2D close above 171 before entering any bullish setups.
Aggressive traders: Consider gradual accumulation near 152–142 with tight SL below 142.
Risk management: Maintain a minimum R:R of 1:2, and avoid averaging down blindly without confirmation.
Multi-timeframe confirmation: Watch daily and 3D candles for stronger conviction signals.
---
Market Psychology
This current phase represents a “capitulation zone” — where retail confidence fades while smart money starts positioning quietly.
Historically, major trend reversals are born from such exhaustion zones. If SOL can defend this support area, it could be the beginning of a powerful new uptrend toward 200+ and beyond.
---
Conclusion
Zone 152–142 = critical buyer defense line.
Reaction in this zone will determine the next macro trend for Q4 2025 – Q1 2026.
Breakdown → downside target 95.
Reversal → upside potential up to 263.
---
#Solana #SOLUSDT #CryptoAnalysis #TechnicalAnalysis #SupportResistance #ElliottWave #CryptoReversal #SwingTrade #PriceAction #AltcoinSeason #SolanaAnalysis
Solona
#SOL/USDT is going to breakout from descending channel 18% gain#SOL
The price is moving within an ascending channel on the 1-hour timeframe and is adhering to it well. It is poised to break out strongly and retest the channel.
We have a downtrend line on the RSI indicator that is about to break and retest, which supports the upward move.
There is a key support zone in green at the 162 price, representing a strong support point.
We have a trend to stabilize above the 100-period moving average.
Entry price: 164
First target: 166
Second target: 168
Third target: 171
Don't forget a simple money management rule:
Place your stop-loss order below the green support zone.
Once the first target is reached, save some money and then change your stop-loss order to an entry order.
For any questions, please leave a comment.
Thank you.

#SOL/USDT — Critical Retest at Demand Zone vs Long-Term Downtr#SOL
The price is moving within an ascending channel on the 1-hour timeframe and is adhering to it well. It is poised to break out strongly and retest the channel.
We have a downtrend line on the RSI indicator that is about to break and retest, which supports the upward move.
There is a key support zone in green at the 158 price, representing a strong support point.
We have a trend to stabilize above the 100-period moving average.
Entry price: 159
First target: 161
Second target: 164
Third target: 168
Don't forget a simple money management tip:
Place your stop-loss order below the green support zone.
Once you reach the first target, save some money and then change your stop-loss order to an entry order.
For any questions, please leave a comment.
Thank you.

Solana$It seems that Solana has reached its price peak, and I’m expecting a correction.
Of course, the price may decline gradually in stages

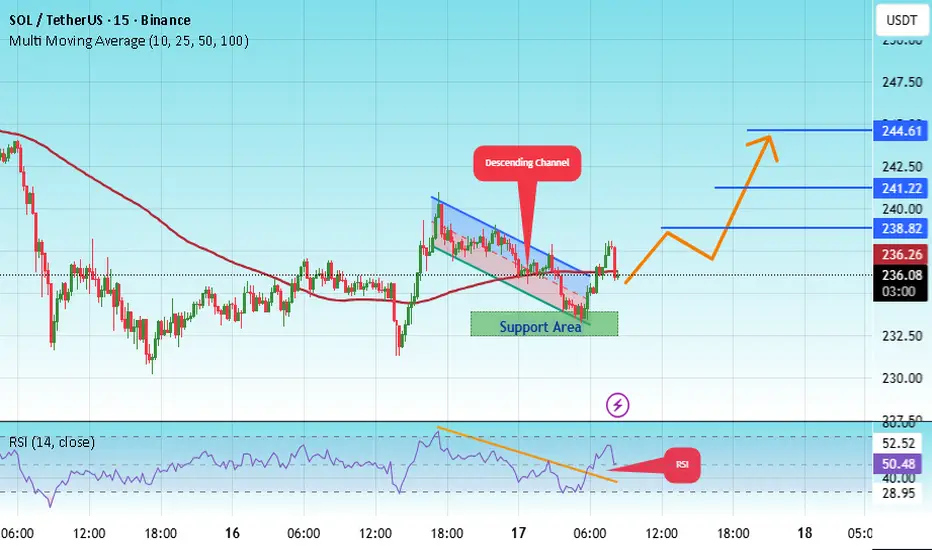
#SOL/USDT bullish structure formed at the chart#SOL
The price is moving within a descending channel on the 1-hour frame, adhering well to it, and is heading for a strong breakout and retest.
We have a bearish trend on the RSI indicator that is about to be broken and retested, which supports the upward breakout.
There is a major support area in green at 233, representing a strong support point.
We are heading for consolidation above the 100 moving average.
Entry price: 236
First target: 238
Second target: 241
Third target: 244
Don't forget a simple matter: capital management.
When you reach the first target, save some money and then change your stop-loss order to an entry order.
For inquiries, please leave a comment.
Thank you.
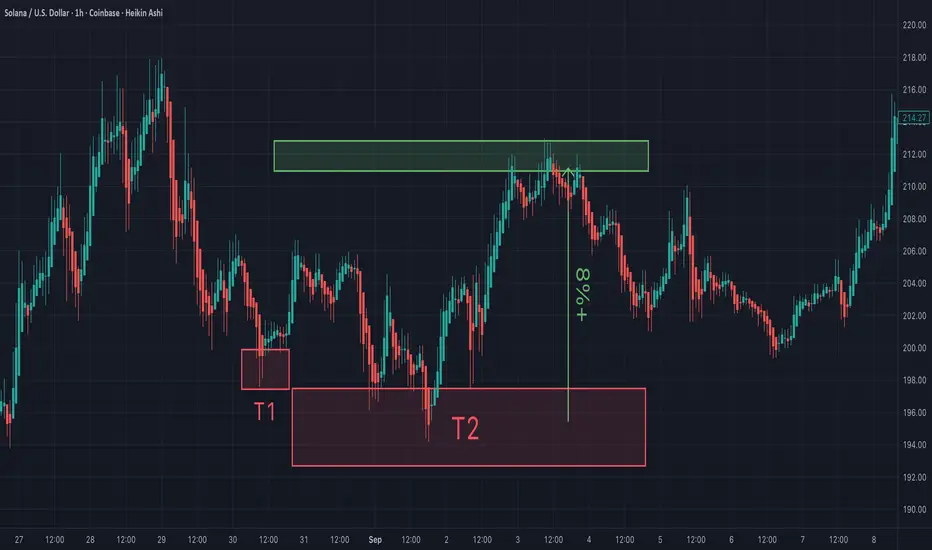
SOL BREAKS OUT We can easily see a bullish breakout from SOL/USDT , this is one of the most basic price action where in the coins breakout and retest the upper trendline . Now in the current scenario we are targeting the previous resistance clusters and also bitcoin seems pretty bullish here.

You will ask yourself, "how did he know Sol would do that"?On Aug 30th I posted Sol's support and resistance for my trades. I am grateful it played out perfectly.
One question remains...is Sol getting overheated, or going to continue to rip to the upside? I'd like to hear your thoughts?
May the trends be with you.
SOLUSDT NEW TIMES COMING? Thank you for reading this update.
Solona looks to have a new incoming volume
Will this bring this volume Solana to $100 with time?
This volume depends on day trade and has no guarantees for the long term.

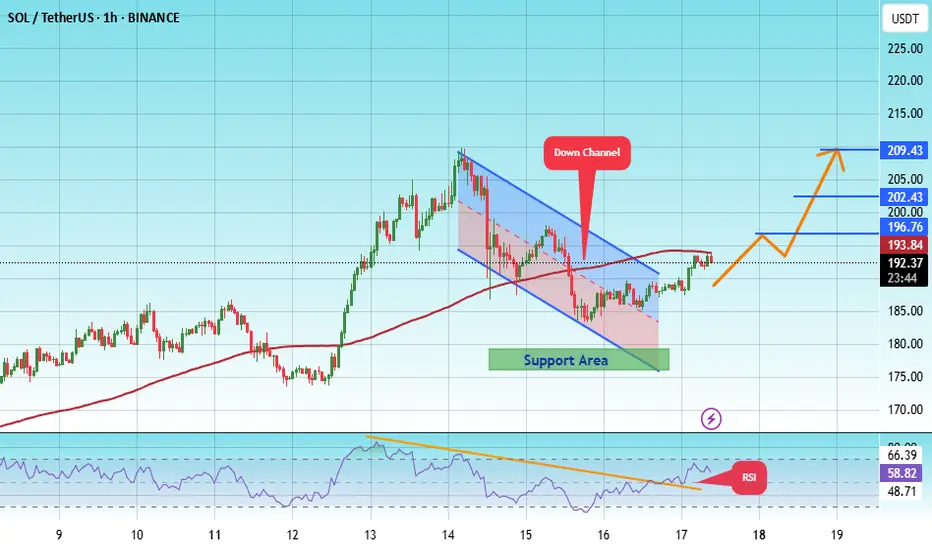
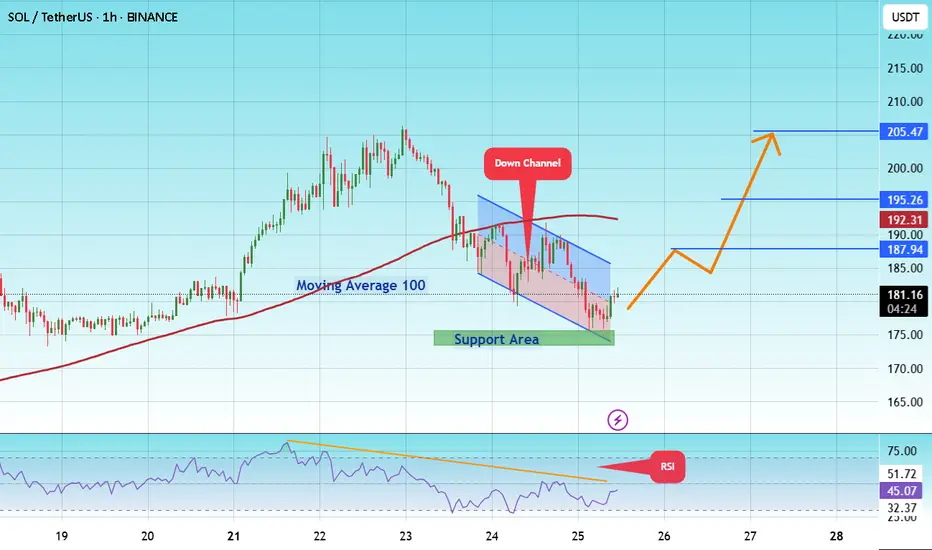
#SOL/USDT Is This the Perfect Time for a Solana Bullish Heist?#SOL
The price is moving within an ascending channel on the 1-hour frame, adhering well to it, and is on track to break it strongly upwards and retest it.
We have support from the lower boundary of the ascending channel, at 180.
We have a downtrend on the RSI indicator that is about to break and retest, supporting the upside.
There is a major support area in green at 178, which represents a strong basis for the upside.
Don't forget a simple thing: ease and capital.
When you reach the first target, save some money and then change your stop-loss order to an entry order.
For inquiries, please leave a comment.
We have a trend to hold above the moving average of 100.
Entry price: 192.
First target: 196.
Second target: 202.
Third target: 209.
Don't forget a simple thing: ease and capital.
When you reach the first target, save some money and then change your stop-loss order to an entry order.
For inquiries, please leave a comment.
Thank you.
SOLUSDT ling term"🌟 Welcome to Golden Candle! 🌟
We're a team of 📈 passionate traders 📉 who love sharing our 🔍 technical analysis insights 🔎 with the TradingView community. 🌎
Our goal is to provide 💡 valuable perspectives 💡 on market trends and patterns, but 🚫 please note that our analyses are not intended as buy or sell recommendations. 🚫
Instead, they reflect our own 💭 personal attitudes and thoughts. 💭
Follow along and 📚 learn 📚 from our analyses! 📊💡"

#SOL/USDT coin market structure analysis#SOL
The price is moving within a descending channel on the 1-hour frame and is expected to break and continue upward.
We have a trend to stabilize above the 100 moving average again.
We have a downtrend on the RSI indicator that supports the upward move with a breakout.
We have a support area at the lower boundary of the channel at 175, acting as strong support from which the price can rebound.
We have a major support area in green that pushed the price upward at 174.
Entry price: 181.
First target: 187.
Second target: 195.
Third target: 205.
To manage risk, don't forget stop loss and capital management.
When you reach the first target, save some profits and then change the stop order to an entry order.
For inquiries, please comment.
Thank you.
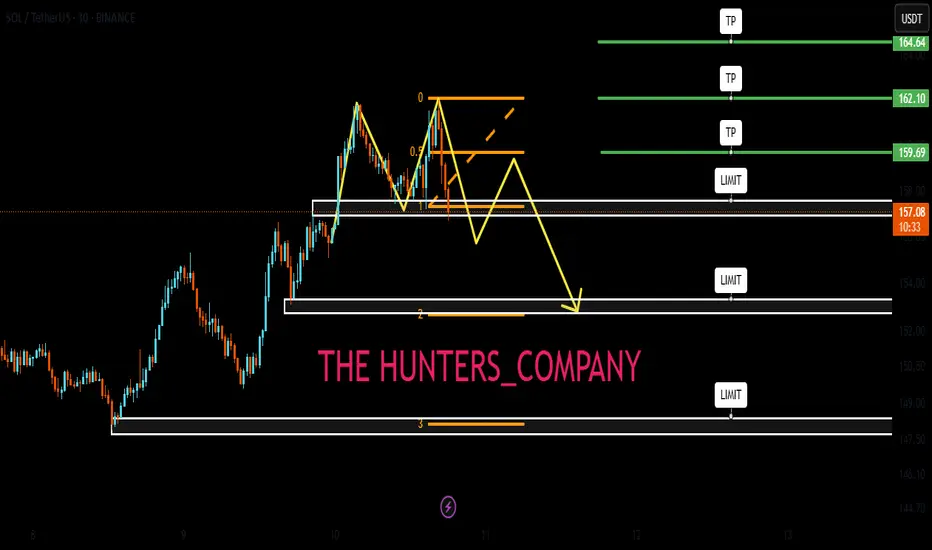
SOLUSDT- Golden Pocket Bounce: Bullish Phase or Another Fakeout?🔍 In-Depth Technical Analysis (1D Timeframe)
The SOL/USDT pair is currently showing a highly significant technical reaction as price bounces from the Fibonacci Retracement 0.5 - 0.618 zone (also known as the Golden Pocket), located between $166.63 - $157.13.
This level also aligns perfectly with a historical demand zone that has previously acted as a strong support during high-volume selloffs, creating a powerful confluence area.
---
🧩 Market Structure & Pattern
✅ Golden Pocket + Demand Zone: This overlap strengthens the probability of a valid bullish reversal.
🟠 Previous Movement: Price dropped from the recent swing high near $188 after failing to break through major resistance.
📉 Short-Term Downtrend: Currently in a corrective phase after an earlier bullish run.
---
🟢 Bullish Scenario (Rebound Confirmed from Golden Pocket)
If the price manages to hold above the $157 - $166 range and prints a bullish candle with volume confirmation:
1. A bullish breakout above $179 and more importantly $187.80 could open the door to further upside.
2. Potential midterm bullish targets:
🎯 Target 1: $205.69 (key psychological + structural level)
🎯 Target 2: $218.13 (previous reaction zone)
🎯 Target 3: $257.10
🎯 Target 4 (macro): $295.14
> The current zone offers an attractive risk-to-reward opportunity for swing traders, as long as the higher low structure is maintained.
---
🔴 Bearish Scenario (Breakdown from Key Support Zone)
Should the price break below $157 with strong selling volume:
1. That would invalidate the bullish setup and suggest a shift in structure.
2. Potential deeper correction targets include:
⚠️ Support 1: $140 (minor support from past structure)
⚠️ Support 2: $122 - $110 (major support zone from March–April 2025)
> A confirmed breakdown here would likely initiate a lower high – lower low structure, signaling a possible shift into a bearish medium-term trend.
---
📌 Additional Key Indicators to Watch
🔄 Volume Spike: Essential for validating any breakout or breakdown.
📉 Daily RSI: If RSI shows bullish divergence or bounces from oversold territory, that would strengthen the bullish case.
⏳ Daily Candle Close: Monitor the next 2–3 daily candle closes around this key zone for directional confirmation.
---
💡 Conclusion
SOL is at a crucial inflection point. The reaction around the $157 - $166 support confluence will likely determine the medium-term trend:
Bullish: If price reclaims $179–$188 zone with strong momentum
Bearish: If price breaks below $157 and closes with volume
This could be a high-reward opportunity for technical traders if confirmed properly.
---
🧠 Suggested Strategy:
🔹 Entry: Upon bullish confirmation in current demand zone
🔹 Stop Loss: Below $155 (for swing setups)
🔹 Take Profit Zones: $179 → $205 → $218 → $257+
#SOLUSDT #Solana #CryptoTechnicalAnalysis #FibonacciLevels #GoldenPocket #PriceAction #CryptoReversal #SwingTradeSetup #Altcoins #CryptoChart

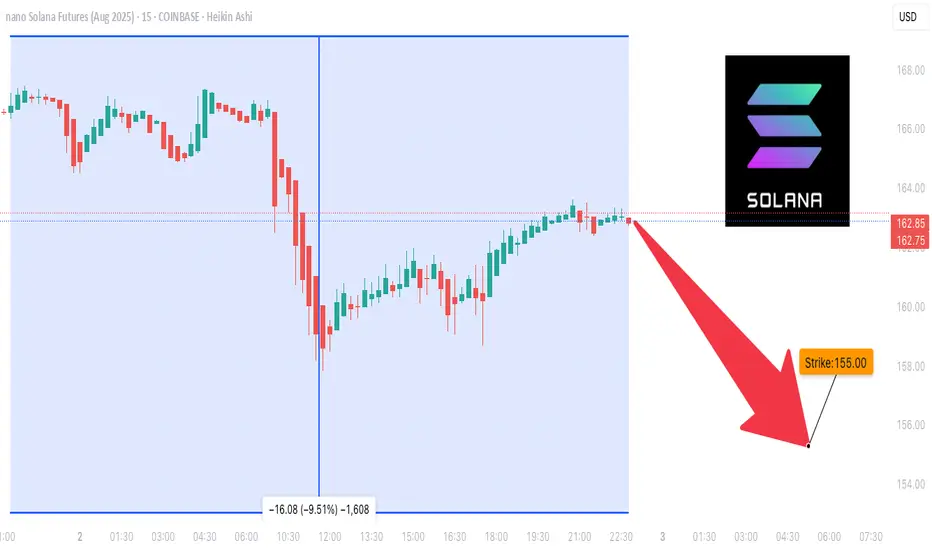
$SOL CRYPTO FUTURES SETUP – BEARISH BIAS (Aug 2, 2025)
🚨 **\ CRYPTOCAP:SOL CRYPTO FUTURES SETUP – BEARISH BIAS** (Aug 2, 2025) 🚨
Multi-Model AI Consensus | 🔻 Short Bias with Defined Risk
---
### 📉 **MARKET CONTEXT**
* **Current Price**: \$158.84
* 🔻 Trading below all key MAs:
* SMA20: \$178.72 (-11.1%)
* SMA50: \$161.29 (-1.5%)
* SMA200: \$162.06 (-2.0%)
* 🔻 Market Structure:
* **Death Cross** confirmed
* **Lower highs/lows** across all timeframes
* **-12.36%** drop over 5 days = capitulation signal
* 🔥 Liquidity Zone: **\$155.29** = key bounce OR breakdown level
* 📉 Volume declining = no buyer conviction
* 💣 Volatility High: BB Width = 26.2% of price (⚠️ Stop risk!)
---
### 🧠 **MULTI-TIMEFRAME MODEL SIGNALS**
**1-Hour**:
🟥 Bearish MACD, RSI \~39 (no reversal yet)
**4-Hour**:
🔻 Still trending down, no structure break
**Daily**:
⚠️ Death Cross active, must hold \$155.29
💡 Reclaim of \$162.06 = **bullish trigger**
---
### 🔬 **TECHNICAL INDICATOR SYNTHESIS**
* **RSI (14)**: 39.84 → nearing oversold
* **MACD**: Strong bearish momentum, no reversal
* **Bollinger Bands**: Price hugging lower band @ \$155.29
* **Volume**: Weak, no accumulation on dips
* **Funding Rate**: Neutral (0.0001%) = no squeeze setup
---
### 🔎 **TRADE SETUP (OA MODEL)**
🛑 **Direction**: SHORT
🎯 **Entry**: \$158.84
📉 **Target**: \$155.29
🛡️ **Stop**: \$161.29
💪 **Confidence**: 80%
🕰️ **Timing**: Market Open
🧠 Model Notes: Favoring momentum short w/ tight stop & fast exit
---
### ❌ **DS MODEL (No Trade)**
🟡 Recommends standing aside due to:
* Missing OI data
* Elevated volatility
* Lack of reversal OR divergence
---
### 🤖 **FINAL CONSENSUS**
🧠 **Models Agreed**: 2
📊 **Average Confidence**: 68%
📉 **Bias**: SHORT
📛 **Risk Level**: MODERATE
🚨 **Key Breakdown**: < \$155.29 = opens door to \$145
---
### ⚠️ **WATCH LEVELS**
* 📈 **Bull Trigger**: Close above \$162.06 (SMA200) + MACD cross
* 📉 **Bear Continuation**: Break < \$155.29 = fast drop to \$145
* 📌 **Optimal Long Setup**: RSI divergence + volume spike @ support
---
🧨 **RISK WARNING**: High volatility zone – futures carry liquidation risk >100%. Always use proper sizing and stops.
---
📢 #CryptoFutures #SOLUSDT #TradingView #AITradeSignal #BearishSetup #SolanaAnalysis #MultiModelConsensus
Just like #AKRM, #SOL can also pump 100%Just like #AKRM, #SOL can also pump 100%..
SOL will also have this kind of exit rally. Whether there is a war between the US, Iran, and Israel or not, the market will crash very badly.

SOL - Excellent Trade Opportunity- Trade is giving us a trade with huge potential with huge risk reward ratio.
- Currently price is heading towards teh support around 160 range and this is strong support zone.
- I'm expecting price to bounce back from this zone and head towards the next target of 200 range
Entry Price: 163
StopLoss: 148
TP1: 172
TP2: 182
TP3: 200
Stay tuned for more updates.
Cheers
GreenCrypto

Solana UpdateHello friends🙌
After the price growth we had, the price hit the resistance level of $160 twice and failed to break it, which caused a double top pattern to form, which if confirmed, there is a possibility of falling to the specified areas.😉
The specified areas are good prices for buying in steps, of course, with capital and risk management.✔
🔥Join us for more signals🔥
*Trade safely with us*
SOL DOWN TO 146 ? Is this possible? Good evening trading family
Based on what we are seeing here is a typical correcting of any good bull mark needed to sustain our movement upwards. Currently we have spotted 3 levels down to the 146 marker with a these of a bullish move upwards if they hold.
Happy trading folks
Kris/ Mindbloome Exchange
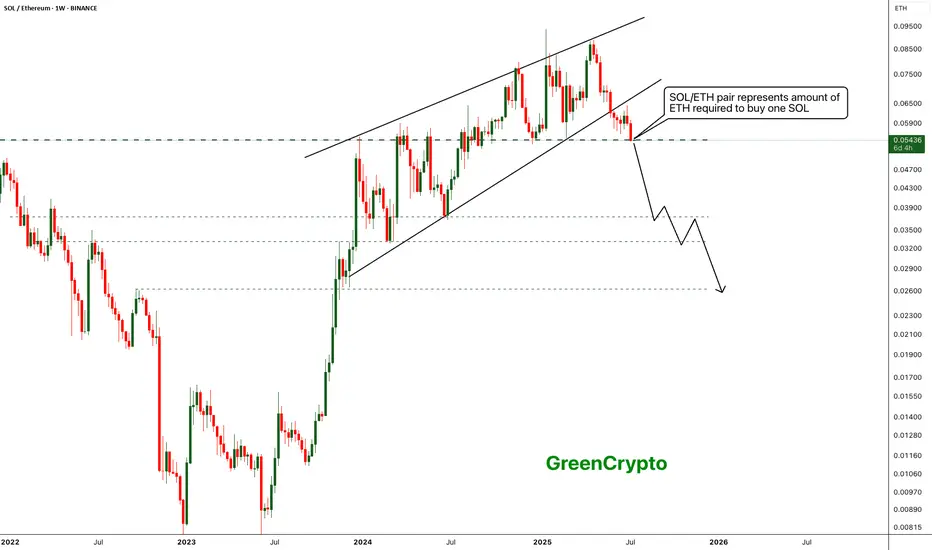
Ethereum is outshining Solona- Ethereum is finally outshining Solona
- ETH/SOL pair has broke down from the raising wedge pattern indicating clear bearish sentiment
- with the current bearish trend, we can expect the SOL/ETH pair to drop further down to 0.02630 range..
- This is clear sign the holder are preferring ETH or SOL
Stay tuned for more updates
Cheers
GreenCrypto
#SOL/USDT Loves THIS Pattern | BULLISH#SOL
The price is moving within a descending channel on the 1-hour frame, adhering well to it, and is on its way to breaking strongly upwards and retesting it.
We have a bounce from the lower boundary of the descending channel. This support is at 143.
We have a downtrend on the RSI indicator that is about to break and retest, supporting the upside.
There is a major support area in green at 142, which represents a strong basis for the upside.
Don't forget a simple thing: ease and capital.
When you reach the first target, save some money and then change your stop-loss order to an entry order.
For inquiries, please leave a comment.
We have a trend to hold above the moving average of 100.
Entry price: 149.
First target: 153.
Second target: 156.
Third target: 159.
Don't forget a simple thing: ease and capital.
When you reach the first target, save some money and then change your stop-loss order to an entry order.
For inquiries, please leave a comment.
Thank you.

#SOL/USDTSOLANA →
The price is moving within a descending channel on the 1-hour frame and is expected to break and continue upward.
We have a trend to stabilize above the 100 moving average once again.
We have a downtrend on the RSI indicator that supports the upward move with a breakout.
We have a support area at the lower limit of the channel at 142, acting as strong support from which the price can rebound.
Entry price: 144
First target: 146
Second target: 149
Third target: 152
For risk management, please don't forget stop loss and capital management
When we reach the first target, save some profit and then change the stop to entry
Comment if you have any questions
Thank You

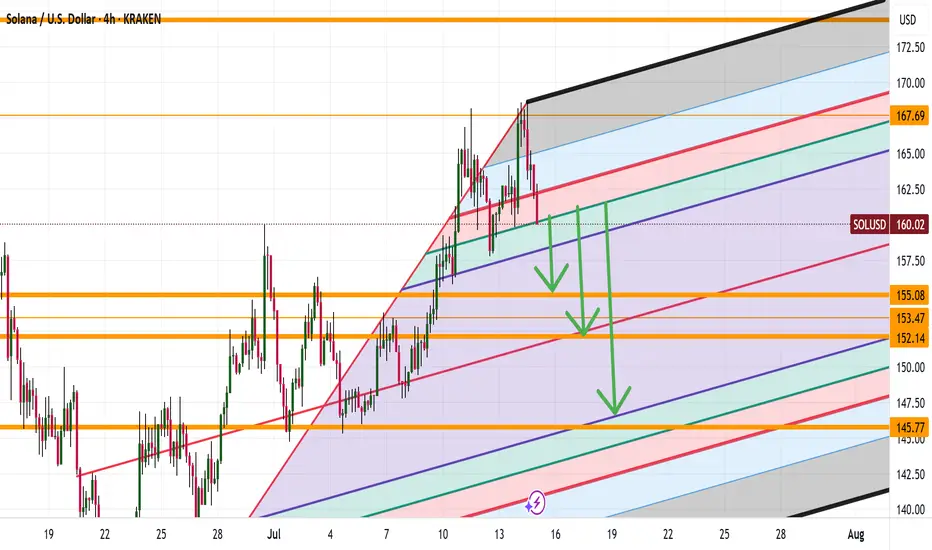
Is SOLANA SOL Ready for a Breakout? Bounce from Falling Channel?
🔍 Chart Pattern and Price Structure Analysis
This chart illustrates a well-formed descending channel (parallel falling channel) that has been developing since mid-January 2025. Currently, the price is approaching the upper boundary of this channel — a key decision area.
🟡 Technical Pattern
Descending Channel: This pattern is characterized by a series of lower highs and lower lows, representing a medium-term bearish trend.
The price is now testing the upper resistance of this channel, a crucial point that could either trigger a breakout or result in another rejection.
📈 Bullish Scenario
If the price successfully breaks out above the upper trendline (around $152–$154), several resistance targets come into play:
1. $164.5 — A minor horizontal resistance and key psychological level.
2. $182.2 — A strong historical resistance zone.
3. $210–$217.8 — A previous consolidation/resistance zone.
4. $237.7, then $261–$280 — Key bullish targets if momentum sustains.
5. Ultimate target near $295.1–$295.7 if broader market sentiment remains strong.
📌 Bullish Confirmation:
Valid daily candle breakout above the channel.
Strong breakout volume.
Successful retest of the breakout area as new support.
📉 Bearish Scenario
If the price fails to break above the channel and gets rejected, we may see a continuation of the downtrend with potential moves to these support levels:
1. $140–$138 — Current minor support zone.
2. $128 — Recent consolidation support.
3. $115.5 — Major support from April.
4. $95.2 — The lowest support zone on the chart.
📌 Bearish Confirmation:
Strong rejection candle (e.g., bearish engulfing) from upper channel.
Weak breakout attempt with declining volume.
Break below the lower channel support or creation of a new lower low.
📊 Conclusion
The current setup is a classic descending channel, indicating a strong mid-term bearish structure.
Price is now at a make-or-break zone — a breakout could signal a trend reversal, while a rejection could extend the current downtrend.
Traders should wait for a confirmed breakout or clear rejection before entering a position.
#SOLUSDT #Solana #CryptoAnalysis #TechnicalAnalysis #DescendingChannel #BreakoutAlert #CryptoTrading #BullishScenario #BearishScenario #Altcoins #CryptoTA

SOLANA ABOUT TO EXPLODE?CRYPTOCAP:SOL just broke out and is surging within a long-term bullish channel
Price action is clean, momentum is strong, and if this channel holds — we might be eyeing $700+ in the next run.
This is not the time to ignore Solana.
Chart says it all.
DYOR. Stay sharp.

Solana Heading to 112 or 330+Hey fam
So for Solana if we hold under 148 then a drive down to 112 makes sense. However if we drive above 148 then we can possibly hit weekly targets of 330
Make sure you adjust accordingly in a smaller time frame to ensure your in the right move
Happy tradings folks
Kris Mindbloome Exchange
Trade Smarter Live Better
Under 148 we go to 112 if we break 148 we can see a drive up to 338
