$SOL (Solana) 6HPrice is trading within an ascending channel, currently around $182. A breakout continuation could target $195 first, followed by $205. Support remains at the lower channel line, keeping the short-term bullish momentum intact.
Solana remains one of the fastest-growing L1 ecosystems with strong DeFi, NFT, and gaming adoption. Network activity and developer growth remain high, reinforcing investor confidence ahead of potential ecosystem upgrades.
SOLUSD

SolanaSol usdt Daily analysis
Time frame daily
Risk rewards ratio =3 👈👌
My target= 303 $
Technical analysis
Let's take a look at the chart. The price is between two ascending diagonal lines. At times it has approached the upper line but has not touched it and has turned back. But the lower line has become a good support and can give us a signal that the price will not go lower than this. This support has worked well even in severe declines.

SolanaSol usdt Daily analysis
Time frame daily
Risk rewards ratio >3.5 👈👌
Target 248$
Green line is a historical up trend for solana

Solana – Momentum Continues After \$155 LaunchpadTrend:
SOL rallied from \$155 support and is now trading well above both the 50 EMA and 200 EMA on 4H/Daily charts.
Strong uptrend with higher highs and higher lows in place.
Pattern:
Breakout from ascending channel retest at \$155 triggered fresh buying.
Price is currently approaching resistance near \$185–\$188, which, if broken, opens the path to \$200+.
Key Levels:
Support: \$172, \$165, \$155 (major swing low)
Resistance: \$185, \$200, \$215
Breakout Trigger: 4H close above \$185 on strong volume
Indicators:
RSI remains in bullish zone (65–70), showing strength without extreme overbought conditions.
MACD still in bullish crossover with widening histogram.
Volume increasing on upswings, confirming buyer dominance.
Trade Plan:
Entry: Buy pullbacks to \$172–\$175 OR breakout above \$185 with volume
Stop-loss: Below \$165 (swing low)
TP1: \$200
TP2: \$215
TP3: \$230 (if momentum accelerates)
Bias: Bullish while price holds above \$165.
📈 SOL’s rebound from \$155 has shifted market sentiment firmly bullish. A breakout above \$185 could be the ignition point for a run into the \$200–\$230 range.

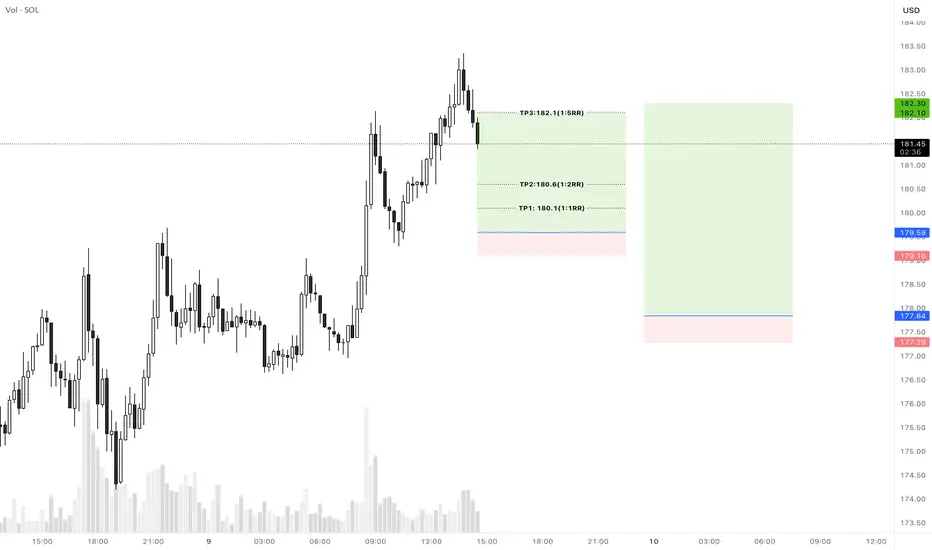
Solana Long SetupHi everyone.
I think this areas has some potential to set orders.
If we stop at the first order then I'll update the second order TPs.
please consider the risk management and don't use more than 0.5% of your capital for each...
Dear traders, please support my ideas with your likes and comments to motivate me to publish more signals and analysis for you.
Best Regards
Navid Nazarian
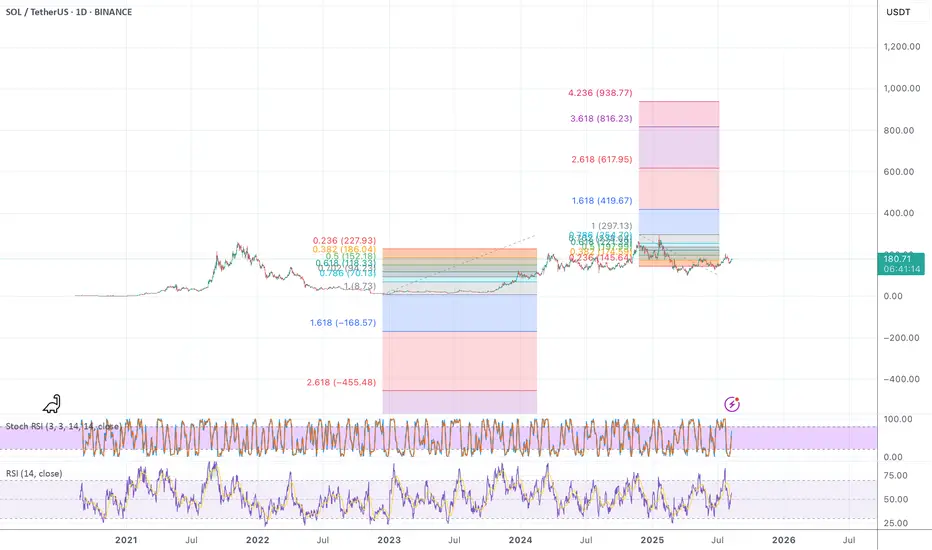
SOL - How high can this thing fly? 1000USD?? Checking the fibbs here I see what is possible.. is it really?
It looks to me like this thing hasn't even started yet.
Can it go to 1000USD? Tell me your thoughts
Solana Long SetupHi everyone.
I think this areas has some potential to set orders.
If we stop at the first order then I'll update the second order TPs.
please consider the risk management and don't use more than 0.5% of your capital for each...
Dear traders, please support my ideas with your likes and comments to motivate me to publish more signals and analysis for you.
Best Regards
Navid Nazarian

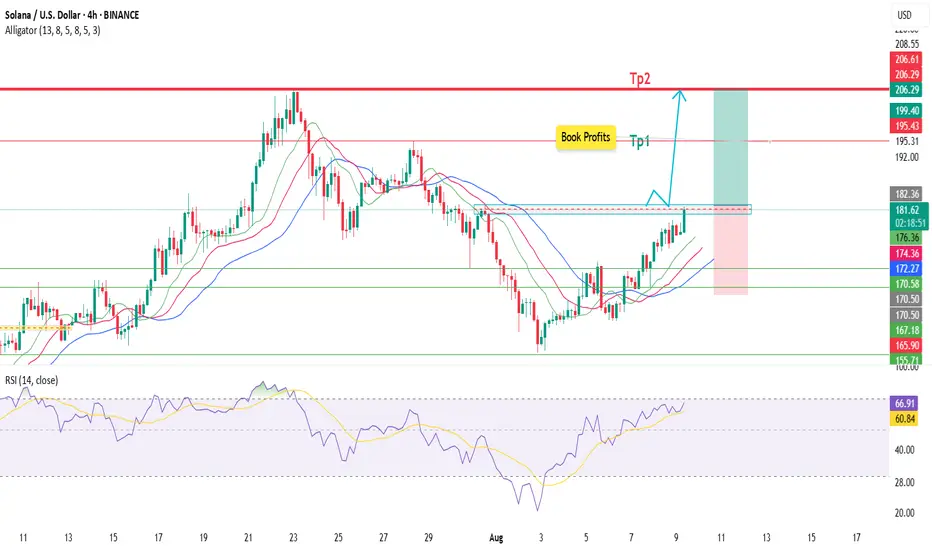
SOLUSD🐊 SOLUSD – Alligator Entry (Buy Call)
📈 HHs & HLs in formation
🔍 Wait for resistance breakout ➡️ retest ➡️ bullish candle confirmation
🎯 Entry: 🔼 Marked on chart
🛡 SL: ⛔ Marked on chart
💰 TP: 🎯 Marked on chart
$SOLBTC Broke down. Same with $SOLETH. Will it rebound? We peaked in CRYPTOCAP:BTC.D chart as we predicted here.
CRYPTOCAP:BTC weathering the storm: CRYPTOCAP:BTC.D close to 66%. CRYPTOCAP:BTC to 160K. for BITSTAMP:BTCUSD by RabishankarBiswal — TradingView
Since then, Altcoins have shown signs of strength and CRYPTOCAP:ETH.D is bouncing back with BITSTAMP:ETHUSD at 4000 $. Please check my CRYPTOCAP:ETH.D blog here.
CRYPTOCAP:BTC.D : Cycle tops are in. CRYPTOCAP:ETH.D : Bounce form the all-time lows for CRYPTOCAP:BTC.D by RabishankarBiswal — TradingView
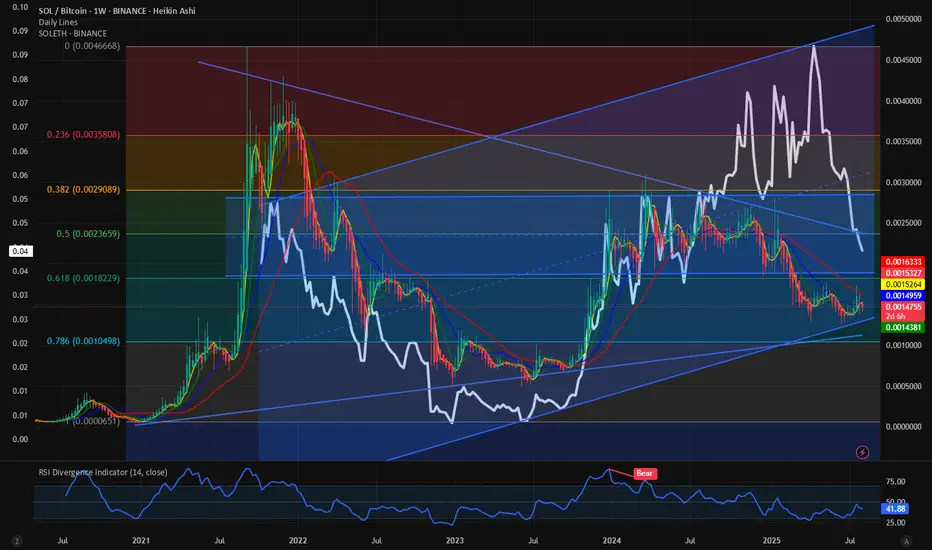
CRYPTOCAP:SOL being one of the large caps within the Altcoin must participate for the Altcoin summer to happen. But when we plot the BINANCE:SOLBTC and BINANCE:SOLETH then we see a broken chart with a fall from the cliff. On July 6th I wrote theta §SOLBTC looks bearish and we might find it difficult to break out of the range 0.0025 to 0.00125.
BINANCE:SOLBTC : Little strength to show for. for BINANCE:SOLBTC by RabishankarBiswal — TradingView
I put the BINANCE:SOLETH on the same chart and I was surprised how perfectly fit between the Fib retracement level. 😊 Now we would like to see where this chart goes and where does it bounce back. We see that the favorite range where BINANCE:SOLETH spends most of the time is between 0.053 to 0.04. Currently the ratio is at 0.044. My estimate is that the ratio will bounce back from the psychological level of 0.04 and then bounce atleast to 0.06 which is the mid-point of the upward slopping channel on $SOLETH.
Verdict: Altcoin summer is on. BINANCE:SOLETH is short term bearish but medium term bullish with 0.06 as target.
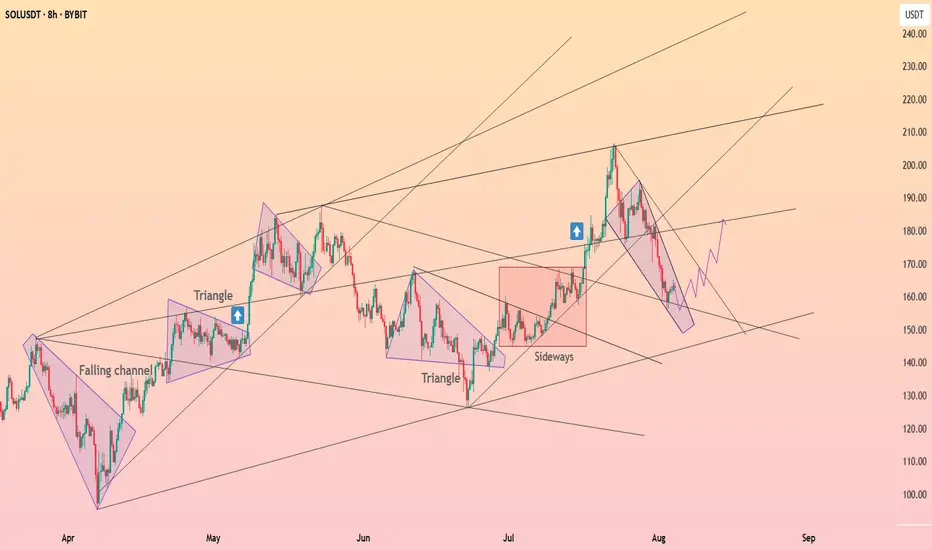
Solana consolidated above the descending wedge ┆ HolderStatBYBIT:SOLUSDT rotated higher after a swift corrective channel, reclaiming the mid‑range and pushing back toward the 195–205 supply. The chart highlights repetitive triangle resolutions and a strong sideway accumulation before the last impulse, suggesting ongoing demand. Immediate support sits at 176–180 and 168–170; holding above keeps attention on 195, then 205. A breakout through 205 unlocks 210–215 near the upper trend band. Only a daily close beneath 168 would compromise the structure and re‑open 155–160. Until then, dips remain buyable with targets at 195/205.

SOLUSD H4 | Bearish dropBased on the H4 chart analysis, we can see the price rising to the sell entry, which acts as a pullback resistance, and it could drop from this level to the take profit target.
Sell entry is at 175.373, a pullback resistance that aligns with the 38.2% Fibonacci retracement.
Stop loss is at 193.149, which is a swing high resistance.
Take profit is at 157.422, which is an overlap support that aligns with the 61.8% Fibonacci retracement.
High Risk Investment Warning
Trading Forex/CFDs on margin carries a high level of risk and may not be suitable for all investors. Leverage can work against you.
Stratos Markets Limited (tradu.com ):
CFDs are complex instruments and come with a high risk of losing money rapidly due to leverage. 65% of retail investor accounts lose money when trading CFDs with this provider. You should consider whether you understand how CFDs work and whether you can afford to take the high risk of losing your money.
Stratos Europe Ltd (tradu.com ):
CFDs are complex instruments and come with a high risk of losing money rapidly due to leverage. 66% of retail investor accounts lose money when trading CFDs with this provider. You should consider whether you understand how CFDs work and whether you can afford to take the high risk of losing your money.
Stratos Global LLC (tradu.com ):
Losses can exceed deposits.
Please be advised that the information presented on TradingView is provided to Tradu (‘Company’, ‘we’) by a third-party provider (‘TFA Global Pte Ltd’). Please be reminded that you are solely responsible for the trading decisions on your account. There is a very high degree of risk involved in trading. Any information and/or content is intended entirely for research, educational and informational purposes only and does not constitute investment or consultation advice or investment strategy. The information is not tailored to the investment needs of any specific person and therefore does not involve a consideration of any of the investment objectives, financial situation or needs of any viewer that may receive it. Kindly also note that past performance is not a reliable indicator of future results. Actual results may differ materially from those anticipated in forward-looking or past performance statements. We assume no liability as to the accuracy or completeness of any of the information and/or content provided herein and the Company cannot be held responsible for any omission, mistake nor for any loss or damage including without limitation to any loss of profit which may arise from reliance on any information supplied by TFA Global Pte Ltd.
The speaker(s) is neither an employee, agent nor representative of Tradu and is therefore acting independently. The opinions given are their own, constitute general market commentary, and do not constitute the opinion or advice of Tradu or any form of personal or investment advice. Tradu neither endorses nor guarantees offerings of third-party speakers, nor is Tradu responsible for the content, veracity or opinions of third-party speakers, presenters or participants.

Solana formed the rising bottom ┆ HolderStatKUCOIN:SOLUSDT has respected the $158 key support following a structured pullback from recent highs. The setup features repeated bullish continuation patterns such as triangles and consolidation. Expect a potential move toward 184+ if support holds.

Solana (SOL): Bullish Continuation after Neckline BreakoutWhat I see:
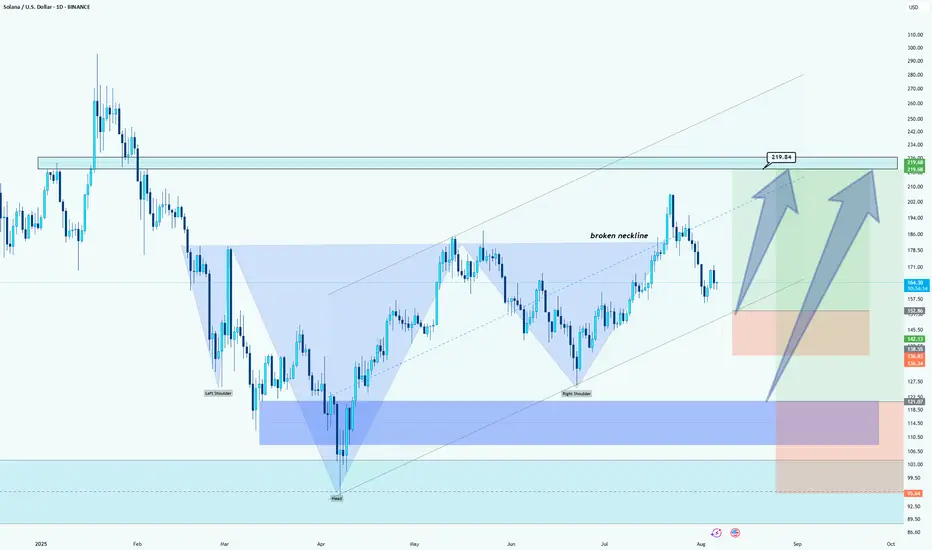
Chart Patterns (Head and Shoulders): The chart illustrates a classic "Head and Shoulders" pattern. The left shoulder, head, and right shoulder are formed, and the neckline (the blue dashed line) has been broken, which suggests that the price could rise towards the target zone above the broken neckline.
Target Price: Based on the pattern and technical analysis, the potential target for the price could be around $219.84, as indicated by the box in the upper right corner. This target aligns with the upward trend continuation from the broken neckline.
Support Zones: There are several key support levels below the current price, including the lower zone marked in blue around $95.50 and the potential demand area in the middle blue zone (around $136.34). These could act as areas for price to rebound from if there's a pullback.
Trend Line and Movement: The dotted blue trend line suggests an ascending trend, showing higher lows, and the price is likely to continue upward after the recent breakout above the neckline.
Given the broken neckline and the formation of the Head and Shoulders pattern, the bullish scenario appears more likely. A price target of around $219.84 seems feasible if the upward momentum continues. However, if the price fails to hold above the neckline or reverses, the support zones could provide areas for potential price bounces, with the $136.34 region as a significant level to watch for possible buying opportunities. Therefore, the most probable outcome aligns with the bullish scenario (towards $219.84).
SOLUSD Sell Limit ordersHi everyone.
I've set 3 orders to go short on Solana.
Please consider That if the second order triggered, Risk free the first order and If the third order triggered so you need to risk free the second order too...
These TP levels are based on Fib Levels. But if you want you can set the first TPs at 1:1RR for each order.
Let's see what happen.
Good luck everyone.

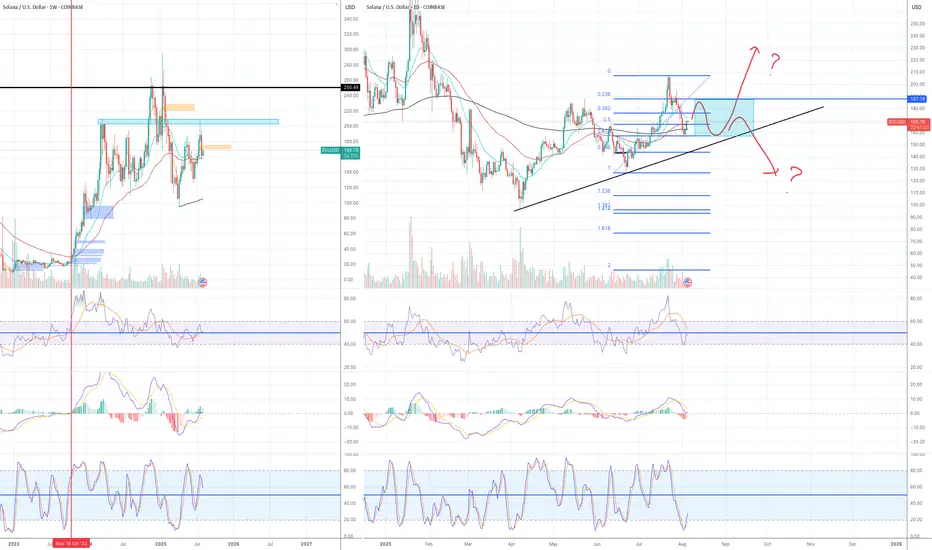
Bullish but not bullish enough yet for a tradeMy overall bias for Solana is bullish. Currently I only own the underlying asset, but I have been waiting for the right set up to arrive to open a leveraged long position.
The way I am looking at the market right now:
Monthly chart:
In the last crypto cycle, Solana reached ATH in Nov 2021 and started to enter the macro bear trend. The price dropped sharply from $260 to $75 in the matter of three months. The price temporarily bounced up to $125 approx. (Red horizontal line in the chart) but it was a dead cat bounce. It failed to move above it and it was the beginning of the official bear market.
When you look at the price action of the last 18 months in a monthly chart, the price has been mostly moving between $125 and $205. However, the price wicked down to $96 in April this year. Since then the price is forming higher high higher low despite messy price action.
Both RSI and MACD are in the bull territory but they are slowly rolling to the downside. Stochastic on the other hand reached oversold territory and is now moving to the upside.
As long as RSI and MACD stay in the bull zone, the current price move is a corrective one.
Currently the price is sitting in the middle of the range bound of the last 18th months.
Weekly chart:
Price is trapped in the range bound and also is the ascending parallel channel.
EMA21 and 55 are bunched up together and running horizontally.
RSI is trapped in the 40-60 range and sliding across.
MACD is tilting to the upside but failed to enter the bull zone.
Stochastic is showing bearish negative divergence.
Base on all the indicators and price action in the weekly chart tell me the price is in a slow decline, but it is more like a tight sideway consolidation.
Daily chart:
EMA21> EMA 55> EMA200 - bullish but not perfect
EMA 200 is dead horizontal and a today's daily candle is sitting on EMA200.
MACD is entering the bear zone. MACD line is about to enter the bear zone. But the stochastic reached oversold territory and now is moving to the upside.
Conclusion:
My number one rule of trading is I stay away from trading when EMA200 is dead flat and the price is oscillating around it. I have lost money numerous times by trying to guess which way the price will move. No point of front running when EMA200 is flat. The price will break out eventually but I need to wait for a clear direction to emerge.
As I wrote in my previous articles. I think the current price move is a corrective one. The price will eventually move to the upside but I have no idea when. What I am focusing on now is to watch where the price will retrace to before it takes off in the daily chart. It may not take off, so I just want to wait and see.
There are a few fair value gap in the Fib 0.618 and 0.786 zone (blue rectangular box) and it is also where the ascending trendline intersects. So it is possible for the price to move further down to that area.

SOL Institutional Capital Fuels Bull Run SpeculationSolana's Ascent: A Perfect Storm of Adoption and Institutional Capital Fuels Bull Run Speculation
A powerful and rare confluence of tangible real-world adoption, significant institutional investment, and bullish technical indicators is generating a palpable buzz around Solana (SOL). The high-performance blockchain, often touted as a leading "Ethereum killer," is experiencing a resurgence that has captured the market's attention. After a period of sideways consolidation, SOL has decisively broken through key psychological and technical price levels, igniting speculation that this may be the start of a sustained and powerful bull run.
The narrative driving this optimism is not based on fleeting hype but on two concrete, fundamental pillars. The first is the global shipment of Solana Mobile's second-generation smartphone, the "Seeker," a device engineered to onboard millions into the Web3 ecosystem by seamlessly integrating crypto into the user's daily life. The second is a powerful vote of confidence from the traditional finance world, where a growing number of publicly traded companies are aggressively accumulating SOL for their corporate treasuries, treating it as a strategic reserve asset. As these foundational tailwinds gather force, technical charts are beginning to align, suggesting that the path of least resistance for Solana's price may soon be sharply upward.
The Seeker Phone: Solana's Trojan Horse for Mass Adoption
Perhaps the most visible and innovative catalyst is the global rollout of the Seeker smartphone. Following up on its first-generation "Saga" device, Solana Mobile has initiated the shipment of tens of thousands of pre-ordered Seeker phones to a global audience. The market's reception has been nothing short of explosive, with pre-orders soaring past 150,000 units—a dramatic increase from the 20,000 total sales of its predecessor. This overwhelming demand underscores a pent-up desire for a mobile-native Web3 experience.
But the Seeker is far more than just a piece of hardware; it represents a strategic masterstroke to solve the persistent problem of user experience in the crypto space. For years, interacting with decentralized applications (dApps) on mobile has been a clunky, insecure, and fragmented process, creating a high barrier to entry for the average consumer. The Seeker directly addresses these pain points. It features a built-in crypto wallet and a hardware-isolated "Seed Vault," which secures a user's private keys in a protected environment within the phone, drastically enhancing security and simplifying transactions.
This mobile-first approach creates a powerful economic flywheel. Priced accessibly, the phone is projected to generate substantial revenue for Solana Mobile. However, its true value lies in its ability to foster a vibrant, self-sustaining ecosystem. Each device includes a "Genesis NFT," a digital key that unlocks exclusive airdrops, rewards, and early access to new applications. This model, which proved incredibly successful with the Saga phone and the famous BONK memecoin airdrop, gamifies participation and incentivizes users to actively explore and engage with the Solana network. It transforms the phone from a passive communication tool into an active portal for decentralized finance (DeFi), NFT marketplaces, and Web3 gaming.
Furthermore, the Seeker boasts its own decentralized dApp store, presenting a direct challenge to the incumbent duopoly of Apple and Google. By offering developers a platform with lower fees and fewer restrictions, Solana is cultivating an environment where innovation can flourish. This attracts builders to the ecosystem, leading to a richer and more diverse array of applications, which in turn attracts more users. The Seeker phone, therefore, is not just a product—it's a Trojan Horse designed to embed the Solana network into the fabric of daily life, driving network utility, transaction volume, and ultimately, sustained demand for the SOL token.
The Institutional Stampede: Big Money Places Its Bet on Solana
While the Seeker phone provides a compelling grassroots adoption narrative, it is the concurrent wave of institutional investment that adds a powerful layer of validation and financial firepower. A growing cohort of publicly traded companies is now strategically adding SOL to their corporate treasuries, signaling deep-seated, long-term confidence in the network's technology and economic potential. This trend moves Solana beyond the realm of speculative trading and into the domain of strategic corporate finance.
Leading this charge is DeFi Development Corp (DFDV), a firm that has made headlines with its aggressive accumulation strategy. The company recently purchased an additional 110,466 SOL, bringing its total holdings to a staggering 1.29 million SOL. This move is part of a publicly stated ambition to hold one SOL per outstanding company share by 2028, a strategy explicitly modeled after MicroStrategy's high-conviction Bitcoin treasury plan. By securing a multi-billion dollar line of credit for these purchases, DeFi Dev Corp is making a clear and unequivocal bet on Solana's future.
This institutional embrace extends beyond a single entity. Upexi Inc., a consumer brand holding company, has significantly increased its SOL holdings and secured a $500 million credit line for further acquisitions. Bit Mining, a prominent player in the digital asset mining space, has not only purchased millions of dollars worth of SOL but has also launched its first Solana validator, contributing directly to the network's security and decentralization. Perhaps most surprisingly, Artelo Biosciences, a Nasdaq-listed pharmaceutical company, has pivoted to include SOL in its treasury, becoming the first public pharma firm to adopt a digital asset as a reserve.
These companies are drawn to Solana for its unique combination of high throughput, low transaction costs, and yield-bearing potential. The network's ability to process thousands of transactions per second at a fraction of a penny makes it a viable platform for enterprise-grade applications. Furthermore, the ability to stake SOL and earn a consistent annual yield of 7-8% presents a compelling alternative to holding depreciating fiat currencies or low-yield government bonds. This makes SOL an attractive treasury asset that can both appreciate in value and generate a recurring revenue stream. This institutional inflow provides robust price support and has an outsized market impact, as it effectively removes large quantities of SOL from the circulating supply, creating a potential supply shock as demand continues to grow.
Coiling for a Breakout: A Technical Perspective
This potent mix of fundamental catalysts is vividly reflected in Solana's price chart, which shows the asset coiling for a potentially explosive move. After establishing a solid foundation of support, SOL has demonstrated significant strength by breaking through the crucial $160 and $162 levels. The price is now trading firmly above its 100-hourly simple moving average, a key indicator that traders use to gauge short-term trend momentum. A price holding above this moving average is generally considered a sign of bullish health.
Currently, a key bullish trend line has formed on the hourly chart, with immediate and strong support located at the $165 mark. This level now acts as the first line of defense for the bulls; as long as the price remains above it, the upward trajectory is considered intact. However, the path higher is not without obstacles. The first major test awaits at the $172 resistance zone. A decisive and high-volume break above this level would signal that buyers are in firm control and could trigger a cascade of further buying.
Should the bulls conquer $172, the next significant hurdle lies near the $180-$182 range. Overcoming this area would open the door to a more sustained rally, with analysts eyeing subsequent targets at $192 and the psychologically important $200 level. While these technical levels present challenges, the underlying momentum indicators are encouraging. The Moving Average Convergence Divergence (MACD) is showing bullish acceleration, and the Relative Strength Index (RSI) is holding strong above the 50 midpoint, indicating that buying pressure is outweighing selling pressure.
Of course, no market moves in a straight line. A failure to break the $172 resistance could lead to a temporary pullback. If the $165 support level were to fail, the next support zones would be found near $160 and $155. A break below these levels could signal a short-term bearish reversal and would invalidate the immediate bullish thesis. However, given the powerful fundamental drivers at play, many analysts believe that any such dips would likely be viewed as buying opportunities.
The Verdict: Is This the Definitive Catalyst?
Solana currently finds itself in an exceptionally strong position. It is one of the few blockchain projects that can boast a clear, tangible strategy for mass adoption through its mobile initiatives. The Seeker phone is a game-changer, providing a seamless on-ramp to Web3 that could onboard a new generation of users.
This powerful fundamental narrative is being amplified and validated by a wave of institutional capital. The strategic accumulation of SOL by public companies lends the asset a new level of legitimacy and provides a powerful source of demand that is unlikely to waver based on short-term market fluctuations.
When these two forces are combined with a bullish technical structure, the result is a perfect storm of positive catalysts. While the broader crypto market will always be subject to macroeconomic factors and regulatory shifts, Solana has carved out a uniquely compelling growth story. The immediate challenge is for the bulls to maintain their momentum and decisively break through the upcoming resistance zones. If they succeed, this confluence of events may very well be remembered as the definitive catalyst that propelled Solana into its next major bull run, solidifying its position not just as a competitor, but as a leader in the new digital economy.
SOL 1H – Demand Zone Bounce Brewing, Can Bulls Reach $205 Again?Solana is once again testing its high-volume demand zone near $155–$160 — a level that previously launched it toward local highs near $210. With price dipping back into this area and Stoch RSI bottoming out, the stage is set for a potential bounce play.
🔹 Structure & Key Zones
The blue box marks a clear price memory zone — tested multiple times throughout late July and early August.
Each bounce from this zone has led to significant rallies — suggesting strong underlying demand.
Two major resistance levels remain overhead: ~$195 (lower high supply) and ~$210 (range high).
🔹 Momentum Context
Stoch RSI is once again in the oversold zone, hinting at possible short-term reversal momentum.
A clean reaction from this demand area could lead to a strong leg higher — especially if the $170–$175 zone is reclaimed.
🔹 Trade Scenario
Potential setup: price tags demand → forms a local higher low → pushes through short-term resistance toward the upper range.
If this bounce plays out, bulls may target the $195–$205 zone — creating a potential 30%+ move.
Is SOL ready to bounce — or will this demand zone finally give way?
Comment below and share your setup 👇

SOLANA CRYPTO THE RESULT
Follow for more Simple And accurate swing analysis on Indices, Currency, Commodities.
S
Solana is forming the falling wedge ┆ HolderStatBYBIT:SOLUSDT is moving within a falling channel after the recent drop from $200. Previous triangle breakouts led to rallies, and the current setup resembles earlier accumulation zones. A break above the channel could lead to $180 upside.
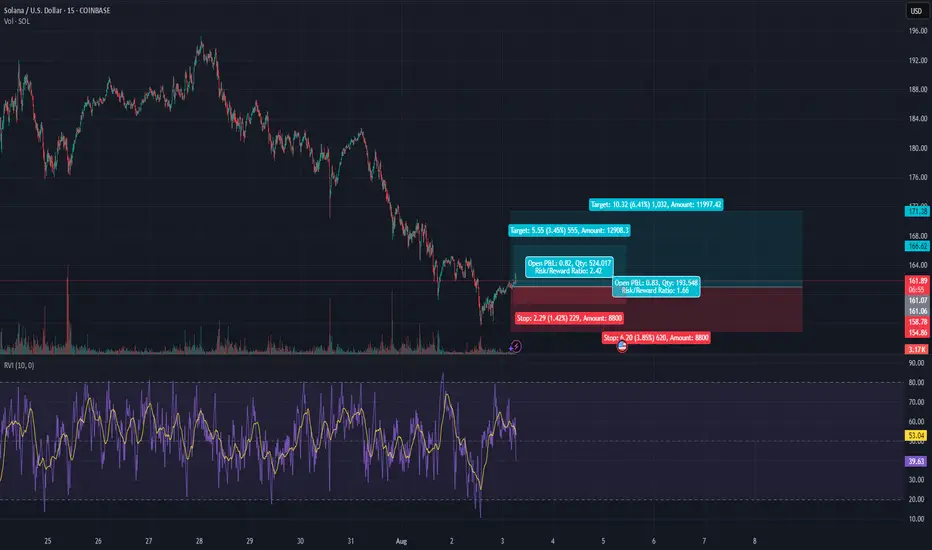
SOL 15m Ready to Rumble? Possible Double Setup!Two decent setups on Solana’s 15m, one bounce play off key support, the other a breakout rip targeting quant resistance.
Setup #1 — Mean Reversion Long:
• Entry: 161 to 162
• Stop: 158.78 (sits on quant S1 = 158.67)
• Target: 166.62
• R/R: 2.4x
This setup rides the bounce from support that matches pivot S1. Confirm with candle wick + volume punch.
Setup #2 — Breakout Continuation:
• Entry: Above 166.62
• Stop: 164 (tight) or 154.86 (sits above quant S2 = 153.41)
• Target 1: 171.38 (just under quant R1 = 172.46)
• Target 2: 180.99 (quant R2 if price rips)
• R/R: 1.6x to 3.4x
Break needs volume. R1 is the battlefield. If we nuke through, R2’s next.
Quant Levels to monitor:
• Support:
S1 = 158.67
S2 = 153.41
• Resistance:
R1 = 172.46
R2 = 180.99
R3 = 186.25
Daily ATR ~11 pts — volatility is favorable
Structure and confluence are clean. Execution depends on price confirmation.
SOLUSDT📊 #SOLUSDT
⏱ TIME: 1D
⭕️risk: mid
📍The initial buying market: 168-169
📌TP1: 192$
📌TP2: 224$
⛔️SL: 144$
❌These analyzes are just to give a better perspective for you dear ones
Do not base on buying and selling❌

SOLUSDT- Golden Pocket Bounce: Bullish Phase or Another Fakeout?🔍 In-Depth Technical Analysis (1D Timeframe)
The SOL/USDT pair is currently showing a highly significant technical reaction as price bounces from the Fibonacci Retracement 0.5 - 0.618 zone (also known as the Golden Pocket), located between $166.63 - $157.13.
This level also aligns perfectly with a historical demand zone that has previously acted as a strong support during high-volume selloffs, creating a powerful confluence area.
---
🧩 Market Structure & Pattern
✅ Golden Pocket + Demand Zone: This overlap strengthens the probability of a valid bullish reversal.
🟠 Previous Movement: Price dropped from the recent swing high near $188 after failing to break through major resistance.
📉 Short-Term Downtrend: Currently in a corrective phase after an earlier bullish run.
---
🟢 Bullish Scenario (Rebound Confirmed from Golden Pocket)
If the price manages to hold above the $157 - $166 range and prints a bullish candle with volume confirmation:
1. A bullish breakout above $179 and more importantly $187.80 could open the door to further upside.
2. Potential midterm bullish targets:
🎯 Target 1: $205.69 (key psychological + structural level)
🎯 Target 2: $218.13 (previous reaction zone)
🎯 Target 3: $257.10
🎯 Target 4 (macro): $295.14
> The current zone offers an attractive risk-to-reward opportunity for swing traders, as long as the higher low structure is maintained.
---
🔴 Bearish Scenario (Breakdown from Key Support Zone)
Should the price break below $157 with strong selling volume:
1. That would invalidate the bullish setup and suggest a shift in structure.
2. Potential deeper correction targets include:
⚠️ Support 1: $140 (minor support from past structure)
⚠️ Support 2: $122 - $110 (major support zone from March–April 2025)
> A confirmed breakdown here would likely initiate a lower high – lower low structure, signaling a possible shift into a bearish medium-term trend.
---
📌 Additional Key Indicators to Watch
🔄 Volume Spike: Essential for validating any breakout or breakdown.
📉 Daily RSI: If RSI shows bullish divergence or bounces from oversold territory, that would strengthen the bullish case.
⏳ Daily Candle Close: Monitor the next 2–3 daily candle closes around this key zone for directional confirmation.
---
💡 Conclusion
SOL is at a crucial inflection point. The reaction around the $157 - $166 support confluence will likely determine the medium-term trend:
Bullish: If price reclaims $179–$188 zone with strong momentum
Bearish: If price breaks below $157 and closes with volume
This could be a high-reward opportunity for technical traders if confirmed properly.
---
🧠 Suggested Strategy:
🔹 Entry: Upon bullish confirmation in current demand zone
🔹 Stop Loss: Below $155 (for swing setups)
🔹 Take Profit Zones: $179 → $205 → $218 → $257+
#SOLUSDT #Solana #CryptoTechnicalAnalysis #FibonacciLevels #GoldenPocket #PriceAction #CryptoReversal #SwingTradeSetup #Altcoins #CryptoChart

Still bullish My overall bias for Solana is bullish.
It has been a difficult asset to trade, however, I can still see bullish momentum is building up in higher time frames:
Weekly:
1) MACD line (faster line) has finally entered the bull zone since it dropped to $95 on April 25.
2) RSI line (orange one) has entered the bull zone.
3) EMA 5 > EMA21> EMA 55
Daily:
1) EMA 21> EMA55> EMA200
2) MACD lines are still in the bull zone.
3) Stochastic has reached the oversold territory and crossed to the upside.
4) The price is still forming higher high higher low above the ascending trendline.
5) The price has retraced to Fib 0.618 and now it is bouncing up.
6) The daily candle on 2n August closed at Fib 0.618 and yesterday's candle closed above both EMA55 and 200.
As I mentioned in my previous articles, when EMA55 crosses above EMA200, the price often retraces significantly before it starts to move to the upside. So I was prepared for the price to drop to Fib 0.382, 0.5, 0.618 or 0.786. At the moment, Fib 0.618 seems to be working as the lines of support.
The current price action looks good for the bull, however, $185-200 zone has been a very tough area to break. Therefore, I am prepared for a few scenarios:
Scenario 1: The price will move to Fib 0236 zone at $188 area. It fails to break above and drops to retest either the ascending trendline or wicks down to Fib 0.786/$143 area.
Scenario 2: The price will move to Fib 0.236 zone, consolidates in the area and moves up.
Scenario 3: It fails to move above Fib 0.236 level, drops below the ascending trendline and Fib 0.786. If it happens, I need to re assess my bullish bias.