SOL/USDT – Accumulation or Continuation? Key Support!SOL/USDT on the 8-hour timeframe is still moving within a bearish corrective structure / broader downtrend, characterized by a series of lower highs and lower lows since the rejection from the 230+ area.
Currently, price is trading inside a strong historical demand zone at 127–121, which previously acted as a major accumulation and bounce area.
Price is now consolidating above this demand zone while pressing against a descending trendline, making this area a critical decision zone for the next major move.
---
Pattern & Price Structure
1. Descending Trendline (Bearish Pressure)
The descending trendline remains valid and unbroken
Each recovery move continues to be capped by this trendline
Indicates seller dominance is still present
2. Demand Zone / Support Base (127 – 121)
The yellow box marks a strong demand zone
Multiple lower-wick rejections indicate active buying interest
Price is forming a base / consolidation range above support
3. Compression Pattern (Range Tightening)
Price is compressed between:
Dynamic resistance (descending trendline)
Static support (demand zone)
This structure often leads to a high-momentum breakout
---
Key Levels
Dynamic Resistance: Descending trendline
Horizontal Resistances:
144
154.5
167
177
Major Support:
127
121
Invalidation Level:
Strong close below 121
---
Bullish Scenario
The bullish scenario is valid if:
1. Price holds above the 127–121 demand zone
2. A strong candle close breaks above the descending trendline
3. Volume expansion confirms the breakout
Upside Targets:
144 (minor resistance)
154.5 (key reaction level)
167 (mid-range resistance)
177 (major resistance)
A confirmed breakout above the trendline may signal a trend reversal or bullish continuation from a base structure.
---
Bearish Scenario
The bearish scenario occurs if:
1. Price fails to break the descending trendline
2. A strong breakdown and close below 121
3. The demand zone fails to absorb selling pressure
Downside Risk:
116.8 (previous low)
Further downside could form new lower lows, continuing the broader bearish trend
---
Conclusion
SOL/USDT is currently at a critical decision area.
The 127–121 demand zone is the key level to watch:
Holding support + trendline breakout → bullish reversal potential
Demand breakdown → bearish continuation
Patience is required. Wait for clear breakout or breakdown confirmation before committing to a directional trade.
---
#SOLUSDT #Solana #CryptoAnalysis #TechnicalAnalysis #DescendingTrendline #DemandZone #SupportResistance #AltcoinTrading #CryptoMarket
SOLUSDC

SOL/USDT – Major Support Zone the Key to Bullish Continuation?SOL/USDT on the weekly timeframe (1W) remains in a long-term bullish market structure, despite the current corrective phase. The rejection from the major resistance area around 240 – 250 USDT has triggered a healthy pullback. As long as the key support zone holds, the broader uptrend structure remains valid.
This correction is best interpreted as a reset phase, not a trend reversal.
---
Market Structure & Price Action
From a structural perspective, SOL continues to print:
Higher Highs and Higher Lows (macro bullish structure)
Signs of distribution near major resistance
A controlled pullback toward a high-probability demand zone
Identified Price Pattern
Range Distribution → Minor Breakdown → Deep Retracement
Bullish continuation setup while holding demand
The yellow zone 94 – 78 USDT represents:
Previous weekly resistance turned support
Strong institutional demand zone
A key reaction area from the last major impulsive move
---
Key Technical Levels
Major Resistance:
240 – 250 USDT
Intermediate Support / Reaction Zone:
120 – 130 USDT
Key Support (Yellow Zone):
94 – 78 USDT
Bullish Invalidation Level:
A strong weekly close below 78 USDT
---
Bullish Scenario
If price:
Holds the 94 – 78 USDT zone
Forms bullish weekly confirmation (long lower wick, bullish engulfing, strong close above support)
Potential upside path:
1. Bounce toward 125 – 140 USDT
2. Continuation to 180 – 200 USDT
3. Retest of 240 – 250 USDT
4. A confirmed breakout opens the door for new all-time highs
Bullish Conclusion:
The yellow zone acts as a high-confidence buy-the-dip area on the weekly structure, as long as it remains intact.
---
Bearish Scenario
If price:
Closes decisively below 78 USDT on the weekly timeframe
Fails to reclaim the key support zone
Then the risk shifts to:
1. Breakdown of the macro bullish structure
2. Decline toward 60 – 55 USDT
3. Extension toward 40 – 30 USDT (historical support region)
Bearish Conclusion:
A confirmed weekly breakdown below 78 USDT signals a long-term trend reversal, not just a correction.
---
Final Conclusion
SOL remains structurally bullish on the higher timeframe, and the current pullback is still considered healthy and technical.
The 94 – 78 USDT zone is the decisive level that will determine the next major move:
Hold → bullish continuation
Break → macro trend shift
Patience and weekly candle confirmation are crucial.
---
#SOLUSDT #Solana #CryptoAnalysis #WeeklyChart #KeySupport #DemandZone #BullishStructure #AltcoinMarket #PriceAction #MarketStructure

SOL bullish flagSOL has formed a bullish flag, the movement is still within the pattern
Liquidity has formed at the upper level, which the price is more likely to reach
At the bottom of the pattern, an upward movement is observed, as each subsequent bottom is higher than the previous one
Full breakdown with levels and graphs on the website

Solana is forming a bullish flagSOL has formed a bullish flag, with movement in a local uptrend being established. The high in the purple areas is highly likely to be broken
Two 4H imbalances are located above. This is where sellers are most likely to react

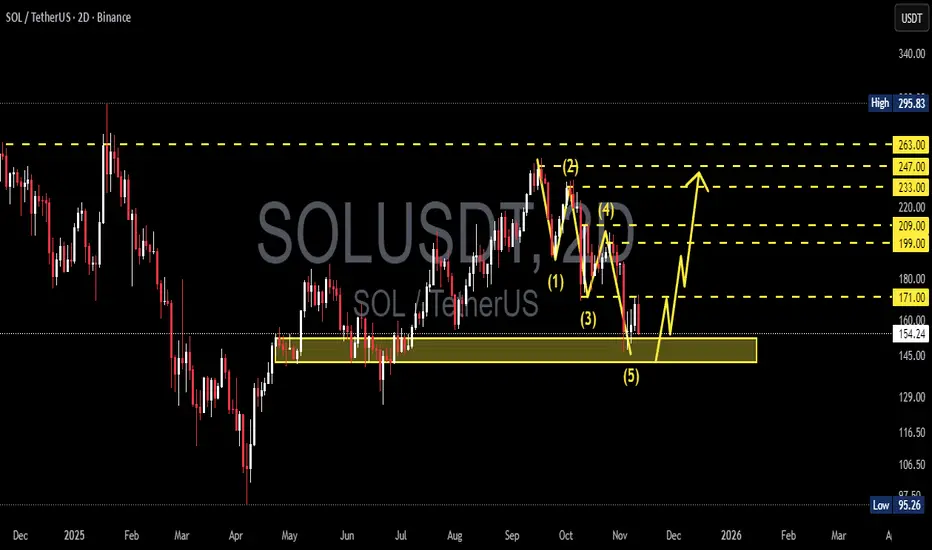
SOL/USDT — Will Solana Start a Major Reversal from Here?Solana (SOL/USDT) is now sitting at a critical turning point, as the market tests a major historical demand zone between 152–142 USDT. After completing a clear 5-wave impulsive decline, sellers appear to be losing momentum, while buyers are starting to react around this key area.
This yellow zone has previously acted as a strong demand base, triggering powerful rallies in the past. Now, it’s once again becoming the battlefield between bulls and bears — and the outcome could define Solana’s direction for the coming months.
---
Pattern & Structure
1. 5-Wave Decline (Elliott Wave Structure):
The chart shows a clean 5-wave downward pattern, often marking the end of a corrective phase. If valid, the next move could be an ABC corrective rally, signaling the start of a broader bullish reversal.
2. Critical Demand Zone (152–142):
This area serves as a strong institutional accumulation zone, where smart money often steps in. A confirmed rebound from here could ignite the next leg higher.
3. Layered Resistance Levels:
Key resistance levels are lined up at
171 → 199 → 209 → 233 → 247 → 263.
Each breakout acts as a step confirming a stronger bullish trend.
4. Fibonacci Confluence:
The 38–61% retracement levels align with 199–263, strengthening the case for this region as a natural recovery target zone in the next upward phase.
---
Bullish Scenario — “The Reversal Zone Awakens”
If price holds above 152 and forms a strong bullish reversal candle (engulfing / hammer on the 2D chart), we could see:
Target 1: 171 → first confirmation of trend reversal.
Target 2: 199–209 → mid-level recovery zone.
Target 3: 233–247 → full corrective phase.
Extended Target: 263 → upper resistance and profit-taking zone.
This scenario represents the potential end of a multi-month bearish phase and the beginning of a fresh bullish cycle.
A 2D close above 171 would strongly confirm the reversal structure.
Additional confirmation: bullish divergence on RSI, increasing buy volume, or formation of higher lows on the 2D timeframe.
---
Bearish Scenario — “Breaking the Floor”
If the price closes below 142, the current demand zone will flip into resistance, signaling continuation of the downtrend toward:
First target: around 116 (minor demand).
Main target: 95 (previous historical low).
A breakdown below 142 would suggest that wave (5) may not yet be complete, indicating one final capitulation wave before a potential long-term bottom forms.
---
Strategy & Outlook
Conservative traders: Wait for a confirmed 2D close above 171 before entering any bullish setups.
Aggressive traders: Consider gradual accumulation near 152–142 with tight SL below 142.
Risk management: Maintain a minimum R:R of 1:2, and avoid averaging down blindly without confirmation.
Multi-timeframe confirmation: Watch daily and 3D candles for stronger conviction signals.
---
Market Psychology
This current phase represents a “capitulation zone” — where retail confidence fades while smart money starts positioning quietly.
Historically, major trend reversals are born from such exhaustion zones. If SOL can defend this support area, it could be the beginning of a powerful new uptrend toward 200+ and beyond.
---
Conclusion
Zone 152–142 = critical buyer defense line.
Reaction in this zone will determine the next macro trend for Q4 2025 – Q1 2026.
Breakdown → downside target 95.
Reversal → upside potential up to 263.
---
#Solana #SOLUSDT #CryptoAnalysis #TechnicalAnalysis #SupportResistance #ElliottWave #CryptoReversal #SwingTrade #PriceAction #AltcoinSeason #SolanaAnalysis
SOL's Situation, A Comprehensive Analysis !!!It appears that the price is forming a cup and handle pattern, and if this occurs, it could push the price above $215.
Best regards CobraVanguard.💚
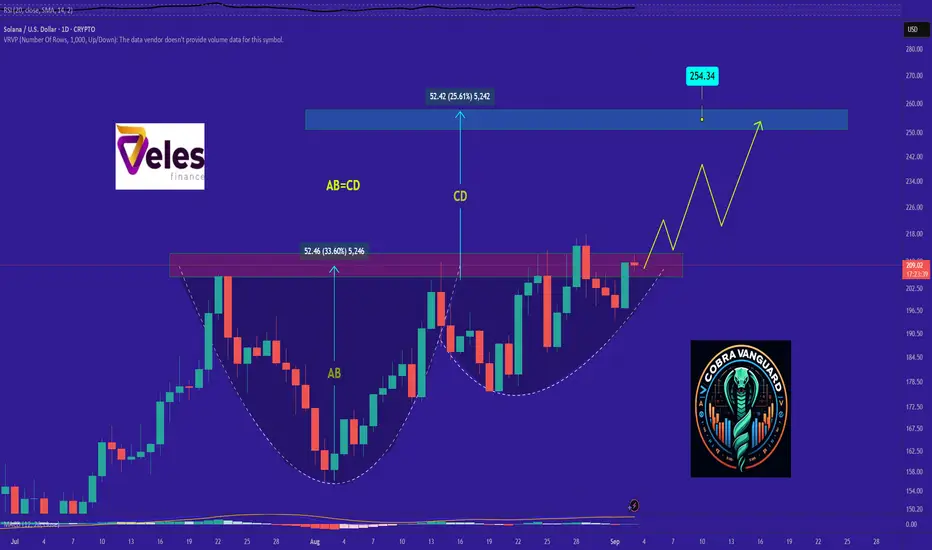
SOLANA's Situation (4h) !!!It appears that the price is forming a cup and handle pattern, and if this occurs, it could push the price above $210.
Best regards CobraVanguard.💚

SOLANA Potential Bullish Breakout OpportunitySolana seems to exhibit signs of a potential Bullish Breakout on the Shorter timeframes as the price action may form a credible Higher High with multiple confluences through key Fibonacci and Support levels which presents us with a potential long opportunity.
Trade Plan:
Entry : CMP
Stop Loss : 172
TP 1: 202.5

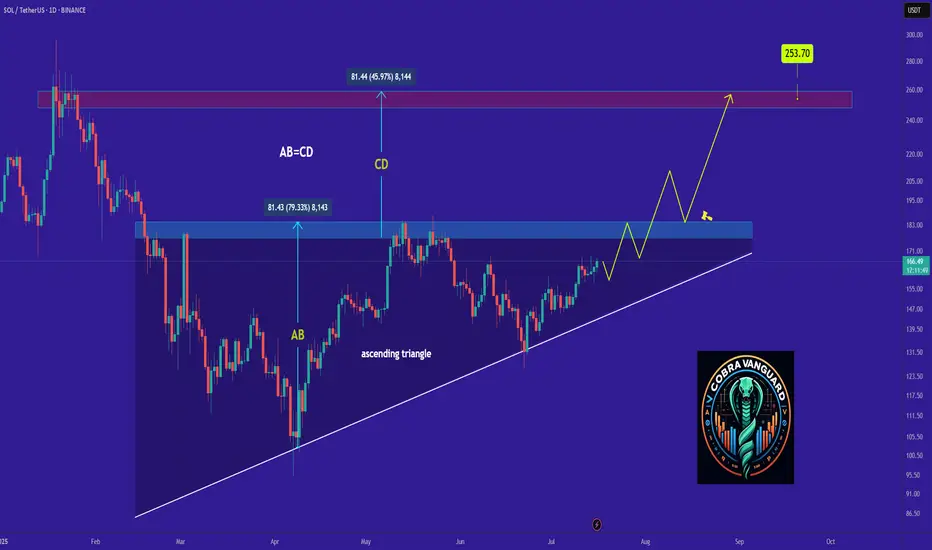
SOLANA's Situation, A Comprehensive Analysis !!!The price on the DAILY timeframe is within an ascending triangle, which can be promising. If the price breaks this pattern with bullish candles, it could easily rise by the distance of AB=CD .
Best regards CobraVanguard.💚
SOLUSDT Bullish Flag Pattern!Price has formed a Bullish Flag pattern on the daily timeframe. After multiple touches of both support and resistance, the price has now broken out above the falg resistance, signaling a potential trend reversal. and price trading above 50 and 100 EMA
Currently, SOL is bouncing from the channel breakout level, indicating strong bullish momentum. A clean breakout candle confirms buying interest, and the setup favors a strong bullish continuation if the breakout sustains.
Entry: Above $150
Stop-loss: Below $135
CRYPTOCAP:SOL TRADENATION:SOLANA

Opened liquidity pool for SOLUSDC💰Opened a SOL/USDC liquidity pool
1% range with approximately $300
I want to create detailed statistics and understand how well it performs within narrow ranges.

Why Solana (SOL) might correct to the $75–$85 range?Let’s break down why Solana (SOL) might correct to the $75–$85 range, considering fundamental factors, news, events, technical analysis, Coinbase orders, and on-chain activity.
Fundamental Factors
Solana is a high-performance blockchain known for its speed and low fees. However, in 2024–2025, it faces several challenges that could impact its price. One of these challenges is the phenomenon of meme tokens, often referred to as the " Meme Casino ," which has become a significant part of Solana’s ecosystem.
1. Decline in DeFi, NFT, and Meme Token Activity
Solana has been widely used for DeFi and NFT projects and has established itself as the leading blockchain for meme tokens. However, in 2024–2025, these sectors are experiencing a downturn. For instance, NFT trading volume and DeFi activity on Solana have significantly dropped compared to their peak levels in 2021–2022. Interest in meme tokens like BONK, which temporarily boosted demand for SOL, may also fade due to the volatility of this market. This reduces the demand for SOL tokens for transactions within the ecosystem, putting downward pressure on the price and diminishing the token’s fundamental value.
2. Competition from Other Blockchains
Solana competes with networks like Ethereum (following the Ethereum 2.0 upgrade and the introduction of sharding), Arbitrum, Optimism, and newer players such as Sui and Aptos. These blockchains also offer high performance and low fees, potentially drawing developers and users away from Solana and reducing interest in SOL.
3. Regulatory Risks
In 2024–2025, regulators worldwide, particularly in the U.S., are tightening control over cryptocurrencies. Meme tokens, which drive a significant portion of Solana’s activity, are often associated with scams. I believe that 99.999% of meme tokens are scam coins, and this could lead to regulatory actions that harm the meme sector on Solana. Since Solana heavily relies on this sector, the price of SOL could plummet to levels like $2–$11.
4. Declining Interest in Meme Tokens on Solana
In 2023–2024, meme tokens like BONK temporarily increased Solana’s popularity and demand for SOL. However, in 2025, this hype may fade, as the meme token market is prone to sharp rises and falls. This could reduce network activity and, consequently, the price of SOL. In other words, "the music is slowly fading."
Technical Analysis
On the provided SOL/USDC chart (5-day timeframe), several key points support the idea of a correction to the $75–$85 range:
➖ Volume Profile
On the right side of the chart, the volume profile shows a significant trading volume (a thick zone) in the $75–$85 range. This indicates strong support, making it a likely area for the price to return to due to high liquidity.
➖ Trend Structure
The chart shows signs of a slowing uptrend: shorter upward impulses and increasing volatility (short candles with long wicks). This could signal a reversal or the start of a correction.
➖ Correction Target: $75–$85 Zone ("Coinbase Orders")
The $75–$85 range, marked as "Coinbase orders," is a support zone with limit buy orders. For example, on Coinbase alone, there are orders for 44,419 SOL worth $3,553,520. Similar orders may exist on other exchanges like Binance, Kraken, OKX, and others, creating a strong demand zone.
➖ Hyperliquid Liquidation Map
According to the Hyperliquid Liquidation Map, the $75–$85 range contains liquidation levels for long traders. A drop to this level could trigger a cascade of liquidations, intensifying the downward move but also attracting buyers looking for an entry point.
What Event Could Trigger a Correction?
An expected correction in Bitcoin to the $70,000–$76,000 range could act as a trigger for Solana and other cryptocurrencies to fall, as the altcoin market often follows BTC.
===
I believe this will be the last corrective bounce for cryptocurrencies, synchronized with a bounce in the S&P 500. After that, I expect all markets to enter a deep decline.
🤔🤔🤔

Solana — a correction to around $180-$200.A correction to around $180-$200, marking the start of the bearish phase.

Nothing !!!Currently, SOL is forming an ascending triangle, indicating a potential price increase. It is anticipated that the price could rise, aligning with the projected price movement (AB=CD).
However, it is crucial to wait for the triangle to break before taking any action.
Give me some energy !!
✨We spend hours finding potential opportunities and writing useful ideas, we would be happy if you support us.
Best regards CobraVanguard.💚
_ _ _ _ __ _ _ _ _ _ _ _ _ _ _ _ _ _ _ _ _ _ _ _ _ _ _ _ _ _ _ _
✅Thank you, and for more ideas, hit ❤️Like❤️ and 🌟Follow🌟!
⚠️Things can change...
The markets are always changing and even with all these signals, the market changes tend to be strong and fast!!

An overall look at SOL with my April flash crash thesis embeddedSOL is forming a massive cup-and-handle pattern overall. However, when zooming into the short-term pattern currently unfolding, I believe we will see a false breakout leg on the fifth wave, leading to a 'flash crash' in mid to late April. After this occurs, the true breakout will likely happen on the seventh wave, taking out the pattern high and running to the top of the broadening wedge pattern—or perhaps even higher—given the bigger picture of a massive cup-and-handle formation that has been developing for over three years.
Good luck, and always use a stop-loss!

The handle is now forming on a massive cup & handle on SOL.SOL is now forming the handle of a massive cup-and-handle pattern that has taken over three years to develop. If SOL breaks out of this pattern in the coming months, we could very well see a four-digit price moving forward.
Keep your eyes on this.
Good luck, and always use a stop-loss!

For Solana, the $74-$110 range.For Solana, the $74-$110 range seems like a solid Spot entry point, with long-term targets of $800-$1000.
Why $74-$110? Because Coinbase has large limit buy orders set at $74 and $85 for Solana.
Waiting for the stock market and crypto market to drop.
The right moment to enter Spot is coming soon.

$SOL: warning!**🚨 CRYPTOCAP:SOL Analysis: Major Unlock & Market Impact 🚨**
📅 **March 1st Unlock:**
Approximately 11.16 million SOL tokens (~$2 billion) are set to be released into the market.
🔗 Source: (www.eblockmedia.com)
### **What’s Happening with CRYPTOCAP:SOL ?**
After the $TRUMP pump, Solana faced a significant pullback, which was expected after such hype. However, a more concerning effect of the meme craze is the liquidity drain from the Solana ecosystem.
🔻 **Liquidity Issues:**
- Rug pulls often result in selling SOL for cash, CRYPTOCAP:USDT , or even $CRYPTOCAP:BTC.
- Exchanges like Raydium and Meteora made huge profits from fees in SOL and typically "sell to cash out".
This has led to a liquidity squeeze, causing a prolonged consolidation.
📉 **Technical Outlook:**
- Daily timeframe: Consolidation appears to be ending, and MACD is about to cross bullish, signaling a short-term relief for 1-2 weeks.
- Weekly timeframe: The bearish divergence remains strong and still needs to play out.
- A double top bearish pattern is identified, likely to push the price down.
⚠️ **March 1st Unlock - The Biggest Bearish Factor**
While 11M SOL represents only 2% of circulating supply, it comes at a bad time, adding selling pressure just as the ecosystem struggles with bearish sentiment.
### **Price Outlook:**
🛑 Short-term impact: Likely downside pressure.
✅ Long-term: Solana remains a solid and popular blockchain—it will recover.
**📉 Price Targets:**
- $160 or lower seems likely.
- Worst-case scenario: $120 , which is a major support level.
💡 Potential Buy Opportunity for long-term holders!
**DYOR!**

Why I Went Long on Solana $SOLUSDCI entered a speculative long trade on Solana, considering several key factors that suggest a potential rebound in the coming days.
Reasons for Entering Long
1. Fundamental Factor – On Saturday, the U.S. announced tariff hikes on China, Canada, and Mexico, causing market turbulence. After the initial sell-off, markets often see a partial recovery.
2. Technical Factor – SOL is in an oversold zone, increasing the likelihood of a bounce.
3. Short-Term Potential – Solana remains technically strong, and if the crypto market recovers, SOL could outperform.
Trade Parameters
• Entry Price: $213.79
• Stop-loss: $210.08 (trigger), $210 (limit)
• Take Profit: $242
• Risk Level: High, as this is a speculative trade.
I expect Solana to recover in the short term if market conditions improve.

Solana's Ecosystem and the Winds of ChangeIn the tapestry of today's financial markets, I see patterns that most do not. The current state of the Solana ecosystem reminds me of the housing market before the 2008 crash; not in its vulnerability, but in the potential for exponential growth, masked by the noise of the day-to-day market fluctuations.
Solana's Rise and the RWA Sector
Solana, with its high transaction throughput and low costs, has positioned itself as a beacon for developers and users alike. It's not just about speed; it's about utility. The Real World Asset (RWA) sector on Solana, particularly with projects like Parcl, offers a unique opportunity. Parcl enables investors to engage with real estate markets through tokenization, providing liquidity to an otherwise illiquid sector. This is akin to giving a farmer access to the stock market, only without the intermediaries that often siphon off value.
The potential here is vast, as it democratizes access to real estate investment, which has traditionally been the preserve of the wealthy. Solana's infrastructure supports this with its scalability, making it an ideal platform for such financial innovations. The growth in this sector could mirror the growth in tech stocks during the early internet boom, but with a foundation that's more robust and less speculative.
The ETF Approval Horizon
Now, about the ETF. The winds of regulatory change are upon us. With a new SEC chair who understands the transformative power of blockchain technologies rather than fear-mongering about them, we're looking at a landscape where a Solana ETF could not only be approved but could potentially redefine institutional investment in cryptocurrencies.
This isn't merely speculation; it's about understanding the shifts in regulatory climates. Much like how I foresaw the mortgage-backed securities debacle, I see a clear path for Solana ETFs, driven by the necessity for financial institutions to adapt or perish in this new digital economy. The approval of such an ETF would inject significant liquidity into Solana, potentially increasing its market cap and solidifying its position against other blockchain networks.
The future of Solana, particularly with its RWA initiatives and the potential ETF approval, could be a defining moment in blockchain's integration into traditional finance. But remember, we navigate these waters not for the calm but for the storm of opportunity they promise.
Horban Brothers,
Alex Kostenich

Testing the Hypothesis Again: High Risk, High Stakes SOLUSDCPrevious Trade Reflection
The previous trade didn’t go as planned, and the loss serves as a reminder of the heavy impact fundamentals can have on the market. Short positions, in particular, carry significant risks, and this was no exception. Failure is always a possibility, and that’s part of the trading journey.
Trump’s Memecoin Hype
Donald Trump recently launched his own memecoin, and the hype surrounding it boosted Solana’s ecosystem significantly, as the memecoin operates on Solana. While this is great news for the ecosystem and technology, it unfortunately didn’t align well with my particular trading setup.
Testing the Hypothesis Again
Despite the challenges, I’m revisiting this trade with caution. The price has spiked significantly, which makes it highly risky, but I currently have no other trade setups on my radar. This is a test of conviction and adaptability, and while the risk is sky-high, the potential for learning—and possibly profit—makes it worth the effort.
As always, proper risk management will be key here. Let’s see how this unfolds.
Risk Warning:
This trade is extremely high-risk. Please approach with caution and always consider your risk tolerance before entering similar setups.

The Case for Shorting SOLUSDT: Key ObservationsRecently, SOLUSDT has shown an impressive 28% recovery within just five days, but this level of volatility might signal a perfect setup for a short position. After analyzing the current conditions, here’s why I believe it’s time to consider shorting SOL:
1. High Volatility Signals Instability
While a 28% recovery in just five days may seem like a bullish sign, such rapid movements often indicate market instability rather than sustainable growth. Volatility on this scale can quickly lead to corrections, as prices struggle to find support at higher levels.
2. Weak Trading Volumes
Despite the sharp recovery, trading volumes remain weak. This suggests that the rally is not backed by strong buying momentum, which is critical for sustaining upward trends. Without sufficient volume, the market may struggle to push through key resistance levels.
3. Moving Averages (MA) Passed
All key moving averages (MAs) have been surpassed during this recovery, but this doesn’t necessarily indicate strength. In many cases, sharp upward movements beyond MAs can lead to overextension, creating a natural pullback as traders take profits.
4. Upper Bollinger Band Breach
The price has reached the upper Bollinger Band, a common indicator of overbought conditions. This typically signals limited upside potential and increases the likelihood of a pullback or correction.
5. Previous High Acting as Resistance
The current price is testing a significant resistance level—the previous high. Historically, such levels act as strong barriers, especially in the absence of sufficient volume or momentum to break through. This resistance further strengthens the case for a potential reversal.
Duration:
This is a short-term trade. Shorting crypto is inherently risky, especially with a fundamentally strong asset like this.
Target:
The goal is to achieve 100% profit. The entry is made on Binance with 25x leverage, using a $43.35 margin, resulting in a total position size of $1,083.
Risk:
This trade is classified as high risk, as shorting is always more dangerous than taking long positions. Proper risk management is essential.

SOL Cup & Handle pattern approaching the key breakout area.SOLANA has been building a massive cup-and-handle pattern for over four years and has yet to break out. There was a small, false breakout after the November 5th election of President Donald Trump, but the pattern has not yet played out to its full potential.
I believe that during the upcoming 'alt-coin' season, up until mid-2025, we will see SOL, at a minimum, 2X to 3X in value. On the extreme side, it could even rise as high as 10X.
Either way, SOLANA holders will be more than satisfied, assuming there are no unpredictable events that could hinder SOL's inevitable rise through price discovery to new all-time highs.
Good luck, and always use a stop loss!
