Sep 2, 2025 - SOLUSDT Long Position ReviewFollowing up on yesterday’s analysis, with each reaction to the 204.34 level, I became more confident about the presence of sellers above this zone. At the same time, since every rejection off this level was also creating a higher low , I decided to treat it as a risky long trigger.
After the breakout of this line and the 15m and 1H candle closing above it, I was still cautious, suspecting that the main sellers might be sitting around 206.24 .
At that point, as the RSI also reached its resistance line, I placed a buy stop order at 207 , just above the highest previous wick. I intentionally set the buy stop at the highest possible point to ensure that both price and RSI had convincingly broken their resistances.
This position is still open, and I’m now waiting for higher targets to be reached.
Solusdt

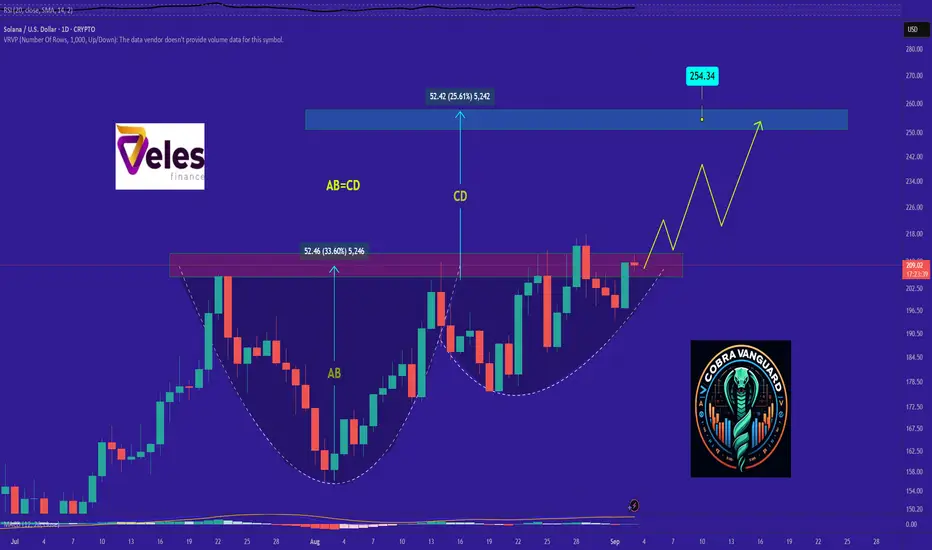
SOL's Situation, A Comprehensive Analysis !!!It appears that the price is forming a cup and handle pattern, and if this occurs, it could push the price above $215.
Best regards CobraVanguard.💚
Perfect Solana · Keep Holding · Too Early To Give UpSolana is in a perfect position. Notice the last four days that closed red. 29-Aug through 1-Sept. All these days of bearish action but no major drop. This is a marketwide bullish signal.
Marketwide because Solana is one of the big projects.
Solana is Crypto: What one does, the rest follows.
If Solana is set to continue growing, as it is shown by its massive strength, then we know the other projects that move together will do the same thing.
Some pairs can look weak and we don't know if they will continue to drop or instead reverse to start (resume) moving higher.
Seeing SOLUSDT and the perfect rising triangle; how easy Solana continues to move higher even while Bitcoin was experiencing strong bearish action, reveals what is happening behind the scenes.
Money is being shuffled around. Whales are loading up. The plan is being implemented and the resutls will be awesome.
Do you see a bullish chart here?
Does the drawings on the chart reveal the tendency and bias for this pair?
Look, the market can move lower of course, but we have a rising channel. Any drop will be bought.
Solana has much more to give. Too early to give up.
Thank you for reading.
Namaste.

SOL Swing Long IdeaSOL Swing Long Idea
📊 Market Sentiment
Overall sentiment remains bullish, supported by expectations of a 0.25% rate cut in the upcoming FOMC meeting. A weakening USD and increasing global risk appetite continue to create favorable conditions for further upside in crypto assets.
📈 Technical Analysis
The market aggressively broke the HTF bearish downtrend and closed above it on the daily timeframe. This indicates that price wants to move higher. Moreover, price also broke the HTF resistance level, which is now acting as HTF support.
📌 Game Plan
I already opened a long position since the setup is currently valid.
A possible retest around $196.5 could offer the best entry in my opinion.
📋 Trade Management
Stoploss: Daily close below HTF support at the $171 level
Target: $296 (All-Time High)
💬 Like, follow, and comment if you find this setup valuable!
⚠️ Disclaimer: This content is for informational and educational purposes only and does not constitute financial, investment, or trading advice. Always do your own research before making any financial decisions.

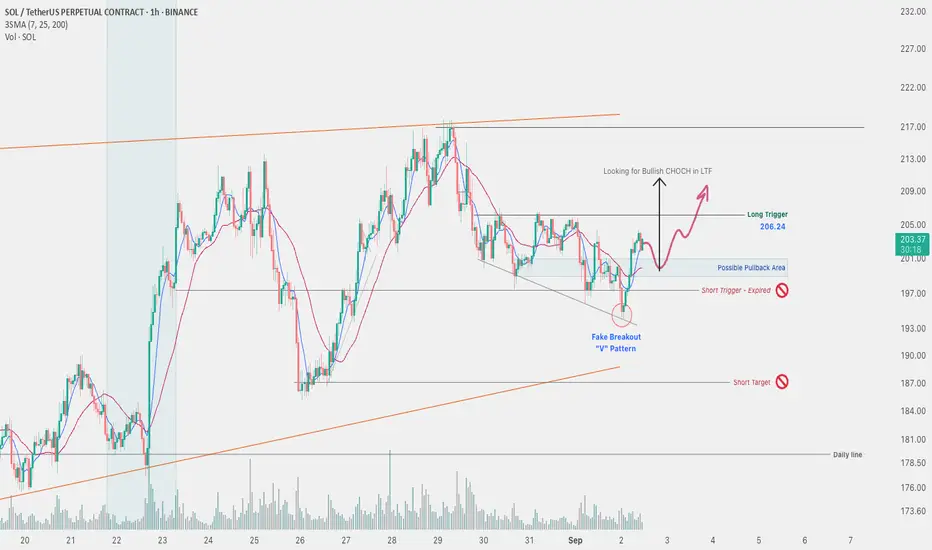
Sep 2, 2025 - SOLUSDT 1H Chart Analysis-01Despite the broader long-term uptrend in Solana, yesterday I was considering a risky short position on one of the altcoins and had already defined the triggers. Fortunately, the short trigger was broken while I wasn’t monitoring the chart, so no position was opened.
The positive development is that we saw a fake breakdown of the 197.36 support zone. After collecting liquidity below this level, Solana initiated a strong bullish move.
I’ve marked the long trigger at 206.24. However, for an early entry ، if I spot a market structure shift in the pullback zone, I’ll scale in with a partial position. Then, if the main level breaks, I’ll add more volume to the trade.
I will also check my entries with the SOLBTC chart for more confirmation
Solana -> a descending broadening wedgeHello guys!
A descending broadening wedge is forming, indicating a potential bullish reversal if price follows the typical pattern.
Pattern Analysis: Descending Broadening Wedge
The wedge is marked with two diverging trendlines, where the upper line is descending and the lower line slopes down but at a slower rate.
This pattern generally signals a reversal scenario, especially after a downtrend.
Price typically oscillates between the upper and lower trendlines before a breakout occurs.
Support and Resistance Levels
Immediate resistance: Near $205–207 (upper trendline of the wedge).
Support zone: Around $192–193, marked by the lower wedge line and a grey horizontal area, which historically acted as strong demand.
Price objective: Upon breakout, the target is around $212+, as indicated by the schematic at the top-left corner of the chart.

SOLUSDT NEXT MOVE.SOLUSDT is expecting rejection from current supply zone and it better for short trade, and expecting towards green demand area of liquidity where we can book profit of Short and take long position.

SOLUSDT (Daily)🔎 Chart Context
• Pair: SOL/USDT
• Exchange: Binance
• Timeframe: 1D (Daily)
• Current price: ~235.7
• Solana has been in a sustained uptrend since April, consistently making higher highs and higher lows.
• Chart marks a take-profit (TP) level at 236, which price is now approaching.
📊 Key Observations
1. Market Structure
• Clear bullish structure since April with a strong ascending trendline.
• Series of higher highs: 180 → 203 → 236 (targeted).
• Consolidation near the supply zone around 220–230 before breakout attempt.
2. Support & Demand Zones
• 203 – 205: Previous resistance turned into support.
• 180 – 185 (CH D): Strong demand block aligning with trendline.
• 140 – 150: Historical support, last defended in June.
3. Resistance & Supply Zones
• 236 (TP level): Immediate resistance / liquidity target.
• 260 – 280: Extended supply cluster from February selloff.
• Above 280 → clean path toward 300+.
4. Trendline
• A rising daily trendline supports the move from April lows (~100) to present.
• As long as Solana holds above this ascending trendline, the bullish structure remains intact.
📈 Bullish Scenario (Higher Probability)
• Price sustains above 203–205 support and rides trendline higher.
• Path: Pullback into trendline → continuation rally.
• Targets:
• TP1: 236 (short-term)
• TP2: 260–280 (medium-term supply zone)
• TP3: 300+ (macro extension)
📉 Bearish Scenario (Countertrend / Risk Case)
• Price fails to hold above 203 and loses the trendline.
• Pullback path:
• First stop: 180 (CH D demand)
• Deeper correction: 140–150 zone
• Break below 140 would flip structure bearish, invalidating the current uptrend.
⚡ Trading Plan
• Long Setup (Preferred):
• Entry: Retest of 203–205 support or trendline bounce.
• TP1: 236
• TP2: 260–280
• TP3: 300+
• Stop: Below 180
• Short Setup (Countertrend):
• Entry: Rejection at 236 with weakness confirmation.
• TP: 203 → 180
• Stop: Above 240

Is This the Perfect Time for a Solana Bullish Heist?🔥🚨 THIEF TRADER’S SOL/USDT HEIST PLAN! 🚨🔥
Asset: SOL/USDT "Solana vs Tether" | Plan: BULLISH HEIST MODE! 💰🎯
🎯 ENTRY: THIEF LAYER STRATEGY (MULTI-LIMIT ORDERS!)
"STEAL AT EVERY LEVEL!" 🏴☠️
📍 Layer 1: 190.00
📍 Layer 2: 185.00
📍 Layer 3: 180.00 (Add more layers if you’re a greedy thief!)
🚨 Thief Pro Tip: The more layers, the bigger the loot! Adjust based on your risk appetite.
🛑 STOP LOSS: THIEF ESCAPE ROUTE!
"DON’T GET CAUGHT!" 👮♂️
🔻 SL @ 173.00 (OG Thieves adjust SL based on risk!)
⚠️ Warning: Bears might set traps—stay sharp!
🎯 TARGET: POLICE BARRICADE AHEAD!
"CASH OUT BEFORE THEY CATCH YOU!" 🚔💨
🎯 Main Target: 240.00 (But escape early at 235.00 to be safe!)
💰 Thief Rule: Take profits like a ghost—disappear before the cops arrive! 👻
⚡ THIEF TRADING RULES:
✅ Scalpers: Only LONG side heists! Use trailing SL to lock profits!
✅ Swing Thieves: Stack layers & hold for the big score!
✅ Risk Management: Never risk more than you can steal!
📢 THIEF ALERTS!
🚨 News = Trap Zone! Avoid new trades during high-impact news!
🚨 Trailing SL = Your Getaway Car! Protect your stolen cash!
💥 BOOST THIS IDEA TO SUPPORT THE THIEF SQUAD!
"More boosts = Bigger heists next time!" 🚀💸
❤️ **Like, Share, & Follow for more CRYPTO HEIST PLANS!
⚠️ DISCLAIMER: This is NOT financial advice—just a Thief’s Master Plan! Trade at your own risk! 🎭
🚀 NEXT HEIST COMING SOON… STAY TUNED, THIEVES! 🏴☠️🔥
Sep 1, 2025 - SOLUSDT 4H Chart Big Picture
At a broader look, the SOLUSDT chart is currently testing a major historical resistance at 203.36 — a level first seen back in 2021 and again in early 2024. This zone was finally broken toward the end of 2024, but the breakout lacked momentum, and after touching around $300, the price fell back below this level.
Now, Solana appears to be making another attempt to break through this ceiling, forming a very interesting structure. On the first retest, strong selling pressure was clear and pushed the price lower. However, it didn’t take long before price came back to the zone again — this time slightly pushing sell orders higher. Since then, each touch of this level has repeated the same story, gradually forming a triangle-like shape.
To measure the strength of buyers vs sellers in this zone, I analyzed the volume across each leg. What stood out was the rising volume on bullish legs, which suggests stronger buying pressure compared to selling.
Another important observation: while price is struggling to print significantly higher highs, it’s consistently forming higher lows — another clear sign of buy-side pressure.
This analysis provides a broader, medium-to-long-term perspective on SOLUSDT. In the next post, I’ll break down the entry triggers and target levels.

Are We All Victims Of Hidden Crypto Mind Control??!??Have you ever wondered why you sell exactly when the market turns around?
How is it possible that we all fall into the same trap repeatedly?
Maybe it’s time to accept that this isn’t just luck it’s a carefully designed game.
Hello✌️
Spend 2 minutes ⏰ reading this educational material.
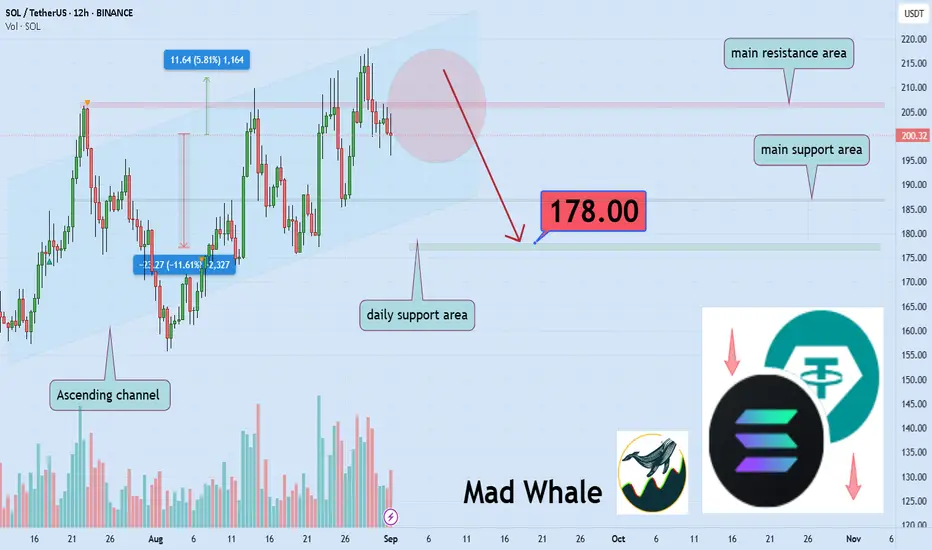
🎯 Analytical Insight on Solana:
BINANCE:SOLUSDT is moving within a Ascending channel 📉 and is approaching a key resistance level. If the main support I have marked on the chart breaks, the price could drop around 11%, targeting $178, a major daily support. In this case, Solana would lose its current channel structure ⚠️.
Now , let's dive into the educationa l section,
🧠🐋 Psychology of Deception and Role of Whales
Market makers target the collective psychology of traders guiding market moves so most react emotionally.
They know exactly how fear and greed work and even a small move can trap millions of traders.
Whales can shift market direction with heavy trades that appear natural tricking beginners into following.
These moves often cause selling at the bottom and buying at the top the exact outcome market makers want.
FOMO and fear of loss FUD fuel this game expertly controlled by market makers.
Even professional traders can fall victim because human brains react predictably.
Recognizing real versus artificial pressure and understanding whale behavior is key to avoiding heavy losses.
Using analytical tools you can identify artificial whale movements and collective psychological manipulation.
📉📊 Losing Cycles and Market Manipulation
Most traders sell at the bottom and buy at the top because the human brain is wired for survival not trading.
Market makers exploit these instinctive reactions to control collective behavior.
Artificial ups and downs create precisely designed cycles that guide the emotions of millions of traders.
These cycles often align with news to push the market toward panic selling or FOMO buying.
Even experienced traders frequently fall into these cycles because human reactions are predictable.
Fear of loss and greed for quick profits fuel this cycle perfectly orchestrated by market makers.
Every pump and dump occurs when the largest number of traders are in vulnerable positions.
Understanding these cycles and spotting artificial moves is the only way to escape systematic losses.
📰⚡️🔄🚪 News Liquidity Traps Repeating Patterns and Escape
Every news item true or false is used by market makers to gauge reactions and steer prices.
Major liquidations are not random they happen when the maximum number of traders are exposed.
These pump and dump cycles repeat endlessly and even professionals often fall victim.
Human brains react predictably which market makers exploit to control collective behavior.
Fake positive or negative news triggers fear and greed pushing traders into emotional decisions.
Liquidity traps are coordinated with news and collective sentiment for maximum effect.
The only escape is a deep understanding of market psychology and analytical tools.
With smart use of TradingView you can see the real market map and make logical choices.
🛠 TradingView Tools Weapons Against Psychological Manipulation
1. Volume Profile Liquidity Zones
This tool shows which price levels have the highest trading volume where market makers usually set their traps.
By identifying these zones you can make logical decisions before emotional reactions take over.
2. Liquidity Heatmap Hidden Orders
This map displays hidden buy and sell orders and shows why price often stops or reverses at certain levels.
It helps distinguish artificial moves from natural market behavior.
3. RSI Relative Strength Index
RSI indicates overbought or oversold conditions and divergences can reveal price manipulation.
Analyzing RSI across multiple timeframes helps separate real market pressure from artificial pressure.
4. Fibonacci Retracement Retracement Levels
Fibonacci levels predict potential reversal points often used by market makers to guide collective behavior.
Observing these levels helps detect traps and avoid unnecessary losses.
5. Alerts Smart Notifications
Alerts notify you when price reaches predefined conditions helping you act before emotions take control.
With this tool trading decisions are based on planning not impulse.
💡 5 Practical Recommendations to Counter Market Maker Manipulation
Master your tools Learn Volume Profile RSI and Fibonacci to identify traps and make logical decisions.
Avoid emotional reactions Pause before buying or selling and check if the move is real or a psychological trap.
Analyze whale behavior Track unusual volumes and heavy moves to react ahead of the crowd.
Understand market cycles Pump and dump moves often align with collective emotions consider them before entering trades.
Follow a trading plan and set Alerts Define entry/exit points and notifications to prevent crowd-driven impulsive decisions.
✨ Need a little love!
We pour love into every post your support keeps us inspired! 💛 Don’t be shy, we’d love to hear from you on comments. Big thanks, Mad Whale 🐋
📜Please make sure to do your own research before investing, and review the disclaimer provided at the end of each post.
SOLUSDT: Trade 15 min Trade Hello friends. As you seen the chart of SOLUSDT we see the correction Wave abc to reach the 212$ price and I gusse will be start the countinues the big correction.

From Rocket to Rock: Solana’s Gravity CheckCRYPTOCAP:SOL may reach $262 as network adoption accelerates and throughput metrics hit new highs, but market dynamics are rarely linear. Cyclical retracements below $100 remain a distinct possibility, reflecting the interplay between speculative sentiment, ecosystem development, and the inherent volatility of high-performance blockchain networks.

maybe dropThe market may fluctuate greatly in the short term but
the pattern is so bad and show me strong drop . save your money and good luck
Big Weekly Crypto Review: Altcoins Trend Structures This week’s review covers major altcoins and selected mid/low-cap tokens (see separate update for BTC and ETH). Focus is on macro structures, key support/resistance zones, and expected mid-term scenarios through Autumn.
BINANCE:BNBUSDT
Pulled back to the local support highlighted earlier this week. I would prefer to see a more prolonged consolidation before the next higher low forms and one more break-out into the macro resistance zone at 930–1000. However, a sustained break above Thursday’s high would increase the odds of more immediate upside momentum, potentially bypassing the longer consolidation phase.
Chart:
BINANCE:XRPUSDT
Is following the corrective structure outlined in the previous weekly report. A double bottom formation is possible at current levels, but as long as price remains below the 50DMA, the odds favor further downside into the macro support zone at 2.52–2.35 before a higher low can be established.
Chart:
CRYPTO:HYPEHUSD
Is following the price structure outlined in the previous weekly report, holding the mid-term support zone and reversing to the upside. A quick shake-out below recent August lows is possible in the coming weeks, but the next break above 50 has high odds of follow-through toward the next resistance around 65+. The price action remains among the strongest in the crypto space, suggesting potential outperformance versus most other coins during the next upside phase.
Chart:
BINANCE:SOLUSDT
Is following the trend structure outlined in the previous crypto market review: holding mid-term support and continuing its upside momentum. The near-term trend looks bullish, supported by a high-level constructive consolidation. Given seasonality, a more prolonged autumn consolidation with a series of higher lows would be constructive for a more sustainable breakout later toward year-end.
Chart:
BINANCE:LINKUSDT
Is following the trend structure suggested in previous August updates. I expect a more prolonged Autumn consolidation and base building within the higher levels of macro support: 19.5–17.5, before the next upside leg. The macro trend structure remains bullish and has a wide margin of safety, indicating potential outperformance during the next upward momentum.
Chart:
BINANCE:LTCUSDT
Price respected the mid-term resistance levels outlined in the previous August update. Mid-term support for the impulsive structure is 114–105. If these levels fail to hold, or if price cannot break above the Aug 24 highs, a more prolonged consolidation within the 108–95 macro support zone is likely.
Chart:
BINANCE:SUIUSDT
Price respected the mid-term resistance levels outlined in the previous August update and is now consolidating orderly within the mid-term support zone. Expecting a higher low to form within 3.10–2.75, continuing base formation before a potential larger-degree breakout.
Chart:
BYBIT:ONDOUSDT
Is showing potential for a double bottom formation in the coming sessions. However, if price fails to break above 1–1.05 on any recovery attempt, the risk of a deeper correction toward macro support at 0.80–0.75 increases.
Chart:
CRYPTO:TONUSD price continues to respect the mid-term support zone at 3.25–3.00, in line with the structure outlined in the Aug 9 weekly review. As long as 3.00 holds (with potential max downside extension toward 2.82), the bias remains for a higher-low formation and eventual resumption of the broader uptrend.
Chart:
BINANCE:RENDERUSDT
Price is consolidating within the mid-term support zone at 3.50–3.25. The macro structure remains bullish, but there is still a risk of further downside toward the 3–2.75 macro support if price fails to reclaim the 50DMA on any recovery attempt.
Chart:
BINANCE:UNIUSDT is following the larger-degree structure outlined in the previous August update. Key mid-term support for the impulsive structure lies at 9.70–8.80. If price fails to close above the August 22 highs or breaks below 8.80, the odds increase for a more complex corrective structure and extended consolidation.
Chart:
BINANCE:DOGEUSDT
0.22–0.20 marks a key mid-term support zone where price could form a higher low before continuing upside momentum. Failure to reclaim August highs on any breakout attempt may lead to continued selling pressure toward macro support below early August lows.
Chart:
BINANCE:TAOUSDT is evolving within a complex corrective structure. Key macro support levels are at 287–270–250. Any short-term bounce that fails to close above the 50DMA may face renewed selling pressure toward the macro support zone.
Chart:
BINANCE:FETUSDT
Was unable to close above the local resistance zone highlighted in the previous August update and continues showing downside potential. Price may attempt to form a double bottom with early August lows, followed by a bounce toward the declining 50DMA. Macro support remains at 0.50–0.45. The weekly structure stays bullish for the long term, as long as price holds above April lows.
Daily chart:
Weekly chart:
BINANCE:VIRTUALUSDT.P
Is trading within the macro support zone 1.30–0.95–0.80, following the larger-degree corrective structure first suggested in July. I am looking for price to start forming a higher low within this range.
Chart:
BYBIT:POPCATUSDT is forming a complex corrective structure. Key macro support for a potential larger-degree higher low sits at 0.23–0.19.
Chart:
$1000FLOKIUSDT key support zone to maintain macro bullish structure stands at 0.097–0.085–0.075. Holding above these levels keeps odds in favor of long-term upside continuation.
Chart:
BINANCE:SUPERUSDT is approaching the mid-term support area at 0.53–0.50. This zone may provide conditions for a higher-low formation and potential trend continuation.
Chart:
$1000000MOGUSDT.P corrective structure remains complex, but as long as price holds within the mid-term support zone at 0.89–0.77–0.70, the odds favor a potential upside reversal with a new base formation developing.
Chart:
CRYPTO:BRETT2USD is consolidating within the mid-term support zone highlighted since the Aug 9 weekly review. Watching for a higher-low formation inside 0.044–0.038 support before potential trend continuation.
Chart:
BINANCE:BONKUSDT price is in a mid-term support zone where a higher low formation could develop, setting up at least a bounce. A break below 0.0000183 would open the door to the next support levels at 0.0000165–0.0000145.
Chart:
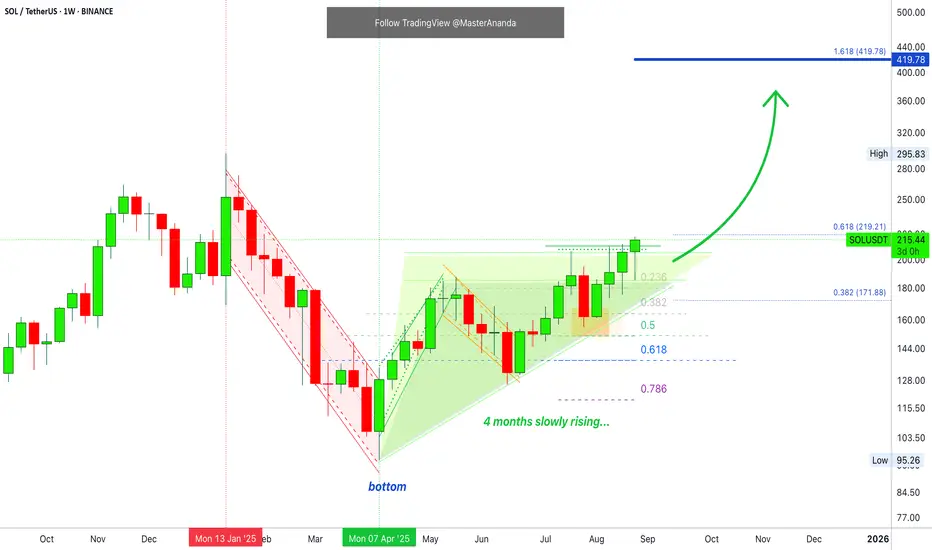
Solana (SOLUSD): Is a move to $252 coming?Solana is showing signs of a bullish reversal on the daily chart.
The price has retested and held a key support level at $196. This is a strong signal that buyers are defending this area.
Looking at the RSI, it has bounced from oversold territory, which supports the potential for a bullish reversal.
My target is $252, which represents a significant resistance level. A successful break above this could confirm a major uptrend.

Alert! Bullish Explosion About To Unfold —You've Been Warned!Hey, remember that chart I've been showing you about Solana on the daily timeframe, the luxurious rising channel?
Well, this same drawing looks many times better on the weekly; I won't even have to convince you anymore. After seeing this chart, you will be sold. Solana is going up.
Technical analysis
Consider this chart, SOLUSDT weekly. Solana has been closing three consecutive weeks green. This is the fourth green week and here comes the best part; this week is reaching its end and Solana already went down (lower wick on the candle). Once the downside is taken care of, the bulls can resume with their growth.
Four consecutive weeks closing green as bullish consolidation can only mean that a bullish explosion is about to unfold. I can give you countless of signals, but follow and trust my words; the Cryptocurrency market is rising and what you are witnessing now is only the start.
You've been warned!
Namaste.
The key is whether it can rise above 237.60
Hello, fellow traders!
Follow us to get the latest information quickly.
Have a great day.
-------------------------------------
(SOLUSDT 1M Chart)
To understand the strangely drawn trendline, you need to refer to the StochRSI indicator.
This is because the StochRSI indicator was used to draw the trendline.
When the K indicator of the StochRSI forms a peak in the overbought zone, a trend line is drawn by connecting those peaks. When the K indicator forms a peak in the oversold zone, a trend line is drawn by connecting those peaks.
When drawn this way, the trend line drawn in the overbought zone becomes the high trend line, and the trend line drawn in the oversold zone becomes the low trend line.
However, due to the long timeframe of the 1M chart, the high and low trend lines are not separated and are instead displayed as a single line.
Of the three trend lines, we need to determine whether the upward trend can continue along trend line (1).
The DOM (60) indicator is forming at 237.60, so the key question is whether it can break above this level.
Illegible areas are marked with circles.
-
(1W Chart)
Looking at the explanation of the big picture below, a major bear market is expected to begin in 2026.
However, the trend lines drawn on the chart suggest that the upward trend could continue until the first quarter of 2026.
With time remaining until the end of 2025, we need to closely monitor BTC's movements.
The DOM (60) indicator on the 1M chart is at 237.60, so the key question is whether it can break above 237.60 and maintain its price.
However, the DOM (60) ~ HA-High range formed in the 202.45-222.61 range on the 1W chart, so whether it can find support within this range is crucial.
Accordingly, the volatility period on the 1W chart is the period around the week of September 29th, i.e., September 22nd to October 5th.
Please refer to the circled area on the 1M chart for the important period.
-
(1D chart)
This volatility period ends on August 29th.
The next volatility period will be around September 7th.
After the volatility period around September 7th, we need to see if the price remains above 195.92.
If the price remains above trendline (1), it is highly likely that an attempt to rise above 222.61 will occur.
---------------------------------
As mentioned earlier on the 1W chart, the key question is whether the price can rise above 237.60.
To draw a line, we need to examine whether the 202.45-222.61 range provides support and can move upward.
From this perspective, if the 202.45-222.61 range provides support, it's considered a buying opportunity.
However, considering the basic trading strategy, buying in the DOM(-60) ~ HA-Low range and selling in the HA-High ~ DOM(60) range is necessary, so we can see that this is actually a selling opportunity.
Therefore, executing a new purchase in the 202.45-222.61 range requires a short and quick response.
If you maintain a basic trading strategy, you can either sell in installments to gain psychological stability or choose to purchase additional shares when the 202.45-222.61 range provides support.
-
Some people argue that support and resistance aren't important, but rather whether the price will rise or fall.
Yes, I agree with this.
However, to move up or down, you need to understand the support and resistance points or ranges that serve as reference points.
If you can't distinguish between these, you won't be able to trade, regardless of whether the price is rising or falling.
Therefore, you need to evaluate how important the support and resistance points or ranges formed at the current price are.
If you don't understand this, you'll end up trading by buying late after the price has risen or selling late after the price has fallen.
-
Thank you for reading to the end.
I wish you successful trading.
--------------------------------------------------
- This is an explanation of the big picture.
(3-year bull market, 1-year bear market pattern)
I will explain in more detail when the bear market begins.
------------------------------------------------------

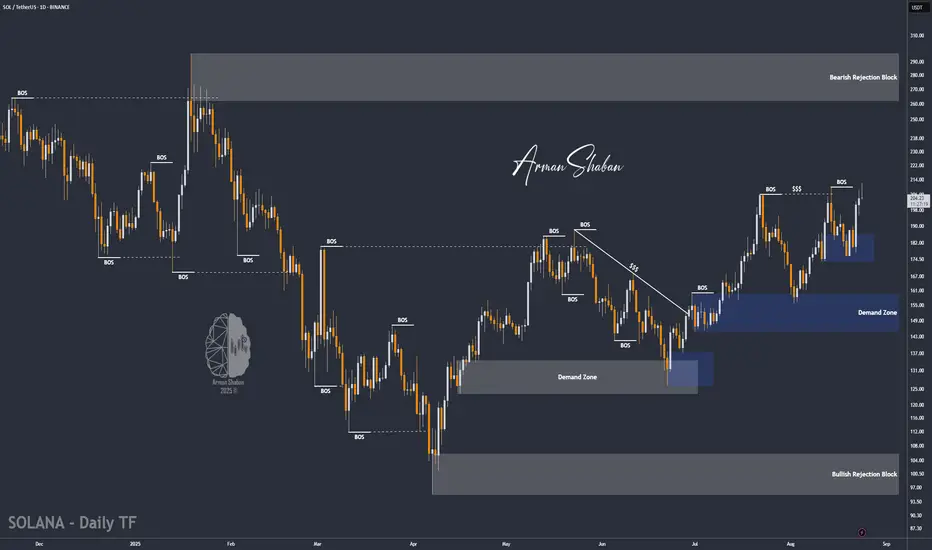
SOL/USDT | Solana Surges 43% – Is a 25% Bullish MoveStill Ahead?By analyzing the Solana (SOL) chart on the daily timeframe, we can see that the price held strongly above $171 as expected in our previous analysis and has already hit two major targets at $195 and $206, even spiking up to $212 — securing an impressive 43% rally so far! 🚀
After reaching this critical resistance zone, we’ve seen a wave of selling pressure, and SOL is currently consolidating around $204. As long as the price remains above $193 and doesn’t break below it, the bullish momentum is likely to continue, with renewed demand driving the next leg up.
The upcoming bullish targets are positioned at $220, $245, and $260, offering a potential short-term upside of over 25%.
Please support me with your likes and comments to motivate me to share more analysis with you and share your opinion about the possible trend of this chart with me !
Best Regards , Arman Shaban
Solana DailyPrice is currently trading around $214, right below a strong resistance zone near $230–$235. In the past, this level acted as supply, pushing the price down.
The chart shows a short setup with a stop loss above resistance and a target around $130, which is the next strong support area.
In simple terms:
If the price fails to break above $230, it could drop towards $130.
If it breaks and closes strongly above $230, the bearish setup becomes invalid, and the next resistance is around $263.
This setup is based on the idea that price is retesting an important resistance after a big rally.

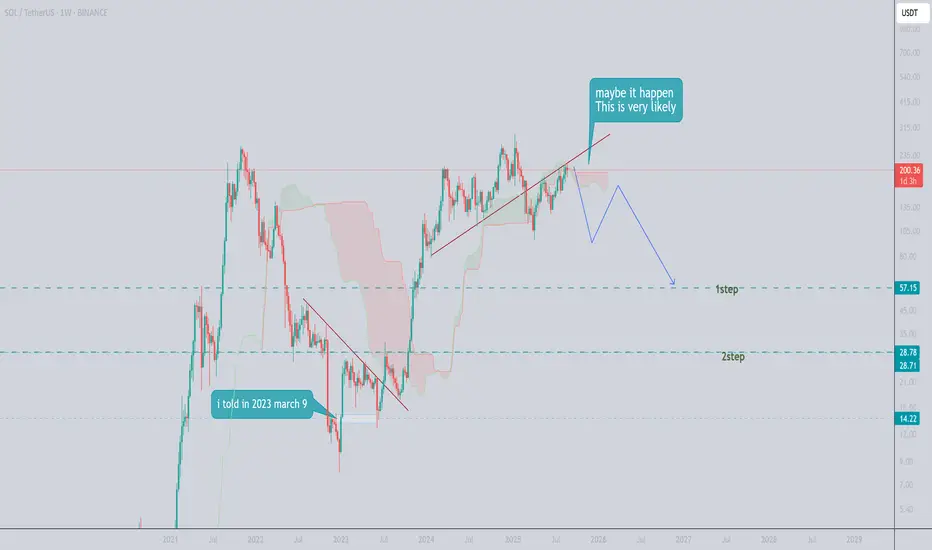
#SOL Don't worry until 240 $.but after that, 60 $ is coming.#SOL Don't worry until 240 $.but after that, 60 $ is coming.
#SOL Crash. We already warned when SOL is Trading above 240 $ ..
Past Analysis also attached.

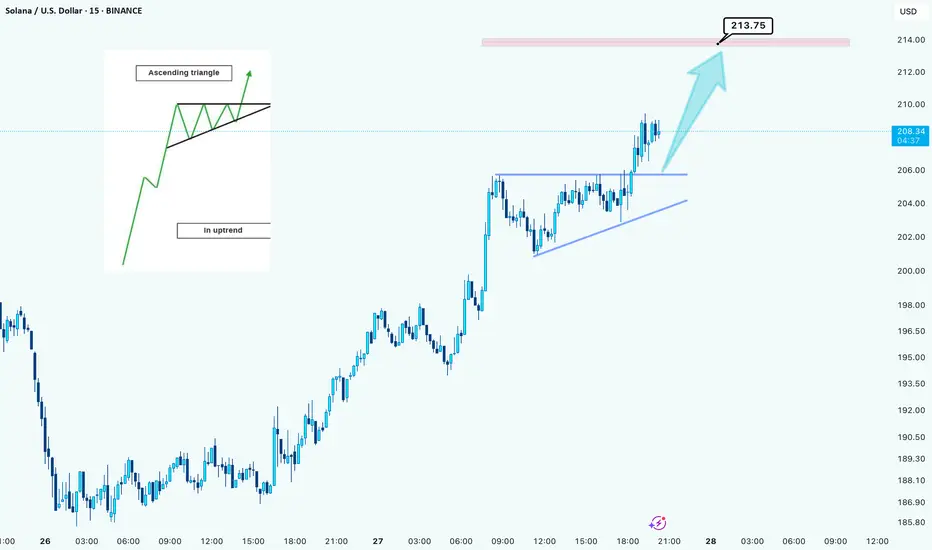
Solana Breaks into an Ascending Triangle – Bullish Continuation Hello guys!
The chart shows Solana (SOL/USDT, 15m timeframe) forming a classic ascending triangle pattern during an ongoing uptrend. The upper resistance level around $206 has been tested multiple times, while the rising trendline from the bottom confirms consistent buying pressure and higher lows.
This setup is a textbook bullish continuation signal, where buyers gradually squeeze sellers against a flat resistance until a breakout occurs. The breakout has already taken place, with SOL pushing above the resistance zone and heading toward the next key target around $213.75, which aligns with the projected move from the triangle’s height.
As long as price holds above the broken resistance (now support), momentum favors further upside. If bulls maintain control, we could see a continuation toward higher resistance zones. However, a drop back below the rising trendline would weaken the setup and signal caution.
most important levels:
Support (retest zone): $206
Immediate target: $213.75
Next potential resistance: above $214
Overall, the breakout from this ascending triangle suggests bullish momentum remains strong for Solana in the short term.
SOL - Time to buy again!The price has finally broken this bullish pattern and now is the time for the price to rise to $250.
PREVIOUS ANALYSIS
