$420 Solana Within 2 Months —TargetsSolana is on a path to a hit a price target of $420 mid-term, within 1-3 months. This is the continuation of the uptrend that started in early April with the end of the previous correction and a more than a year long strong low.
This is not for the faint of heart. Solana is preparing for something massive, even scary but positive. $600+ is also possible but we are going step by step and $420 is the first step.
Immediately when prices start to rise Solana is likely to find resistance around $220 and $253.
The last high, January 2025, would be the minimum on this bullish wave. This would be price tag of $296.
The end of the retrace happened 22-June. This means that the market is already bullish for an entire week. Bitcoin is about to produce the best possible weekly close. As Bitcoin is ultra-bullish above $106,000/$107,000, the altcoins can continue to recover and will aim higher trying to catch up. Of course, no altcoin can catch up to Bitcoin but invariably the entire market will grow.
The wait is over, we are bullish now. Timing is great.
Bullish momentum will grow for weeks and then a major force will permeate the market, something not seen in many years. I hope you are prepared.
Namaste.
Solusdt

SOLANA ABOUT TO EXPLODE?CRYPTOCAP:SOL just broke out and is surging within a long-term bullish channel
Price action is clean, momentum is strong, and if this channel holds — we might be eyeing $700+ in the next run.
This is not the time to ignore Solana.
Chart says it all.
DYOR. Stay sharp.

solana crazy ideaWell, I made this silly little chart for myself. I kind of expect it to follow the pattern of some bots running on Solana, at least within the range I’ve marked. But hey, it’s a bull market, and sometimes even random drawings by amateurs like me end up working out!
That said, I'm keeping my target modest — not expecting anything crazy. Stop loss depends on how Bitcoin behaves, and honestly, I wouldn’t recommend anyone follow what I’m doing. This is not investment advice, just a ridiculous idea I had.

sol updateentry price 169.14
stop loss update 169.14
take profit
160.1
145.1
131.5
result full target

SOL/USDT - Visible double top formationAfter hitting the projected reversal zone near 144–145, SOL/USDT has now formed a clean double top, reinforcing the bearish thesis initially outlined by the harmonic pattern. The second peak failed to break the macro descending trendline, and the price is now trading back below the 100% Fibonacci retracement of the XA leg.
This double top adds structural confirmation to the harmonic C-point rejection:
Volume remained lower on the second peak
RSI on the 30m chart printed a lower high while price matched previous highs — a textbook bearish divergence
PVT continues to flatten despite price volatility, suggesting a lack of bullish conviction
Price is now slipping below 143, and bearish momentum is building.

Most see rejection. I see a launchpadWhat looks like a failed breakout is actually SOL setting up for a higher timeframe reversal, right at a refined zone of inefficiency and Smart Money interest. The narrative isn’t over — it’s just beginning.
Technical Breakdown:
Current Price: ~$143.30
Context:
Price tagged the Fair Value Gap (FVG) on the daily and showed reaction — a sign of algorithmic awareness
Volume profile suggests thin liquidity above, ripe for expansion if momentum kicks in
Key Levels:
FVG (1D) zone: just under current price (~140.19)
Order Block (OB): ultimate demand zone near 137.23 — strong structural support
Downtrend Line: recently broken, retest in motion
Major Upside Target: 168.36 — a clean liquidity magnet
Strategic Thesis:
Price dipped into FVG but held above the OB — a classic Smart Money accumulation setup
The dashed projection shows potential higher lows forming, giving fuel for a push through prior highs
FVG + OB form the discount zone, where risk/reward is maximized before the next impulse move
Execution Plan:
Entry zone: $140.00–137.50
→ Expect small shakeouts before confirmation
Invalidation: Daily close below $136 kills the bullish case
Target:
Primary: $168.36
Stretch Goal: $172–176 if momentum is sustained into August

SOLUSDT | T.A.P.E. Method Breakdown: Has Solana Bottomed Or Not?Let’s walk through the T.A.P.E. Method I use to read every chart. This isn’t about price alone — it’s about structure, behavior, pressure, and clarity. Solana is at a critical decision point. I’ll explain what smart money is likely seeing, and how I’m approaching this chart with logic — not guesses.
T — Territory (Know the Zone Before You Clone)
I started with the Fibonacci retracement from the all-time low to all-time high. It’s clear SOL is reacting near the golden pocket zone — a historically strong area for reversals.
We also saw strong support at the 2618 extension after the first major leg down. This alone gave an 87% rally. That’s how clean setups work — clarity beats complexity.
Market structure remains bullish on higher timeframes. Yes, we’ve had a wick below prior lows, but no clean break — structure still holds for now.
A — Activity (Price Behavior Over Indicators)
I don’t use RSI or crossovers. I look at behavior.
From the local low to the swing high, the retracement again held the 618 zone, showing buyer defense.
However, on a second leg down, SOL broke below the 2618 level — a key difference. This shift in behavior is what I’m watching closely. Price pushed past 236 on the retrace — that can hint at a stronger bullish leg forming.
But...
P — Pressure (Pain Points and Traps)
Here’s where most traders get caught.
Early longs that entered during the last local rally are underwater. Especially those who bought around the value area high — they are likely hoping to exit break-even, adding sell pressure.
This is classic: a liquidity zone stacked with pain.
That pressure zone sits just above the current range, near $153–$164. If we get a strong move into that zone without structure, I’ll be watching for short setups — not breakouts.
E — Execution (No Setup Is Complete Without a Plan)
Here’s how I’m structuring it:
No-trade zone: Where we are now. No edge here.
Short area 1: $153 — trendline + resistance
Short area 2: $164 — invalidation just above
Target: Sweep lows + retest $138/$128
Invalidation: Clean breakout above $164 with structure
Support zones to watch:
$138 (value area low)
$128 (786 Fib)
$122 (old structure pivot)
If price forms structure and pushes through the golden pocket cleanly, then I shift bias. But for now — pressure remains to the downside.
Summary & Context:
This T.A.P.E. breakdown keeps me from chasing noise and protects capital. Too many early longs, weak structure, and clean resistance zones make this a potential short setup — not a long.
If price flips those resistance zones into support with structure, I’ll adapt. Until then: Plan the move. Let the market prove.
Disclaimer:
This is not financial advice. All opinions are my own, based on chart behavior and analysis. Do your own research. This is a paper money breakdown shared for educational purposes only.

Bearish Breakdown Alert: SOL Eyes $136.46 — Is $126.25 Next?The current SOLUSDT 4-hour chart reflects a strong bearish trend structure, supported by the price consistently respecting a descending channel. This channel has been intact for several weeks, and recent price action shows Solana approaching the upper boundary of this channel once again. Historically, this has acted as a sell zone, and unless there is a confirmed breakout, it remains a high-probability short setup.
Adding to the bearish sentiment is the Ichimoku Cloud. Price is currently trading beneath the cloud, and the cloud itself is shaded red and expanding, signaling ongoing bearish pressure. The Tenkan-sen (conversion line) has just crossed slightly above the price, but the Kijun-sen (base line) sits just above current levels, offering resistance. Most importantly, the Chikou Span (lagging line) is still below both the price and the cloud, which reinforces the idea that momentum remains on the downside.
Within this structure, a clean trade setup emerges:
• Entry: Around $143.87 (Kijun-sen + upper channel area)
• Stop Loss: $152.84 (above the cloud + upper trendline)
• Take Profit 1: $136.46 (mid-channel + local support)
• Take Profit 2: $126.25 (channel bottom)
Given the overall confluence of the bearish channel and Ichimoku resistance, any rejection from the $143–$144 area would support continuation toward the lower bounds of the trend. As always, watch for a strong bearish candle or wick rejection before entering to improve timing.


Solana looks scary. I don't like this rejection from the 1D 200MA.
Looking at the the weekly chart, it is very easy to see the similarity to 2022.
Maybe we should brace for impact?

Solana Breakdown Incoming? These Are Key Levels To WatchYello, Paradisers! Are you ready for the next major flush? After failing to gain momentum since the May double top breakdown, #SOL is now showing even more bearish signs, and the market might be about to punish late bulls one more time.
💎Following the confirmed double top in May, SOL has struggled to reclaim any upside momentum. Now, on the 12-hour chart, a classic head and shoulders formation is emerging, a pattern that often precedes larger trend reversals when the neckline breaks.
💎#SOLUSDT is hanging onto critical support between $142 and $140. This zone is the neckline, and it’s the last stand for bulls. If bears break it, we get a clear breakdown confirmation, with a clean path down toward $130–$127, which marks the first major demand area.
💎That initial support likely won’t hold for long. If pressure continues, SOL is expected to drop further toward the $115–$110 region. This is not just a technical support, it’s also the target area of the H&S formation, making it a magnet zone for price.
💎Adding to the bearish developments, a death cross has now been confirmed on the 12-hour chart. The EMA-50 has crossed below the EMA-200, reinforcing short-term downside pressure. Even if a relief bounce occurs, the $155 region, where the EMA-50 sits, will likely act as fresh resistance and attract renewed selling.
Paradisers, strive for consistency, not quick profits. Treat the market as a businessman, not as a gambler.
MyCryptoParadise
iFeel the success🌴

Solana Bearish Divergence, 20% Drop Incoming?Hey Realistic Traders!
Bearish Signal Flashing on BINANCE:SOLUSDT , What Signals Are Showing?
Let’s Break It Down..
On the daily timeframe, Solana has formed a double top pattern, followed by a neckline breakout, which is a classic sign of a potential shift from a bullish to a bearish trend.
This breakout was confirmed by a break of the bullish trendline, accompanied by rising selling volume, which reinforces the bearish momentum. Adding to this, a bearish divergence has appeared on the stochastic oscillator. Bearish divergence occurs when price makes higher highs while the oscillator forms lower highs, signaling weakening buying pressure and increasing the likelihood of a reversal.
Given these technical signals, the price is likely to continue moving lower toward the first target at 134.13, with a possible extension to the second target at 114.96.
This bearish outlook remains valid as long as the price stays below the key stop-loss level at 180.26.
Support the channel by engaging with the content, using the rocket button, and sharing your opinions in the comments below.
Disclaimer: "Please note that this analysis is solely for educational purposes and should not be considered a recommendation to take a long or short position on Solana.

SOLUSDT Bearish continuationSolana is still going to push down deeper... The structure keeps forming lower lows and lower highs with a volume that remains high on the sellers side.
My target is 139.00
SL : 150.20

Sol at Risk: Key Support Break Could Trigger Drop to $97Sol is on the verge of breaking a critical support level. If this level fails, we could see a drop towards the $130–$125 range.
However, based on the full pattern length, Sol has the potential to fall as low as $97 — aligning with a possible double bottom formation.

SOL – Sweep & Spring Play at Local DemandWe’ve got a clean rounded top → breakdown → demand sweep setup.
Current price action suggests a potential reversal is brewing.
🔍 What’s happening on this chart?
Rounded top marks a local distribution — aggressive short entries
Price broke lower, swept the demand zone (gray box), and now shows rejection wick + bullish reaction
Fibonacci levels mapped out the structure
0.5 = 154.51
0.618 = 157.76 = key resistance liquidity zone
🎯 Trade idea:
Entry: inside demand zone (OB marked on chart)
Target 1: 151.25
Target 2: 157.76 (0.618)
Full fill: 162.40 – 168.30 (complete inefficiency sweep)
🧠 Mindset:
This setup is classic spring + reclaim. If price consolidates and flips 147.2, upside becomes favorable.
If you like clean trade setups with logic and clear invalidation, check the account bio for more updates and live breakdowns.

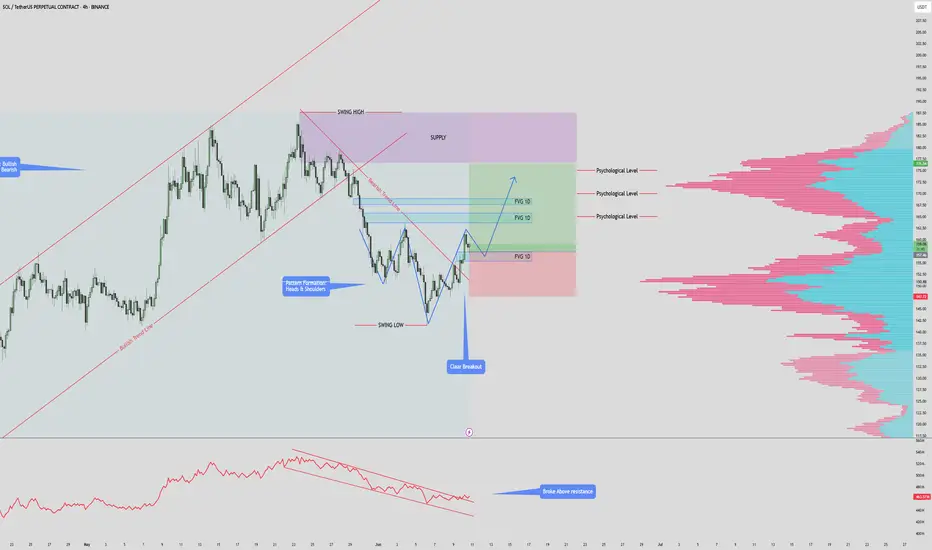
$SOLANA $180 PUMP INCOMINSOL/USDT – 4H Chart Summary
Market Structure:
HTF: Bullish trend remains intact.
LTF: Previously bearish, now showing early signs of a bullish reversal.
Pattern Formation:
Potential Inverse Head & Shoulders forming.
Neckline at $157 — must hold for pattern to complete.
Break above previous high will invalidate Inverse Head & Shoulders.
Trendline & Breakout:
Price has broken above the descending bearish trendline.
Indicates a momentum shift from bearish to bullish.
Fair Value Gaps (FVG):
1D FVG below current price – potential retest & long entry zone.
2x 1D FVG above price – act as targets or supply areas.
Psychological Levels & Volume:
Key levels at $165, $170, $175.
Volume profile shows high liquidity at each of these levels – strong TP zones.
OBV Indicator:
OBV has broken above resistance – supports bullish continuation.
Trade Scenarios:
Bullish Setup:
Long on retest of lower FVG zone ($142–$145).
Target TPs: $165 → $170 → $175 (align with psychological & high-volume areas).
Invalidation:
Break below FVG support or failure to hold above $142.
Short on SOL Here is a short idea on SOLUSDT perpetual contract on Binance.
I also include my overall analysis. I hope you find this useful.
Thank you!
- R2F Trading

How Bitcoin can impact alt coins like sol and sui This video is a very quick update on the potential for bitcoin to drop into the 96/97k region and the effect it will have on alt coins .
If you hold altcoins and you see them bleed in price then its important to know and understand whats ahead for Bitcoin .
Understanding this will help you with your entry's and your exits on all altcoins .

#SOL/USDT#SOL
The price is moving within a descending channel on the 1-hour frame, adhering well to it, and is heading for a strong breakout and retest.
We are experiencing a rebound from the lower boundary of the descending channel. This support is at 149.
We are experiencing a downtrend on the RSI indicator, which is about to break and retest, supporting the upward trend.
We are heading for stability above the 100 moving average.
Entry price: 153
First target: 155
Second target: 159
Third target: 162

Impulse without purpose? Not in Smart Money termsSOL didn’t just break structure — it filled inefficiency and positioned above. Now price is sitting in the upper FVG, where decisions are made — not guesses.
What just happened:
Price rallied from the OB below and left an IFVG in its wake
Current price is hovering at the edge of a higher FVG, right where liquidity rests from trapped shorts
The move is complete — now it’s about what price does next in this zone of intent
From here, two paths:
Sweep into FVG, reject, and rotate back down toward the 154–147.4 range
React bullishly from mid-FVG, reclaim structure → break to new internal high and keep running
The OB down at 145 is still valid if price unwinds — that’s where Smart Money bids.
Execution view:
Rejection from 158–159 = short bias down to 147–145
Clean invalidation above FVG high
If price consolidates at 154 and reclaims → setup flips bullish
The setup isn’t about what price did — it’s about what it’s preparing for.
You want more trades like this — precision zones, mapped logic — check the profile description.

#SOL/USDT#SOL
The price is moving within a descending channel on the 1-hour frame, adhering well to it, and is heading for a strong breakout and retest.
We are experiencing a rebound from the lower boundary of the descending channel. This support is at 142.
We are experiencing a downtrend on the RSI indicator, which is about to break and retest, supporting the upward trend.
We are heading for stability above the 100 moving average.
Entry price: 144
First target: 149
Second target: 153
Third target: 157

SOLUSDT Forming Bullish FlagSOLUSDT is currently forming a classic bullish flag pattern on the chart, which is often seen as a continuation pattern indicating the potential for a strong breakout to the upside. The price has consolidated within a tight range following a significant upward move, creating a flag-shaped formation that typically precedes the next wave higher. This structure is being supported by solid volume behavior, which is an essential confirmation for bullish breakouts. Based on historical performance and technical projections, a 50% to 60% gain could be on the horizon if this pattern resolves upward.
Solana (SOL) has remained one of the strongest-performing layer-1 blockchain projects in the market, and current investor sentiment is highly favorable. With recent developments in its ecosystem and increased institutional interest, SOL continues to attract substantial inflows. The bullish flag pattern aligns perfectly with the broader market optimism and technical indicators such as RSI and MACD that are showing early signs of renewed momentum.
Traders should watch closely for a breakout above the flag's resistance line, as this could trigger a new wave of buying pressure. Key levels to monitor include the breakout point and potential price targets around the previous highs and Fibonacci extensions. The market structure remains bullish, and if confirmed by volume and market momentum, SOLUSDT may offer one of the most attractive risk-reward setups in the current crypto landscape.
In summary, SOLUSDT is technically poised for another rally, supported by a bullish flag and growing interest from both retail and institutional investors. With a favorable risk profile and strong fundamentals, this is a setup that many traders will be watching in the coming days.
✅ Show your support by hitting the like button and
✅ Leaving a comment below! (What is You opinion about this Coin)
Your feedback and engagement keep me inspired to share more insightful market analysis with you!

SOLUSDT | The Final Liquidity Hunt | $250 is the Next StopSOLUSDT is currently in an uptrend after recently breaking out of its extended downtrend to $95 which took out millions of long positions. Now, we are seeing yet another extended downtrend on the lower time frame, but the overall direction is still up.
Last week, price action printed two very bullish pinbars at the $155 level which could have been considered support, where price was consolidating around late April. High leverage traders entered here and eventually got liquidated last Friday.
Following the liquidity hunt, price reversed quickly, but not strong enough to reclaim the $155 zone. Many of those who were liquidated likely re-entered on this fast move, thinking that the liquidity hunt is over and price cannot move lower.
I am anticipating one FINAL move down to $140 before the uptrend resumes. This will be the move that takes out the dumb money and where smart money will take their positions. The alternative is that the liquidity hunt never happens, and price breaks out of the falling wedge to resume its uptrend.
What about macro and micro factors?
⚖️ Ripple vs SEC Case
On 8th May, both parties agreed to settle, which ignited a massive market-wide rally. Unfortunately, their filings were rejected due to a procedural issue. The next deadline for refiling is on 16th June. Once accepted, we can expect another massive rally.
🤝 US-China Trade Talks
This week, US and China will meet at the negotiation table again. On 12th May, US & China reached a deal in Geneva and sent markets on another rally. IF (big if) they come to another deal this time, we can expect another rally.
✂️ Fed Rate Cut Expectations
The Fed talked about cutting interest rates in late 2025. They are currently in a "wait and see" stance however, due to uncertainties. Eventually we will see a rate cut, and I believe this would be a "buy the rumor, sell the news" event. Markets will price in the anticipated rate cut before it happens later this year.
Our first price target is $250.
