Solana’s pause after the causeHi friends!
How are you doing after the recent Bitcoin–Solana drop?
I hope you didn’t lose anything — and maybe even managed to make some profit instead! 💪
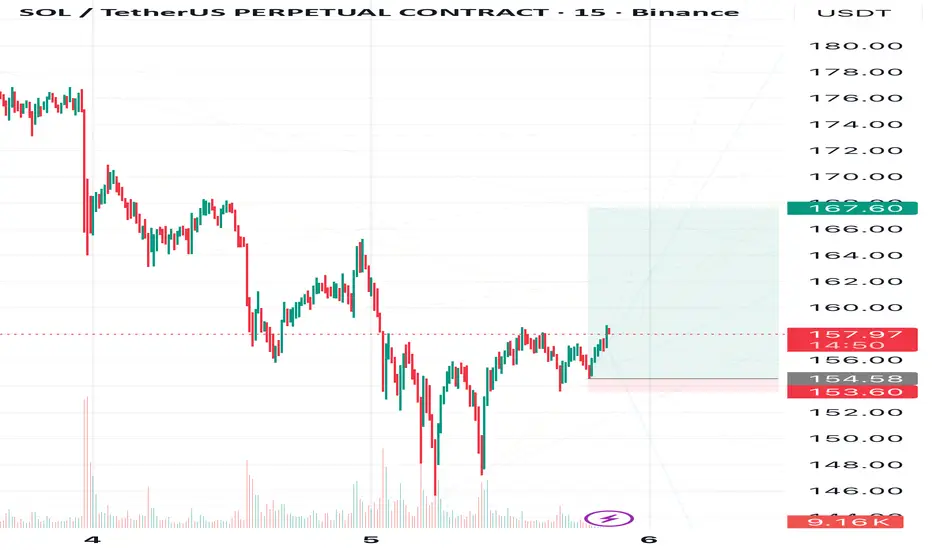
📉 My next targets on the downside are around $144 and $124, but at the moment, Solana seems to be taking a breather from the fall.
After a long and deep decline, even below my earlier expectations, Solana is finally showing some signs of a small correction to 167,60 📈
🎯Target - 167,60
❌Invalidation zone are marked on the chart - 153,60
💬 What do you think — is this the start of a reversal, or just a short pause before another move down? Share your thoughts in the comments. I always enjoy reading your views!
🔔 Follow me to stay updated on Solana and other crypto market analyses.
Solusdt
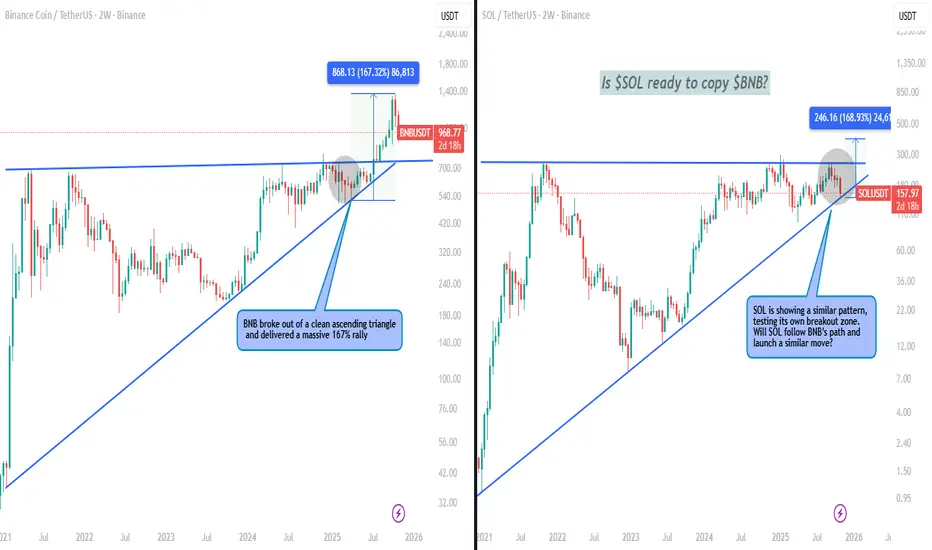
$SOL vs $BNB – History repeating?CRYPTOCAP:BNB broke out of a clean ascending triangle and delivered a massive 167% rally. Right now, CRYPTOCAP:SOL is showing a similar pattern, testing its own breakout zone.
Will SOL follow BNB’s path and launch a similar move? A structure like this could set the stage for a big run if support holds. Share your views—is CRYPTOCAP:SOL ready for its breakout moment?
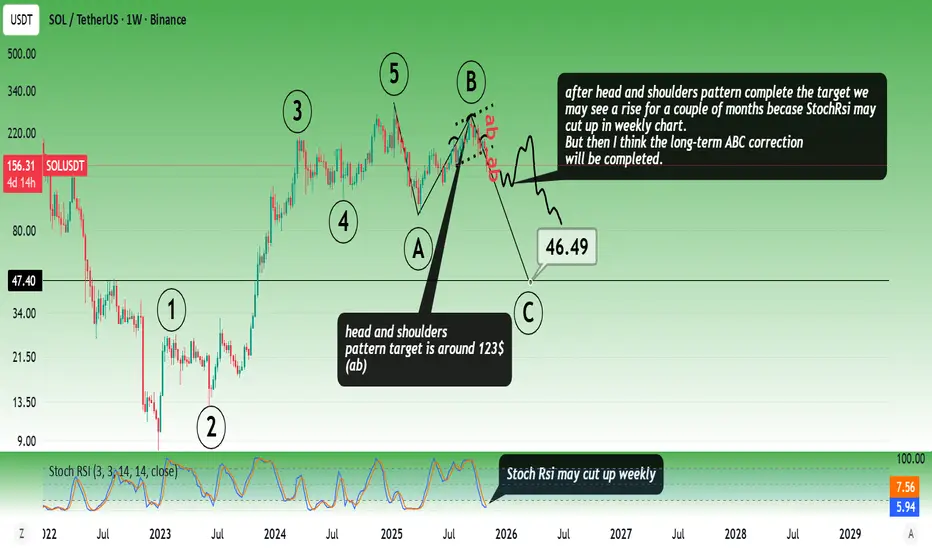
Solana RoadmapAfter the head and shoulders pattern complete the target we
may see a rise for a couple of months becase StochRsi may cut up in weekly chart.
But then I think the long-term ABC correction will be completed.
* The purpose of my graphic drawings is purely educational.
* What i write here is not an investment advice. Please do your own research before investing in any asset.
* Never take my personal opinions as investment advice, you may lose your money.
Solana, more down side to see? SOLUSDT / 1D
Hello Traders, welcome back to another market breakdown.
SOLANA is currently trading within a down trend, maintaining a bearish structure. I'll be looking for a short pull-back higher to get a position.
If the pullback holds and sell mode confirms, the next leg higher could target new lows.
Stay disciplined, wait for the market to come to you, and trade with confidence!
Trade safely,
Trader Leo.

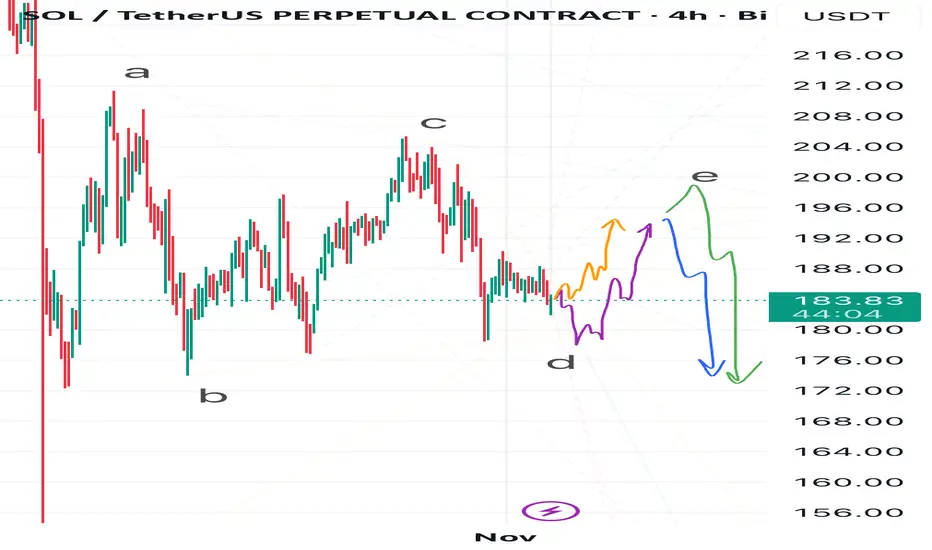
Solana Swing — D or E in the Ring?I see several possible scenarios for Solana at the moment.
In my view, either wave D of the corrective ABCDE triangle has already formed, and the price will follow the orange path, starting to build wave E —
or wave D isn’t complete yet, and Solana might still drop toward 178 or even lower, following the purple path, before beginning wave E.
As for wave E, I also see two possible outcomes:
• The green path, where wave E extends up to around 200,
• Or the blue path, where wave E ends near 194–196, followed by a downside breakout from the triangle, sending Solana toward ~170 or even lower.
💬 Which scenario do you find more likely? Share your thoughts in the comments!
#SOL/USDT The Next Explosion, Hidden Clues in Price Behavior
#SOL
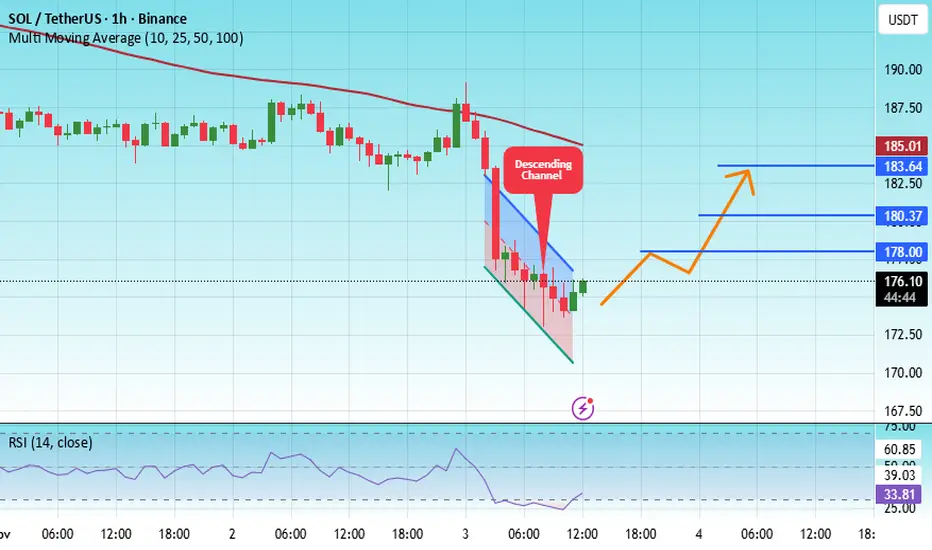
The price is moving within an ascending channel on the 1-hour timeframe and is adhering to it well. It is poised to break out strongly and retest the channel.
We have a downtrend line on the RSI indicator that is about to break and retest, which supports the upward move.
There is a key support zone in green at 172.80, representing a strong support point.
We have a trend to stabilize above the 100-period moving average.
Entry price: 175.50
First target: 178
Second target: 180
Third target: 183
Don't forget a simple money management rule:
Place your stop-loss order below the support zone in green.
Once the first target is reached, save some money and then change your stop-loss order to an entry order.
For any questions, please leave a comment.
Thank you.
Solana — Triangle Tale Before the Pale As you might remember from my previous publications, I’m expecting Solana to decline toward 164 and possibly even lower.
At the moment, I’d like to see it around 178, and depending on how the move toward this level develops, I’ll decide on my next steps — which you’ll see in my upcoming updates.
I have a thought that after reaching 178, Solana might move upward first, forming a corrective triangle, and only later drop to 164 or even below.
The invalidation zone for the current plan is marked in red on the chart.
📉 Follow me so you don’t miss my next analyses and scenario updates

SOLANA Pullback - DailyThis crypto coin has been bearish on the past few days, but it seems as it is a slight pullback towards the demand zone at 160 and 130, before it shoots upwards.
Let us wait and see if we can have a selling opportunities, aiming towards those zones.

SOL/USDT Update — Bullish Trend Structure and Resistance Ahead“🚨 Solana vs Tether: Bullish Heist on SOL/USDT 💰”
📊 Description
Market: SOL/USDT
Bias: Bullish (Swing / Day Trade)
✅ Trade Plan
Entry: 🎯 Any good support / demand area — stay alert & flexible.
Stop Loss: 🛡️ “Thief SL” @ 160.00 USDT — this is my SL, not yours. Manage your own risk!
Targets (TP):
• 🎯 Target 1: 215.00 USDT
• 🏁 Target 2: 240.00 USDT
⚠️ Heads up: Use your discretion. Do not blindly follow my SL/TP — trade responsibly, at your own risk.
🔍 Key Insights / Logic
🚧 Expect resistance & traps near 215–240 — don’t get stuck in overbought zones.
📈 Momentum is building; structure is favorable on retests.
🔊 Watch volume on impulsive moves — rising volume = strength.
🔄 Related pairs / correlation watch:
• BINANCE:SOLBTC — strength vs BTC strengthens the bullish case.
• BINANCE:ETHUSDT — altcoin momentum may carry SOL upward.
• BINANCE:BNBUSDT — BNB strength can support ecosystem flow.
✨ “If you find value in my analysis, a 👍 and 🚀 boost is much appreciated — it helps me share more setups with the community!”
#SOL #SOLUSDT #Solana #CryptoSwing #CryptoDayTrade #AltcoinAnalysis #TradingViewIdeas #CryptoFun

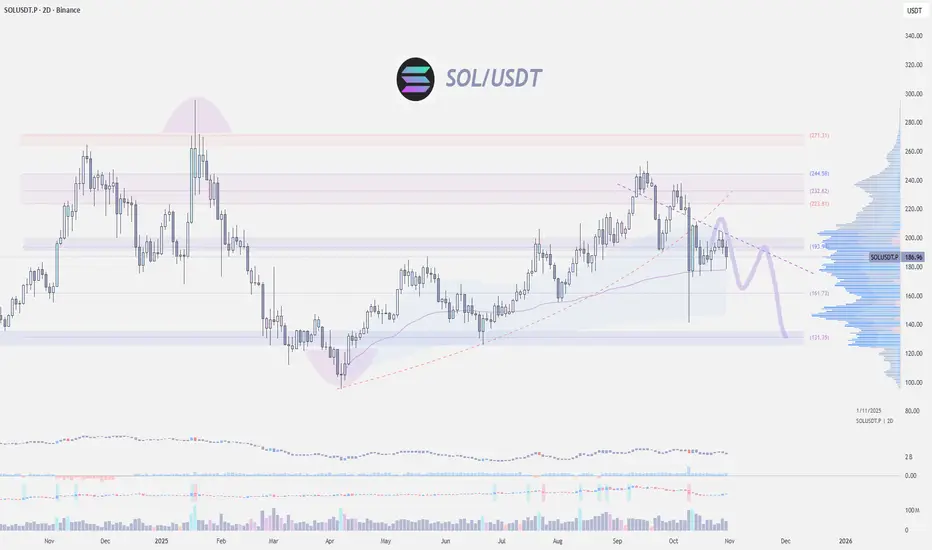
Solana Price Action Turns BearishSolana’s market structure shows a gradual weakening of bullish momentum after an extended upward phase earlier in the month. The asset experienced a breakout that temporarily fueled optimism among traders, but recent sessions indicate a loss of strength as sellers began to dominate. The volume profile suggests that market participants are shifting focus from accumulation to potential distribution, reflecting caution ahead of broader market developments.
Price movements over the past few weeks show that Solana has transitioned from impulsive bullish waves into a corrective environment. This phase reflects uncertainty and potential repositioning by large holders. The consolidation seen mid-cycle indicates a period of balance before a directional move resumes. Current activity implies that short-term liquidity adjustments are occurring, and volatility may expand in the coming sessions.
Market sentiment remains sensitive, with investor confidence depending largely on macroeconomic flows and digital asset liquidity trends. Solana’s performance continues to mirror broader crypto risk appetite, where speculative behavior is being tempered by cautious profit-taking. If momentum continues to decline, extended corrective movement could unfold as participants await new catalysts.
Overall, the report indicates that Solana is entering a controlled phase of distribution where institutional participants may be preparing for another medium-term adjustment in valuation.

SOL/USDT: Bearish Channel Holds as Price Faces Mid-Range ResistSOL/USDT is consolidating inside a downward channel, with a clear sequence of lower highs and impulse legs defining the structure. Price is currently hovering near mid-range resistance, showing hesitation below the descending trendline.
A rejection at this level could lead to a move back toward the $169 support, completing the projected downside leg. The broader tone remains bearish while channel boundaries continue to guide and limit momentum.

Solana at a Make-or-Break LevelSolana couldn’t sustain momentum above $200 and now holding the critical level $170.
CRYPTOCAP:SOL is sitting at a make-or-break level — failure to reclaim the $200 zone or a clean break below $170 would be a concerning signal for bulls.
A decisive breakdown below this area could trigger a deeper retracement toward $150, with the worst-case scenario being a full retest of the $130 range — aligning with the previous demand zone and high-volume node.
PENGUUSDT : BUY LIMITHello friends
Given the good growth we had and the entry of buyers, now that the price is correcting, there is a good opportunity to buy with risk and capital management and in steps at the specified supports and move with it to the specified targets.
*Trade safely with us*

$SOL Solana is sandwiched between the nearly 4-year resistance level of 2021's ATH and the approaching 3-year uptrend.
A squeeze lasting this long typically ends not with a minor breakout but with a major blowout.

Solana is still within range... SOL just got some bullish news with a Western Union relationship. Could this be a catalyst that will allow the PA to exit the range? The current upward channel has been respected on the D1, although the trend has been our friend; trendline liquidity has been building. Regardless, the SOL price is at an important POI.

SOLUSDTI think have this chart of BINANCE:SOLUSDT buy because breakout trendline and i see order-block in 194$. Target is end measured move (2-Leg) from low latest swing in 208$.
Please control your risk in any position.

SOLUSDT – Bullish Trend Supported by Technical Structure and NewAfter a brief correction, SOLUSDT is showing strong signs of a continued upward movement. The ascending triangle pattern on the H4 chart indicates that SOL is building a solid base, with higher lows and testing the resistance at 200.00 USD. The price is currently above the EMA34, signaling strong buying momentum.
Notably, the price has recently broken through the important 200.00 USD resistance and is now approaching 216.00 USD. If SOL continues to hold above the 200 USD mark and confirms further upward movement, the next target would be 216 USD.
With positive news surrounding Solana and increased investment interest, SOL is likely to maintain its bullish momentum in the short term.
Strategy: Buy around 200.00 USD, target 216.00 USD, stop loss below 195.00 USD.
Summary: The short-term bullish trend remains strong, and SOLUSDT may reach the 216 USD target if it holds above the 200 USD support level.

Solana Still ChillsSolana continues its correction phase. I am expecting a move toward 190 now
The invalidation zone for this scenario is marked on the chart

SOLANA - SHORT - THE WICK AND THE WHISPERTraders,
This is how I see SOL.
1. The level I care about
For me the key area is 205 to 207. Call it VAH, call it range high, call it supply. It is the place where price got stuffed before and where a lot of trapped memory lives.
What I expect is simple.
Wick it. Slip it. Fade it.
In other words I am looking for SOL to run into that 205 to 207 pocket, spike through it, clean the liquidity resting above those highs, and then fail to hold. That failure after the wick is the trigger for me. That is where I want to be heavy.
If SOL trades above that range high and then instantly falls back inside, that is a swing fail pattern at the high of the range. That is the same story I am hunting on BTC at 117.5k. Liquidity first, conviction second.
2. The downside path
If the wick and slip happens, my downside path is not small. My next meaningful target sits all the way down at 150 to 155. That zone is not just a guess.
It is where the last real demand block sat before we impulsed higher.
It is also where liquidity was never fully re balanced after the violent breakout.
Call it unfinished business. Call it imbalance that still needs to close.
The market eventually comes back to drink from the well it skipped.
3. Now we look under the hood
Price has pushed up into 200 again, yes. But the flow behind the move tells a different story than the candles.
Spot CVD
Spot CVD is bleeding down hard. Real buyers paying cash are not supporting this move. Spot is distributing into strength, not accumulating under it.
Stablecoin margined CVD
Stablecoin perp flow is also down. That means most of the USDT perp side is either taking profit into this move or outright selling into it. They are not chasing it. They are leaning against it.
Coin margined CVD
This is the biggest one. Coin margined CVD is aggressively down. That tells me coin collateral traders are smashing into the bid, basically leaning short into this push.
So ask yourself. If spot is selling, and perp flow is selling, and coin margined flow is selling, then why is SOL still pressing up
4. Open Interest is the answer
Stablecoin OI is grinding up.
Coin margined OI is going vertical.
That means positions are being added at the top, not closed. New size is entering into this level.
When coin margined OI spikes like that while coin margined CVD is negative, the usual read is this. People are opening fresh short exposure using SOL itself as collateral, hitting the bid all the way up, and still not getting the breakdown.
They are trying to fade the move. The move refuses to die. That is short fuel.
This is why SOL can still squeeze into 205 to 207. Shorts are stepping in early, and if you squeeze them one more time you get the wick.
But here is the catch. After the wick and slip, once that last round of shorts is blown and once fresh late longs FOMO in above VAH, there is nothing under price.
Spot buyers did not build a floor.
Perps did not build a floor.
The whole thing is hollow.
That is how you get air pockets.
5. How I am trading this
I am not here to wave a bull flag or scream bear. I am not interested in labels.
I am here to execute around the level.
My plan is to stalk shorts on a failed breakout of that 205 to 207 key. I do not need to nail the exact top tick. I want to see the wick into VAH, and then the rejection back inside the range. That is my trigger to build size.
Will I hold it all the way to 150 No blind loyalty. But that is where I believe the next true re balance sits, and that is the map I am working with.
If SOL breaks through 207, accepts above, and starts building structure above VAH, then this idea is invalid. I step aside. No ego. Survival first.
6. Summary
SOL is approaching a thin ceiling where liquidity sits. I believe we get a final run of that high near 205 to 207, a wick and slip, and then rotation lower. The flow supports that view.
Spot is not bidding.
Perps are selling into the move.
Open Interest is exploding at the highs.
That is the recipe for a squeeze candle into resistance, followed by a rug.
My destination if this plays out is 150 to 155, the next pool of imbalance where the market still owes a visit.
The chart is loud, but the flow is louder.
The candles brag.
The data whispers.
I listen to the whisper.

The Next Explosion, Hidden Clues in Price BehaviorCan you really feel the next Bitcoin explosion just by reading the charts?
The market looks calm, but deep down something big is shifting.
When everyone expects a crash, history shows that’s when the biggest moves begin.
Hello✌️
Spend 2 minutes ⏰ reading this educational material.
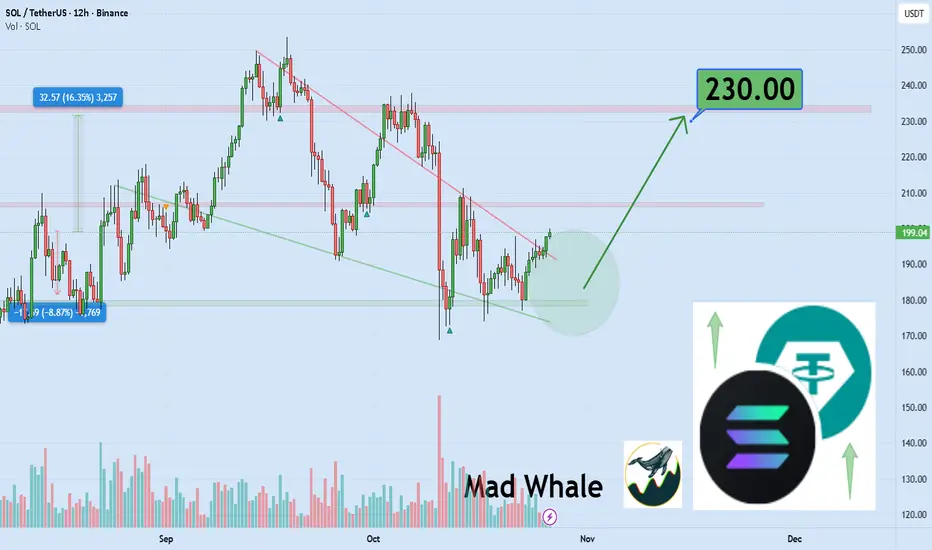
🎯 Analytical Insight on Solana:
BINANCE:SOLUSDT is testing a key daily support; holding this zone could spark a 16% rally, targeting $230. 📈🛡️
Now , let's dive into the educational section,
🌋 The Calm Before the Storm
The crypto market is like the ocean before a tsunami quiet but full of hidden energy. On higher timeframes, candles look small and boring, yet trading volume is rising. That mix of silence on the surface and pressure underneath is exactly what happens before every strong bull run.
💡 Hidden Clues in Price Behavior
Bitcoin’s price has been building quiet support for weeks, while big transactions are slowly increasing in the background. This usually means that smart investors are buying without drawing attention. Rising volume with little price movement is often the first signal that accumulation has started.
🚀 Bitcoin The Engine of the Next Explosion
In every cycle, Bitcoin moves first. Breaking major resistance levels and holding above them is a sign of growing confidence. When Bitcoin dominance starts to drop and altcoin volume goes up at the same time, that’s when the whole crypto market gets ready for a collective takeoff.
🧠 Trader Psychology During Market Silence
Most traders fear a quiet market, but experienced ones see it as the best setup. When the media talks about stagnation and panic, the big players are quietly building long positions. The difference between average and professional traders is simple: one sees silence as danger, the other as opportunity.
🔍 The Path to Spotting the Next Big Move
To catch the move early, start with volume. When volume rises at support levels without breaking previous lows, it usually means smart money is buying. A positive divergence between price and RSI often appears right before momentum flips. Then watch for a bullish MACD cross on the daily chart when all three signals align, the explosion is close.
⚙️ TradingView Tools That Reveal Market Explosions
TradingView offers powerful tools that can help you detect big moves before they happen.
1. Volume Profile
Shows where most buying and selling happened. Heavy zones are usually where whales make their decisions.
2. MACD
Reveals when market momentum is changing direction. A bullish cross in the negative zone often signals the start of a reversal.
3. RSI
Measures the strength of buyers versus sellers. When RSI breaks above 50, a new bullish phase is often beginning.
4. Alert System
Highly underrated! Set alerts for your favorite indicators so when they align, you get notified instantly.
5. Multi-Timeframe Analysis
Use multiple timeframes to avoid fake signals. Comparing daily and 4-hour charts gives a much clearer picture of big moves.
⚡ Summary
All signs point to a massive move ahead. Bitcoin’s calmness is deceiving, but the data doesn’t lie. Stay patient, follow your signals, and you might witness one of the strongest uptrends in years.
🧭Golden Tips for Smart Traders
Patience beats excitement. The biggest profits go to those who wait for confirmation, not those who rush in
Ignore the crowd’s emotions. When the mood is darkest, opportunities are often the brightest.
Trust the chart, not your fear. The market always tells the truth if you take the time to listen.
✨ Need a little love!
We pour love into every post your support keeps us inspired! 💛 Don’t be shy, we’d love to hear from you on comments. Big thanks, Mad Whale 🐋
📜Please make sure to do your own research before investing, and review the disclaimer provided at the end of each post.
Is Solana Ready for a Technical Breakout or Just a Fake Pump?🎯 SOL/USDT Wealth Strategy Map | The Gentleman Thief's Playbook 💎
📊 Market Overview
Asset: SOLANA/USDT (SOL/USDT)
Trading Style: Swing/Day Trade Hybrid
Market Sentiment: Bullish Pending Breakout Setup 🚀
🎭 The Setup (As Told by a Professional Thief)
Dear Ladies & Gentlemen, gather 'round for today's calculated heist...
🔓 The Entry Plan
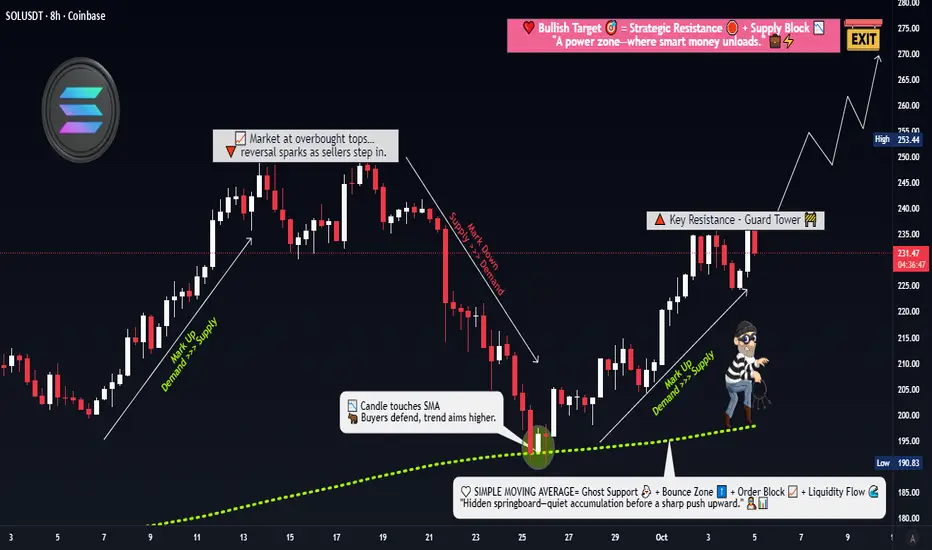
Breakout Zone: $240
Entry Strategy: ANY price level AFTER confirmed breakout above $240
💡 Why this matters: We're watching for resistance to crack like a vault door. Once $240 breaks with volume, the path to riches opens.
🛡️ Risk Management (The Thief's Insurance Policy)
Stop Loss: $220
⚠️ Important Notice: This is my thief-style SL, but YOU are the master of your own vault. Set your risk tolerance based on YOUR capital and comfort level. Make money, take money — at your own calculated risk.
🎯 Profit Targets (Where We Cash Out)
Primary Target: $270 (Our recommended exit)
Technical Target: $280 (Strong resistance + overbought territory + potential trap zone)
📌 Strategic Exit Reasoning:
$270 offers a clean 12.5% gain from breakout
$280 presents multiple bearish factors: strong resistance, overbought conditions, and classic bull trap setup
Smart thieves escape with profits before the alarm sounds 🚨
⚠️ Important Notice: This is my thief-style TP, but only YOU can decide when to take profits. Your money, your rules, your risk.
🔍 Technical Analysis Deep Dive
Key Levels to Watch:
Resistance: $240 (current), $270 (target), $280 (danger zone)
Support: $220 (our safety net)
The Correlation Play 📈
Related Pairs to Monitor:
CRYPTOCAP:BTC (Bitcoin) - The market's king affects all. If BTC pumps, SOL typically follows with 1.5x volatility
CRYPTOCAP:ETH (Ethereum) - Direct competitor in smart contracts; inverse correlation on capital rotation
CRYPTOCAP:AVAX (Avalanche) - Similar L1 narrative; watch for sector rotation signals
SEED_DONKEYDAN_MARKET_CAP:MATIC (Polygon) - L2 competitor; check for broader altcoin momentum
💡 Correlation Strategy: If BTC holds above $65K while ETH consolidates, SOL historically outperforms due to capital flow seeking higher beta plays.
⚡ The Gentleman Thief's Trading Philosophy
This isn't gambling — it's calculated robbery from the market's inefficiencies. We enter with precision, manage risk like professionals, and exit before greed becomes our enemy.
Remember:
✅ Breakouts need volume confirmation
✅ Risk management is non-negotiable
✅ Profits aren't real until you take them
✅ The market doesn't care about your feelin
📢 Community Engagement
✨ "If you find value in my analysis, a 👍 and 🚀 boost is much appreciated — it helps me share more setups with the community!"
⚖️ Legal Disclaimer
IMPORTANT: This is a "thief-style" trading strategy shared purely for educational and entertainment purposes. This is NOT financial advice. Trading cryptocurrencies involves substantial risk of loss. Past performance does not guarantee future results.
You are solely responsible for your own trading decisions. Always:
Do your own research (DYOR)
Never invest more than you can afford to lose
Understand the risks before trading
Consider your personal financial situation
The author is not a registered financial advisor and assumes no liability for your trading outcomes.
Trade safe, steal smart, exit elegant. 🎩💰
#SOLUSDT #Solana #CryptoTrading #SwingTrading #DayTrading #TradingStrategy #Breakout #TechnicalAnalysis #CryptoSignals #AltcoinSeason #SOL #USDT #CryptoAnalysis #TradingView #PriceAction #CryptoChart #BullishSetup
SOLUSDT.P - October 26, 2025Based on the 4-hour chart, the price appears to be consolidating within a triangle after a sharp decline. A long bias is supported by the potential for a breakout above the upper trendline.

SOL at Support, History Could Repeat$SOL/USDT Analysis
SOL continues to respect its long-term rising support line beautifully. Each time it has accumulated around this trendline, we’ve seen a strong rally follow, and the same pattern seems to be forming again.
Right now, SOL is in another accumulation phase, holding well above the key support zone. If history repeats itself and the price sustains this level, we could see another explosive move toward new highs.
DYOR, NFA
Thanks for reading! Appreciate your support and engagement 🙏
