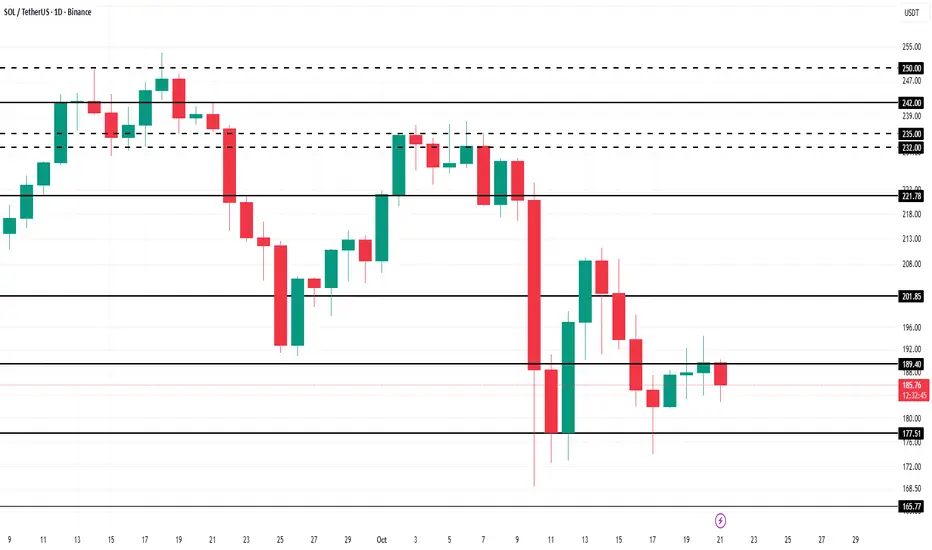
Solana Price May Have A Shot At $250, But Caution AdvisedAt the time of writing, Solana’s price stands at $184, holding above the crucial $183 support. The altcoin appears to be forming a flag pattern, a technical setup often associated with bullish breakouts. However, confirmation will depend on volume strength and investor conviction.
Following the recent crash, SOL briefly dropped out of this pattern before testing and validating it again. For a clear breakout, Solana needs to bounce off the lower trendline or move past $192. Failure to sustain buying pressure could drive the token below $175, potentially falling to $163, invalidating the bullish pattern.
Conversely, if Solana breaches $192, it could surpass $200, a key psychological barrier. Breaking out from the pattern could ignite renewed momentum, setting the stage for a potential surge toward $250. Nevertheless, investors and traders should proceed with caution given the current market fragility.
Solusdt
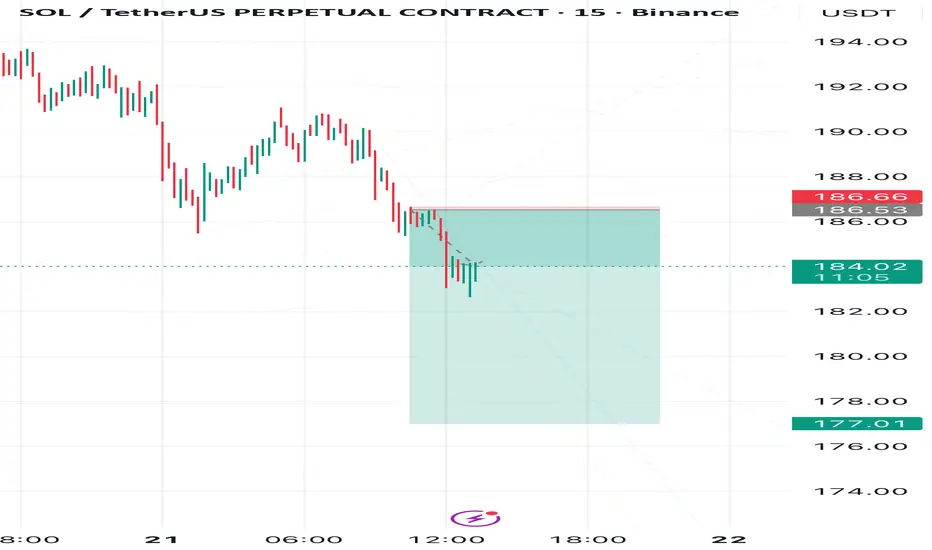
Solana Drop DramaSolana has started its decline as expected. I am now targeting a drop to 177
On the chart, I marked the plan cancellation zone—if price breaks this area, the scenario becomes invalid.
SOLUSDT – Short-Term Bearish BiasHello traders,
In my view, SOLUSDT is likely to lean toward a slightly bearish trend in the coming sessions. The preferred strategy is to sell the rally when price approaches the confluence zone around 196–199. Currently, Solana is testing the descending trendline that has been in place since early October — a level that has previously formed multiple tops and faced strong rejections.
News Overview:
The recent listing of the Solana ETF in Hong Kong is a positive sign for the medium term. However, the broader crypto market remains under pressure due to uncertainty in the United States , as ETF approvals are delayed by the government shutdown and the unclear regulatory stance from the SEC. This has limited short-term speculative capital and created a cautious sentiment across the market.
In addition, rumors claiming that a Solana ETF was approved in the U.S . have been refuted by Reuters and Bloomberg, indicating that the market may have overreacted to unverified information. This kind of overhype often leads to short-term corrections following technical rebounds.
Technical Analysis:
On the 4H timeframe, SOL is clearly moving within a downtrend structure, forming a series of lower highs and lower lows.
The 196–199 zone aligns with the descending trendline, the EMA89, and a key dynamic resistance level.
Price is showing weak reaction in this area, suggesting that buying momentum is fading.
If a rejection candle pattern or SFP (swing failure pattern) appears near 197, it could be a good opportunity to enter short positions.
The near-term target lies around 182–175, a strong support zone where price previously bounced. If 175 breaks, the decline could extend further toward 170–168.

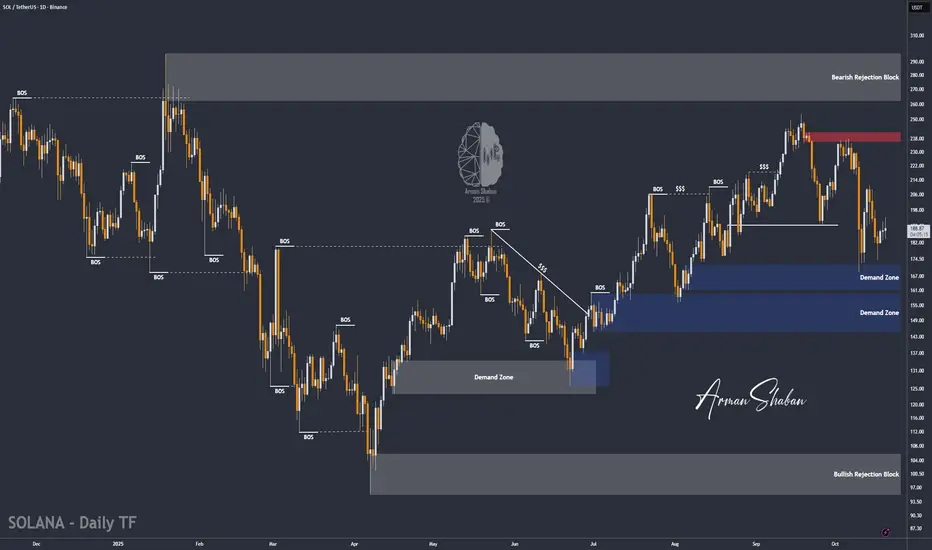
SOL/USDT | SOL Update – Recovering After Volatile Swings!By analyzing the #Solana (SOL) chart on the daily timeframe, we can see that after a sharp drop to around $169, SOL quickly rebounded to $211, then faced another correction back to $174. Since holding steady above $170, the price has regained momentum and is now trading near $190, showing signs of renewed strength.
If SOL manages to maintain stability above the $170–$175 zone, the bullish structure remains intact. The next upside targets are $211, $216, $238, and $254 , where short-term reactions may occur before further continuation.
The overall outlook remains bullish , but you should watch closely to see if SOL can sustain its momentum above current levels — this could be the start of a new leg higher.
Please support me with your likes and comments to motivate me to share more analysis with you and share your opinion about the possible trend of this chart with me !
Best Regards , Arman Shaban
Solana’s Next Move Depends on $160 Support ZoneHello guys!
Solana is currently stuck between the Decision Point (DP) zone and the Weekly Support area, showing hesitation in market direction.
However, the recent breakdown of the ascending trendline signals a potential shift in momentum from bullish to bearish. The price now appears to be heading toward the purple demand zone around $172–$160, which acts as an important short-term support area.
If the $160 level fails to hold and we see a confirmed breakdown below it, Solana could continue its decline toward the weekly support zone near $120–$130. On the other hand, if buyers defend the purple area strongly, we might see a temporary rebound before any further downside move.

Be careful with SOLANA !!!It can be said that the price has broken out of this triangle and may experience a solid upward move. However, before the rally, it will likely liquidate long positions once.

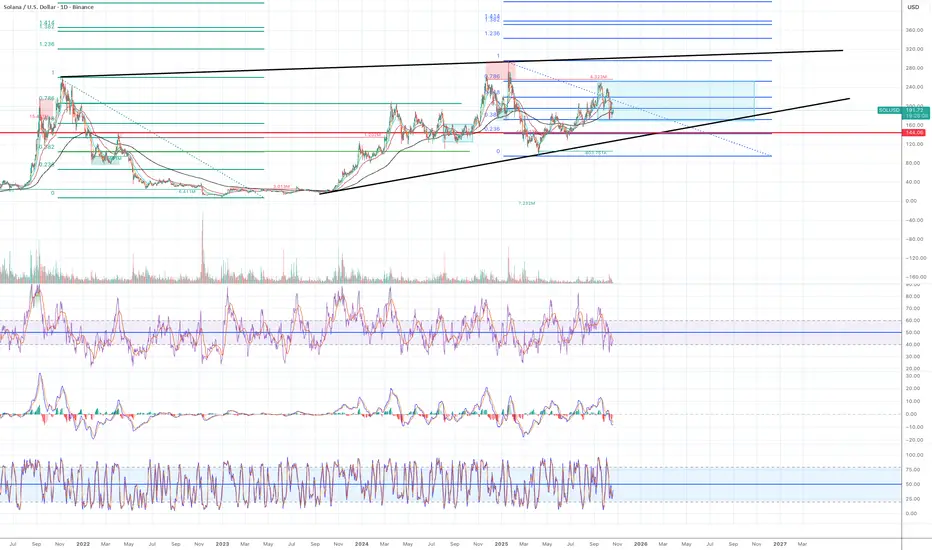
Getting bullishMy macro bias for Solana is bullish. I invest in Solana and I mainly hodle the asset. The price action of Solana in the last 18 months has been very difficult, therefore, I have been avoiding to trade it. However, I am becoming cautiously optimistic as a Solana bull and I can see some clear signs of price recovery.
Look at a green major Fib retracement from the previous cycle ATH at $262 to the bear bottom at $8.25.
1) the price moved rapidly to $208 at Fib 0.786 in March 24. It spent about a month consolidating around that level but it eventually failed to break above and spent 8 months consolidating between Fib 0.382 and 0.786 range.
2) The price eventually broke above 0.786 and 0.1 and reached historical ATH at $293 in Jan 2025 and started a sharp decline to $95, which is roughly Fib 0.382 area.
Look at blue major Fib retracement from historical ATH to the recent bottom ($293 to $95).
1). The price moved to $250 at Fib 0.786 in mid Sept 2025. It spent several days consolidating around that level but it eventually failed to break to the Fib 0.382 zone at $172.
Based on the two major Fib retracements, I am watching to see if the price will hold above Fib 0.382 level. It is normal for the price to consolidate between Fib 0.618 and 0.382 but I often see Fib 0.786 and 0.236 to work as the last line of defense. Once the price goes above or below Fib 0786 and 0.236, the trend can start to break down. So as long as the price stays above Fib 0.236, but ideally above 0.382, my bias is bullish.
$144 (red horizontal line in the chart) is the level Solana had the last bull trap and started the macro bear cycle. This level should work as a strong support level.
I keep adding more to my position when the price dips to Fib 0.382 area at the moment but it is for investment.
For swing trading, I am waiting for the following conditions:
1) Daily candle closes above previous swing higher low at $191.80/
2) EMA 12 > EMA 21 > EMA 55
3) A daily candle is above EMA 200.
4) RSI lines cross to the upside and ideally enter the bull zone.
5) Stochastic are moving to the upside but not overbought.
6) MACD can stay in the bear zone but is starting to tilt to the upside.
Friday Massacre - cash ready! Another Friday massacre
The chart is looking extremely bearish.
I think the price is going to move to the $95-107 zone where the V-shape recovery happened after April liberation day.
Many people stayed on the sideline without getting into the market. I think the price wants to come back to that level for reset before the next big move up.
It structurally makes sense as well. You can see the fib retracement level in the chart from the previous cycle's ATH to the bear market bottom.
I often (not always) see Fib 0.786 and Fib 0.236 work as the last line of defence. So when the price breaks and closes above Fib 0.786, it eventually moves to the upside even if it temporarily pulls back.
In case of the down trend, if the price breaks and closes below Fib 0.236, the price will eventually move to the downside.
When you look at the Solana weekly chart, the price broke above 0.786 in Nov 24. It failed to continue to move up and spent months consolidating in the tight range. So I think it will eventually go up, but the chart is not telling me no so fast.
All weekly momentums indicate bearish momentum is building up.
I think the price might go to the following areas:
1) $135 - Fib 05, previous lower high, ascending support line, the level the final bull trap happened in 2022
2) $106.5 - Fib 0.382, liquidity pool, April liberation day bottom
3) $100 - psychological level
4) $ 68 - 100 - Fib 0.236-0.382 - absolute capitulation zone.

Solana Ready for Bullish ContinuationSolana demonstrates a constructive market posture with evidence of renewed accumulation following its recent corrective phase.Price activity indicates that buying momentum is gradually strengthening as liquidity continues to shift from weak hands into strategic positioning.The market structure shows improving stability,with compression patterns hinting at an impending expansion cycle.Sustained absorption near recent lows underscores growing institutional participation,reinforcing the probability of continued upward repricing.Trading volume remains consistent,reflecting controlled demand rather than speculative inflow.The overall market tone supports a constructive bias,with expectations aligning toward a progressive recovery phase and potential continuation of the broader bullish trajectory.

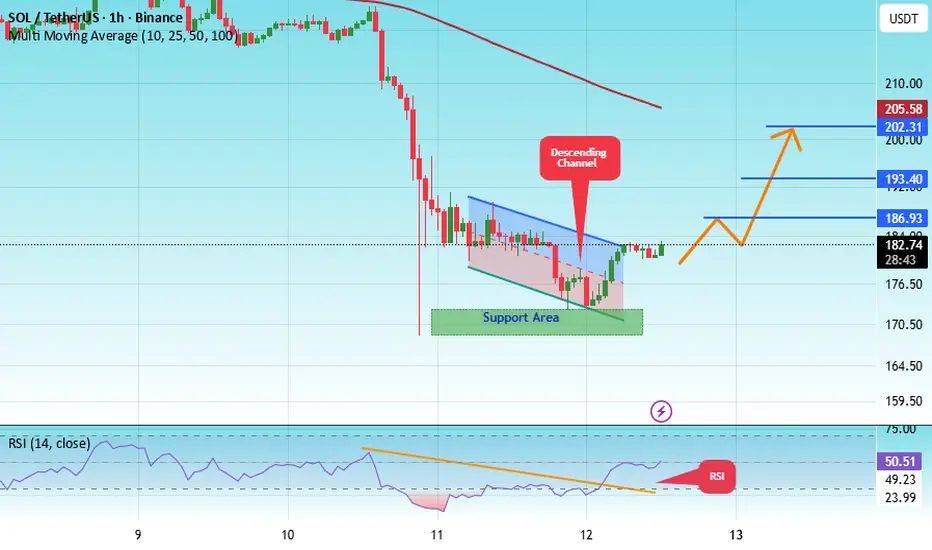
#SOL/USDT chart (1-hour timeframe)...#SOL
The price is moving in a descending channel on the 1-hour frame and is expected to break and continue upward.
We have a trend to stabilize above the 100 moving average again.
We have a downtrend on the RSI indicator that supports the upward move with a breakout.
We have a major support area in green that pushed the price higher at 188.
Entry price: 195.
First target: 200.
Second target: 207.
Third target: 214.
To manage risk, don't forget stop loss and capital management.
When you reach the first target, save some profits and then change the stop order to an entry order.
For inquiries, please comment.
Thank you.

Solana Fails To Hold Above $200 Amid $500 Million SOL SellingSolana’s price currently stands at $192, holding just above a key support level at the same mark. The altcoin recently dipped after failing to secure a foothold above $200, but resilience at this level remains a positive sign.
Given the current on-chain dynamics, SOL may soon reverse its recent losses. A successful breakout above $200 and $205 could pave the way toward $213, signaling renewed bullish momentum.
However, if selling continues to dominate and confidence remains weak, Solana’s price could fall to $183. Such a decline would invalidate the bullish outlook and deepen the short-term downtrend.

SOLUSDT – Weak rebound, bears back in controlAfter a sharp drop on October 14, Solana made a slight recovery but quickly hit resistance at the downtrend line — where sellers stepped back in strongly. The $208 zone continues to act as a tight lid on price action, signaling that current buying pressure isn’t strong enough for a reversal.
With U.S.–China trade tensions still simmering, the overall crypto market — including SOL — remains under pressure. If the price fails to break above this descending trendline, SOL could likely fall back toward the $188 support zone, or even $175 in the next move.
In short, the main trend remains bearish, and current rebounds look more like opportunities for sellers to reload for the next push downward.

SOL/USDT: Recovering from Flash Crash with Bullish Setup FormingSOL/USDT rebounded sharply from the $170 support following a flash crash and is now consolidating near the $200 level within a mid-range structure. Price action displays a sequence of impulse and correction legs, indicating buyers are attempting to regain control.
A stable close above $210 could confirm renewed bullish momentum toward the $230 resistance zone. The broader setup points to range accumulation, with potential for an upward breakout if momentum continues to build.

Long I opened a long position for a swing trade this morning.
A daily candle is still below EMA 12/21/55 and has not broken above the descending resistance line, however, I see a lot of bullish signs in the chart. I am cautiously optimistic, however, the bull is not in full control yet.
Daily:
Stochastic formed a clear positive divergence and is no in the bull zone.
RSI lines are trapped inside the descending triangle. The momentum is clearly building up and I am anticipating it to break to the upside given RSI line is starting to move to the upside and slow
MA (orange) line is also starting to tilt to the upside.
MACD lines are still in the bear zone, however, histogram shows the bearish momentum is weakening.
A daily candle is still below EMA 12/21/55, however, the price strongly held above the previous higher low at $190 (blue horizontal line) .
A daily candle is also above EMA200, two major support lines (purple and orange lines).
4H:
All three momentum indicators are in the bull zone now.
The price moved to the purple support line, moved up, retraced to retest Fib 0.382 level.
The price is above both EMA 12 and 21.
Trade plan:
Entry price: $202
S/L: $189
Target : $223

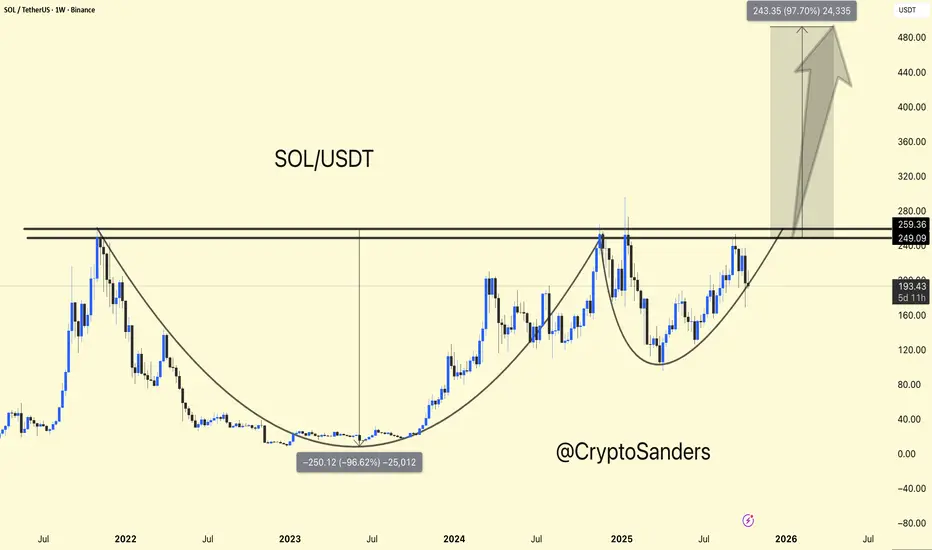
SOL/USDT Weekly Chart Update !! SOL/USDT Weekly Chart Update
SOL is forming a massive cup and handle pattern on the weekly timeframe – a strong bullish continuation setup leading to a major breakout.
Currently trading around $199, SOL is consolidating below the key resistance level of $250-$260. Once we achieve a weekly close above $260, it could confirm a breakout move towards $450-$480 (approximately +90-100% upside).
Support: $170-$180 (handle base/accumulation zone)
Resistance: $250-$260 (breakout zone)
Target: $450-$480
Overall sentiment remains bullish – the structure is clear, and momentum is building. A confirmed breakout above the resistance level could mark the start of SOL's next major surge.
DYOR | NFA
SOL ; BUY OR SELL ?Hello friends
Given the decline we had, we can see it as an opportunity to buy at lower prices with risk and capital management.
Now we have obtained support levels for you and we have an important resistance that the price must break strongly to make the climb valid for us.
The goals are also clear.
*Trade safely with us*

#SOL/USDT | SOL: Market Calms After Sharp Move & RSI Support#SOL
The price is moving within a descending channel on the 1-hour frame, adhering well to it, and is heading for a strong breakout and retest.
We have a bearish trend on the RSI indicator that is about to be broken and retested, which supports the upward breakout.
There is a major support area in green at 170, representing a strong support point.
We are heading for consolidation above the 100 moving average.
Entry price: 182.
First target: 186.
Second target: 193.
Third target: 202.
Don't forget a simple matter: capital management.
When you reach the first target, save some money and then change your stop-loss order to an entry order.
For inquiries, please leave a comment.
Thank you.
Another dip coming? Buy the strength, insteadThe current price action is very similar to that in May/June 2025 (see yellow rectangular box in the charts).
In May, the price started to finally recover from April's bottom. It started to move above the major support/resistance line (purple line in the chart) that was forming a massive cup and handle pattern, but it ende up to be a fake out and the price started to move to the downside again. The real recovery started after the price dropped to the unmitigated fair value gap (blue rectangular box). I am seeing a very similar set up in the current price action.
On last Friday, the price aggressively dropped to the same major support/resistance line (purple line) . The price held that level and spectacularly bounced up on weekend. It was the great buy the dip opportunity, but I had a feeling that there would be another deeper dip to follow.
The reason for that is that higher time momentum indicators were incredibly bearish and it didn't give me any sense of a V-shape recovery. Also a skeptical side of me makes me think that when there is such a clear bounce at the key area, it becomes so obvious where people place S/L (just under Friday's wick). If I were a market maker, I would definitely try to push the price down to take all the liquidity out.
What I am seeing in the charts:
Daily:
Both RSI and MACD are in the bear zone and pointing to the downside.
Stochastic indicator formed positive divergence, but Stochastic is more reactive and when the direction of the stochastic is contradicting RSI and MACD, it is almost always a corrective move.
EMA200 is cutting across three candles. When EMA200 is dead horizontal and sitting on the candles, EMA200 works like a magnet. The price tends to oscillate until strong momentum builds up to push the price to one direction.
4H:
When you see the price in the 4H chart, it bounced up to Fib 0.618 level and EMA 200 (proper pull back) and now it is starting to move to the downside.
But the most important thing is that there is a cluster of unmitigated fair value gap in the $135-$155 zone (orange rectangular block). It takes a lot for the price to move to that level, however, yesterday's daily candle in both SP500 and Nasdaq is trapped inside Friday's massive bear candle. If traditional market starts to break down, Solana will definitely fall further.
Stochastics formed negative divergence and started to roll to the downside.
MACD is still in the best zone and starting to lose bullish momentum.
RSI slow MA line is still in the bear zone and RSI line is already rolling to the downside.
Conclusions:
It is not a bad zone to nibble, but definitely not the time to open a leveraged position!!
It is better to miss the absolutely bottom and buy the strength.
Good luck !

Support around 212.91 is crucial
Hello, fellow traders.
By "Following," you'll always get the latest information quickly. Have a great day today.
-------------------------------------
(SOLUSDT 1W Chart)
The chart may look complicated due to the drawn lines, but the key is whether the price can rise above the boxed area.
In other words, whether the price can rise above the 179.53-237.60 range and maintain its upward momentum is crucial.
-
(1D Chart)
The HA-Low indicator on the 1D chart is showing signs of forming at the 212.91 level.
Therefore, if support is confirmed around 212.91, it would be a good time to buy.
However, the HA-High ~ DOM (60) range has formed in the 236.88-237.60 range, so we need to see if it can break above this range.
If the upward breakout fails, it's time for a partial sell-off.
-
To continue the uptrend by breaking above a key zone or point,
1. The StochRSI indicator must be trending upward. If possible, it should be below the overbought level.
2. The On-By-Value (OBV) indicator must be trending upward. If possible, it should remain above the High Line.
3. The TC (Trend Check) indicator must be trending upward. If possible, it should remain above the 0 level.
If the above conditions are met, the uptrend is likely to continue.
-
Thank you for reading to the end.
I wish you successful trading.
--------------------------------------------------

SOL/USDT – Daily OutlookAfter forming a potential harmonic structure, SOL seems to be following a corrective path from point B (0.789 Fib) toward a possible C leg around the 0.886 retracement zone — an area that could act as a strong support.
If the pattern completes, we might see a bullish reaction from that zone, targeting:
1st Target: 345.5 USDT (1.27 Fib extension)
2nd Target: 412 USDT (1.618 Fib extension)
However, failure to hold near the C zone could lead to deeper retracements before any significant reversal.
📊 Overall, I’m watching for a confirmed bounce at C before considering long positions.
#SOLUSDT #HarmonicPattern #CryptoAnalysis #TradingView

Too Early to Buy Solana? Watch the $200–210 ZoneAs mentioned in my general crypto post yesterday, I remain bullish on the broader market and still hold some altcoins at this stage.
However, that doesn’t mean we should jump in blindly, assuming this is it.
Every setup needs confirmation — and Solana is no exception.
At the time of writing, SOL/USD is trading close to my initial entry area, but price action deserves a closer look.
1. What Happened on Friday
The general market sell-off pushed Solana below both a key horizontal support and the lower boundary of its rising channel — a clear bearish technical signal.
After that, we saw a strong recovery into the weekend, with price touching the psychological $200 level overnight before facing some resistance.
2. Current Market Structure
Despite the bounce, the structure remains bearish for now.
A clean stabilization and acceptance above the $200–210 zone would be the first technical sign of a potential trend shift to the upside.
3. Trading Plan
If you’re considering a long position on Solana, I believe it’s too early to enter.
The market looks overconfident in recovery, and when everyone assumes “the bottom is in,” that’s often when a new drop comes.
Wait for confirmation!

BNB ANALYSThe analysis is on daily time frame and will give you a long term view
If these analyses help you to make better profits then share this analysis with your friends
And post your questions below this analysis

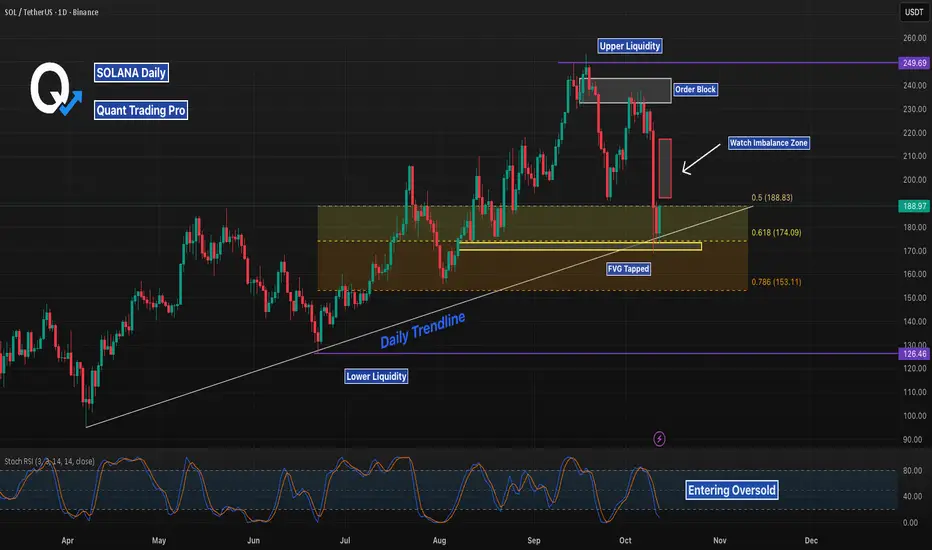
SOL Daily Recap: Breakout or Reversal Ahead?Solana (SOL/USD) recently tested the daily trendline support around $174.09 and bounced, with price action now approaching the FVG target zone near $189.55. The bullish move pushed toward the watch imbalance zone at $200, hinting at a potential breakout toward upper liquidity at $240 if momentum holds. However, the order block rejection near $210 suggests caution—watch for a bearish reversal if it fails to break, targeting lower liquidity at $153.11. With Stoch RSI entering oversold, a bounce or further dip could be next—keep an eye on $200 as the key pivot!