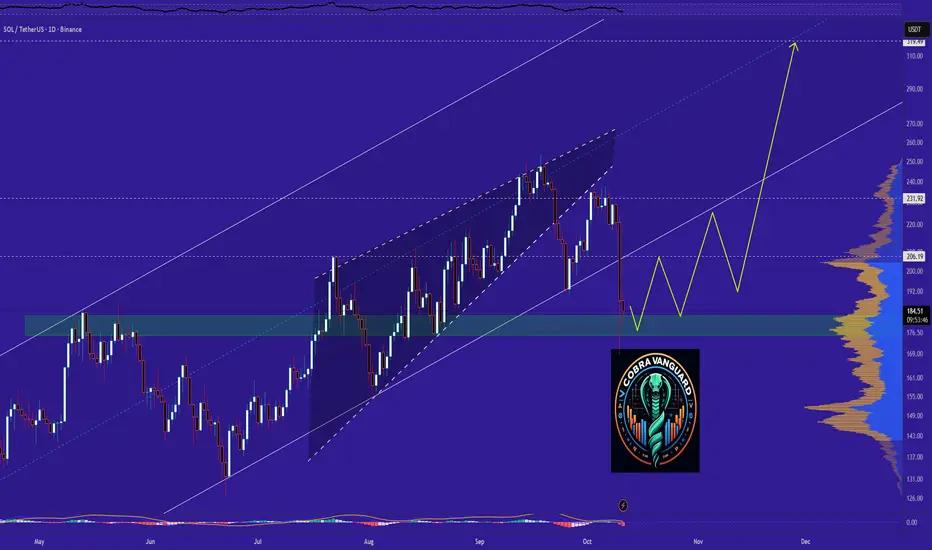
SOL last support area potenial of 20% gain toward 218$hi
the support and resistances on the chart are based on the previous data and weekly candlesticks if BINANCE:SOLUSDT holds this last support the potential of 20% gain is logical toward 218$
Solusdt

SOLANA Outlook after the Dip. What to expect NOW? has broken below its ascending channel support near $190, signaling short-term weakness. If buyers fail to reclaim this level, price could test the $150–$160 demand zone. A strong rebound from that area might restart the uptrend toward $220–$240.
The price can easily reach the shown targets from here.
Best regards CobraVanguard.💚
Solana Faces Bearish Pressure Below $190 SupportHi everyone!
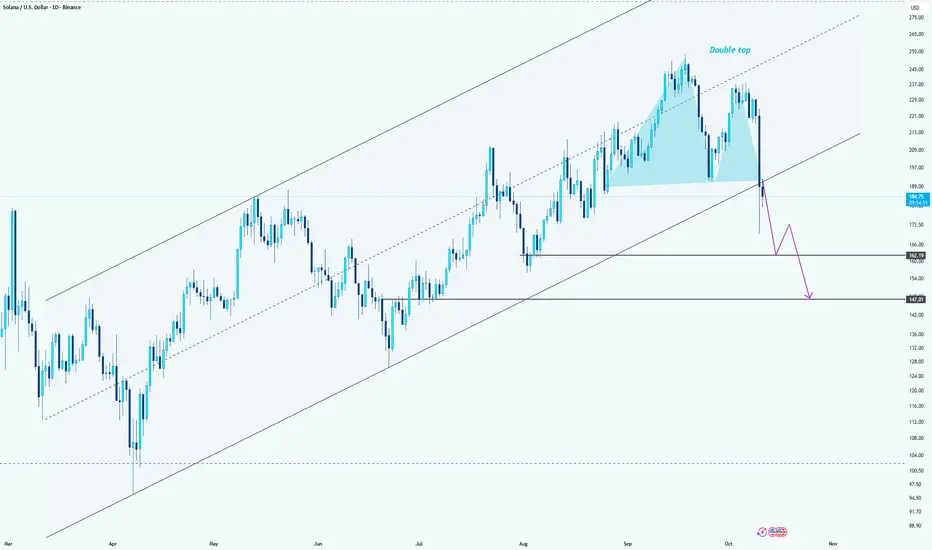
Solana appears to be forming a double top pattern near the $250 zone, signaling potential bearish momentum. After failing to sustain above the upper channel resistance, the price broke below the midline support, confirming short-term weakness.
Currently, SOL is retesting the neckline area around $190. If it fails to reclaim this level, further downside is likely. The next key support zones lie around $165 and $147, aligning with the previous structure and the lower channel boundary.
A clean break below $165 would likely accelerate the move toward $147, confirming a deeper correction within the broader ascending channel.
Bias: Bearish below $190
potential targets at $165 → $147.
Solana - Market structure Shift - The Levels to be aware of !In this video I look at the higher time frame and point out some key reasons of why I'm expecting a deeper pullback as well as local time frame where we can see the clear levels to be taken if your looking to accumulate or open longs .
Aside from the Solana coin I look at the Eth/Btc pair and BTC which ultimately determines the fate of the alt coin market .
Any questions please feel free to ask in the comments section below

Solana and Bitcoin Update ! Whats Next Quick update covering BTC and Solana .
I had done videos previously anticipating this move to the downside and wanted to cover the current price action and add a little clarity to the situation .
We have had a great reaction off of BTC so far and thus some alts have also followed suit .
Bitcoin holds the fate for the alts so we want to see btc hold the current range 113K .
Take it level by level and dont panic . This is a great opportunity but we want to see a sign of strength in SOL before taking positions .

SOL | Network Strength Meets Market MomentumSolana (SOLUSDT) continues to show resilience as both technical and fundamental factors align for potential upside. On the technical side, the market has completed a controlled correction phase, suggesting liquidity buildup below recent lows. The structure remains bullish, with increasing volume and price stability hinting that buyers are regaining control. Fundamentally, Solana’s network growth and strong developer activity have reinforced investor confidence, supported by rising on-chain activity and ecosystem expansion in DeFi and NFTs. This combination of solid fundamentals and technical structure indicates the possibility of another bullish leg, with SOL positioning itself for a gradual climb toward the $240–$250 range in the near term.
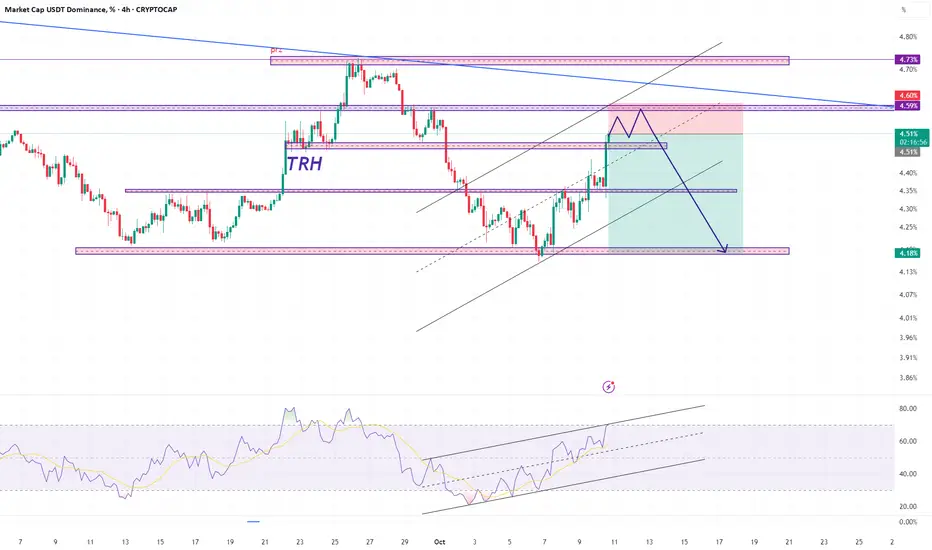
usdt.d 4hHello friends, I am Mehdi.
Given the area, we expect a price correction from this area trh.
Reasons:
We are in the area trh.
There is a possibility of approaching the channel ceiling and then correcting the price.
The resistance at 4.60 is a good place to buy.
I would like to thank you for supporting me by liking and commenting.
And please state your desired currency for analysis.
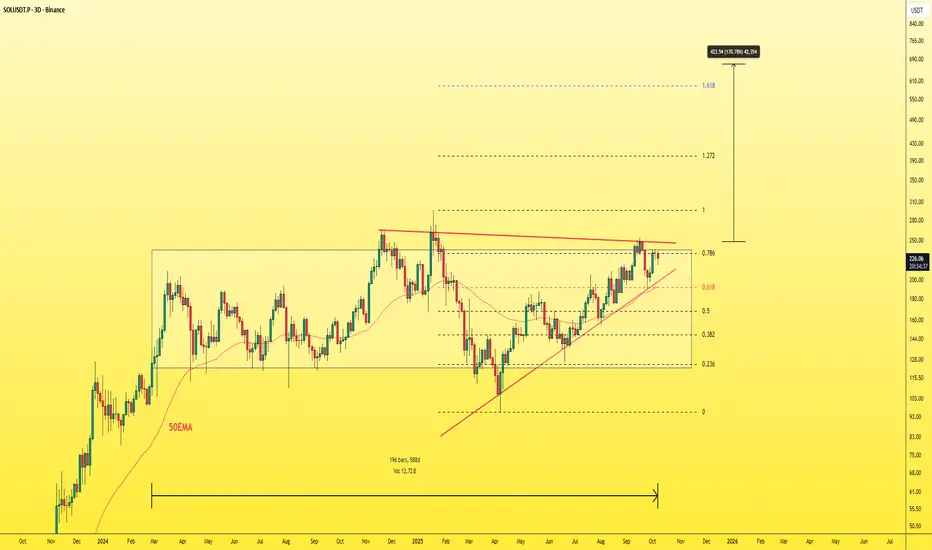
SOLUSDT - Smart Investment!If you missed the Ethereum rally, don’t miss Solana’s.
The 3-day chart looks insanely bullish — the coin has been consolidating for 588 days, almost 20 months.
Right now, it’s forming a massive triangle pattern with a minimum target of $650.
Trust me, you don’t need to put your money into crazy coins and risk losing it.
You’ve got SOL — with a strong chart and a solid market cap.
Forget those who say high market cap coins don’t move much.
Look at BNB, ETH, and BTC — they’ve all had massive runs and hit new all-time highs. It’s a much safer and smarter investment than chasing random volatile tokens.
Best Regards:
Ceciliones🎯
Sol/Usdt - Breakout Or BreakdownResistance Zone
A green shaded area labeled "Resistance" indicates a key price level where price has previously failed to break higher.
This is a supply zone where sellers have stepped in multiple times.
Price has tested this resistance area several times but failed to break out convincingly.
2. CHoCH (Change of Character)
"CHoCH" is marked below the resistance, signaling a trend shift from bullish to bearish.
Typically, a CHoCH occurs when price breaks a recent higher low—indicating weakening bullish momentum and potential start of bearish move.
3. Decision Point
Labeled in blue as “Decision Point”.
This is a critical area where price may:
Break above and confirm a bullish continuation.
Reject and fall, confirming bearish pressure.
This zone could be used to plan entries based on confirmation (e.g., breakout or rejection).
4. Target Scenarios
Two possible scenarios drawn with arrows:
Bullish scenario: If price breaks above the decision point/resistance, the next target lies in the upper 230s or beyond.
Bearish scenario: If price rejects from this zone, it could lead to a bearish continuation, targeting lower support levels.
5. Volume
Volume bars at the bottom show varying levels of interest.
Increasing red volume toward the CHoCH indicates strong selling pressure.
Conclusion / Trading Plan
Watch the Decision Point zone closely.
Bullish bias: On a breakout with strong volume and bullish candle close above resistance.
Bearish bias: On rejection from the resistance zone with a lower high and a strong bearish candle.
Use tight risk management due to the proximity of volatility around the decision point.

BUY AND HOLDHello friends
Due to Solana's ATH and the Solana network becoming wider every day, big money is entering this currency, and considering the pullback we made, it is a good opportunity to enter with risk capital management and buy in steps in the specified areas.
Note that the holding period is at least 3 months, so be patient and observe capital management.
*Trade safely with us*

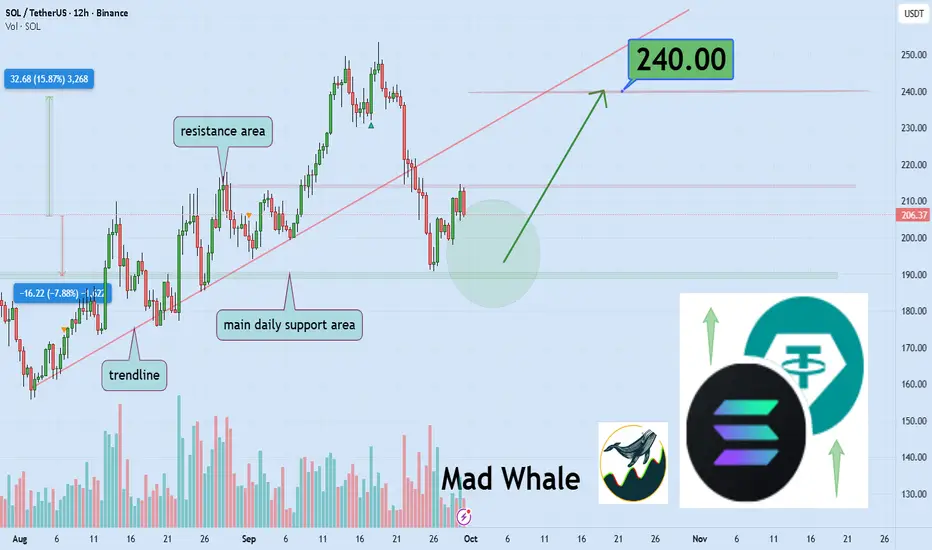
Solana Tests Key Support Could Jump 15% Target 240$Hello✌️
Let’s analyze Solana’s price action both technically and fundamentally 📈.
🔍Fundamental analysis:
Nine firms just filed for Solana (SOL) ETFs, and the SEC is fast-tracking reviews till mid-October.
Analysts expect up to $1.8B inflows in Q4, using ETH ETF history as a guide.
If approval comes, SOL could attract big institutions.🚀📊
📊Technical analysis:
BINANCE:SOLUSDT is testing a key daily support; holding this zone could spark a 15% rally, targeting $240. 📈🛡️
📈Using My Analysis to Open Your Position:
You can use my fundamental and technical insights along with the chart. The red and green arrows on the left help you set entry, take-profit, and stop-loss levels, serving as clear signals for your trades.⚡️ Also, please review the TradingView disclaimer carefully.🛡
✨We put love into every post!
Your support inspires us 💛 Drop a comment we’d love to hear from you! Thanks, Mad Whale
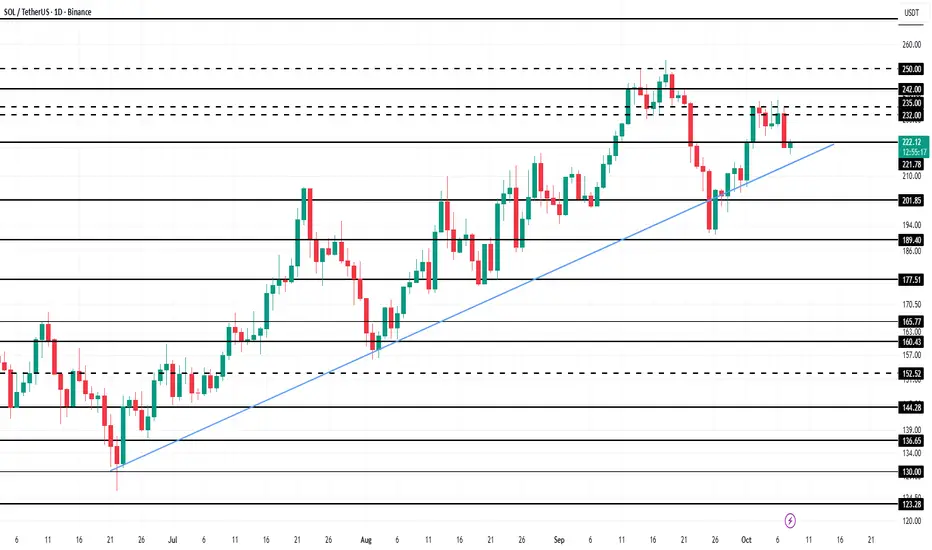
Solana Price’s 4-Month Uptrend Is Intact, But It May Not Last LoAt press time, Solana trades at $222, hovering just above the $221 support level. The altcoin has been in a consistent upward trend for the past three and a half months, making this level crucial for maintaining market structure.
Given current conditions, a dip to $213 seems likely if selling pressure increases. Stronger outflows could accelerate losses, pushing SOL to test the $200 level and breaking its multi-month uptrend.
Conversely, if Solana rebounds from $221 and market sentiment improves, it could climb toward $232 and beyond. Such a move would invalidate the bearish outlook and potentially reignite the rally.
solana x binance coin Solana follow it Binance Coin on its journey to $1k
CRYPTOCAP:SOL vs. CRYPTOCAP:BNB

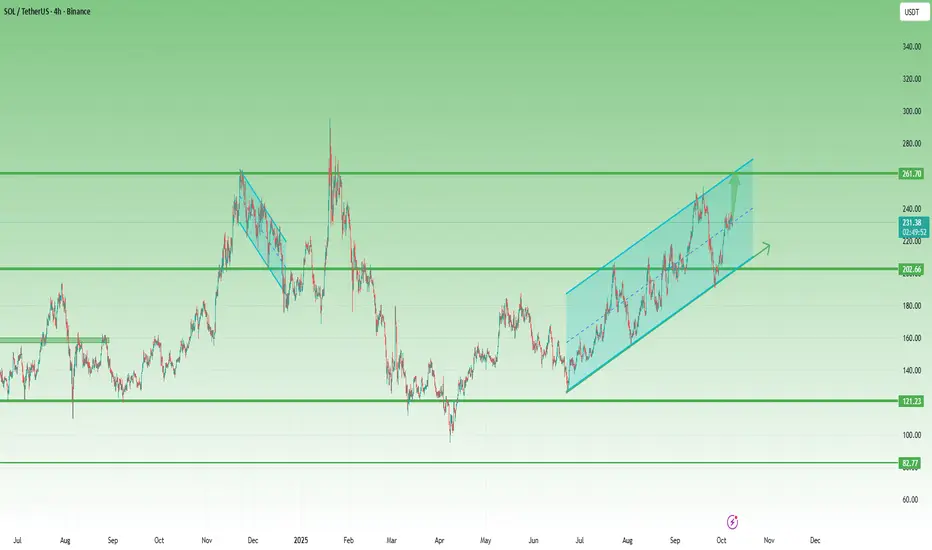
Solana in an Ascending Channel – Bulls Must Hold Above 215After the strong correction from 300 to below 100, Solana finally started to recover. Following an impressive 90% rebound, the price corrected again but managed to form a higher low just above the 120 support zone — a constructive signal for medium-term buyers.
Since then, Solana has been trading inside an ascending channel, showing consistent bullish control with well-defined higher highs and higher lows.
Recently, the market spiked slightly below 200, only to confirm the lower boundary of this channel before bouncing back.
In my previous SOLUSDT analysis, I mentioned that it was imperative for bulls to hold the 200 level to validate the ongoing reversal structure — and that’s exactly what happened. The market respected this support zone perfectly, leading to a 15% advance since then.
At the time of writing, Solana is consolidating near the midline of the ascending channel, suggesting a temporary pause before the next potential leg higher.
If this consolidation breaks to the upside, the next key target for bulls is 260, a confluence resistance formed by the upper boundary of the channel and the November 2024 swing high.
________________________________________
🔹 Summary
• Strong support: 200 (confirmed)
• Ideal bullish threshold: Above 215
• Next resistance: 260 followed by 300
• Structure: Ascending channel – continuation pattern
________________________________________
In conclusion, Solana remains bullish while holding above 200, but ideally, the price should stay above 215 to preserve upside momentum.
A breakout above 240 would likely trigger a test of 260 followed by 300, which becomes very probable— the next key resistance zone. 🚀
Long the king, and short the "Sol" Jack ?Being long Bitcoin is being long on a healthy market rally with BTC.D bouncing, and therefore Bitcoin leading.
If BTC.D bouncing means an overall retrace on the market, I think Sol makes a good candidate for a short position to target 150s
I think the DATs and the ETF narratives are getting pretty exhausted, and that could make an extra argument, even if this is the part where it gets tricky (timing tops is hard).
Still, i think playing this with 30/40% of the Bitcoin long is EV+
Game on!

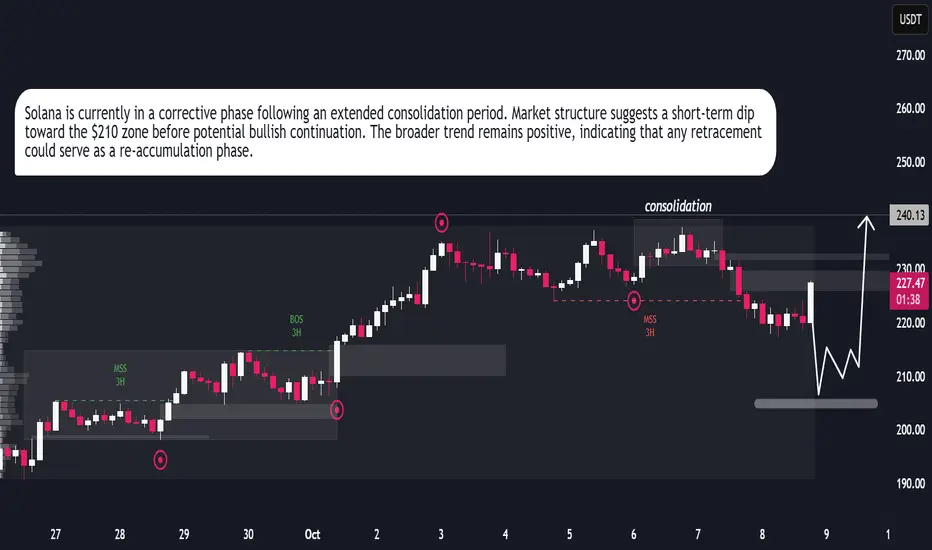
SOLUSDTSOLUSDT
I expect the price to go to 250 zone, the latest hh and if the price is not making a new hh then i expect the price to go down to 212 zone and bounce from there if the support stay.

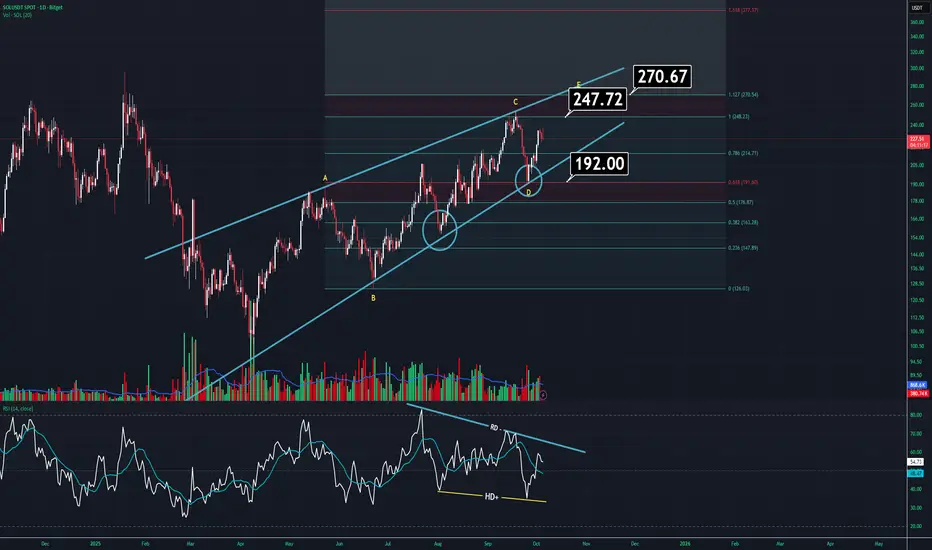
SOLANA UPDATE (1D)SOL is currently at a decision point, mainly due to both the ongoing recession and the delayed ETF approvals.
On the daily chart, it’s getting squeezed inside a large wedge pattern. Normally, it should make one more top before breaking down. However, just to be clear — if price drops below 192, there’s a strong possibility of a sharp sell-off. That’s where both the character shift and wedge breakdown would occur.
Some additional details:
Volume is flat and indecisive. It’s moving in line with the wedge, which isn’t a great sign. Typically, this kind of volume behavior is seen during wedge formations.
The RSI looks unusual — there are both negative and hidden bullish divergences. If you’re wondering which one matters more, it’s the hidden bullish divergence — it’s the stronger signal here.
If the recent high is broken, we could see SOL climbing towards the 270 region, after which we’ll know whether the wedge remains valid. However, in general, the outlook doesn’t look too strong at the moment.
Weekly Crypto Market Outlook: Trend Structures and Expectations The market continues to follow a macro-pattern similar to the previous bull cycles that unfolded in Q4 of 2013, 2017, 2020, and 2021. I discussed this structure in detail in my August 18 update:
Specifically: a summer rally, several weeks of September correction and consolidation, followed by the beginning of a new upside leg in early October.
Updated BTC chart:
Another key development is the stablecoin market capitalization approaching a major technical zone. A confirmed breakout above it could signal a strong liquidity rotation into crypto assets — potentially marking the start of a new wave of growth across the crypto space, similar to the dynamics seen in 2023 and 2024.
Inverse correlation of BTC and stablecoin market cap:
Perhaps the most compelling factor is Bitcoin’s relationship with gold. Despite massive institutional adoption through ETFs, the BTC/GOLD ratio has remained stagnant since early 2021. This suggests that Bitcoin remains significantly undervalued relative to gold, leaving substantial room for appreciation as the digital asset continues its mainstream integration.
BTC/GOLD chart:
These factors — combined with the fact that most altcoins have already broken above their local resistance zones mentioned in the previous review — point to a potential recovery of upside momentum across the crypto market and higher targets into Q4.
As long as prices hold above their local and mid-term support zones, I expect continuation of the rally toward the next resistance levels. Breaking these support zones, will push odds in favor of more prolonged consolidation. But as long as BTC is not closing bellow its 50DMA for more than two weeks, macro bull cycles remains intact.
Below are the key technical levels for the main assets this week:
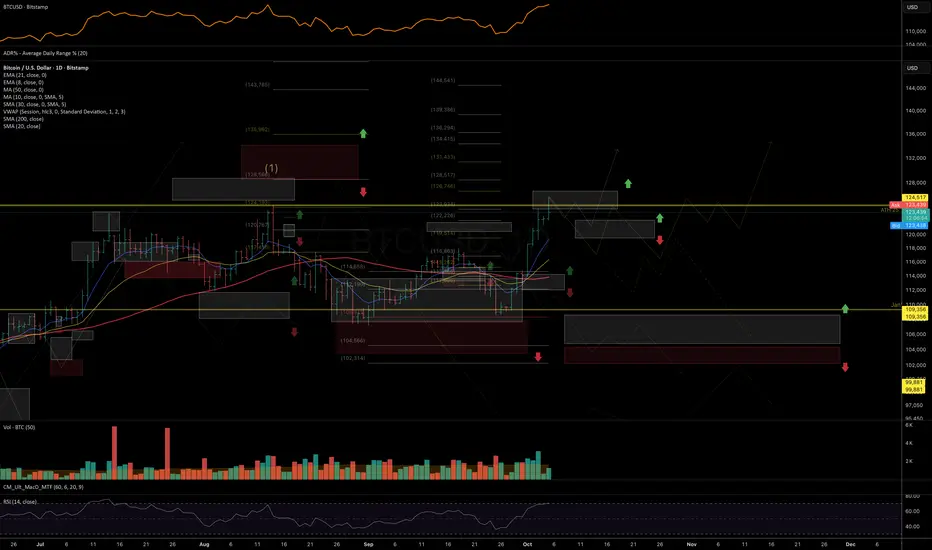
BITSTAMP:BTCUSD
Chart:
Short-term support: 122–119.5K
Mid-term support: 117–115K
Resistance: 131–135K
BITSTAMP:ETHUSD
Chart:
Support: 4400–4375
Resistance: 4870–5070
BINANCE:BNBUSD
Chart:
Support: 1142–1089
Resistance: 1225–1275
BINANCE:XRPUSDT
Chart:
Support: 2.92–2.88
Resistance: 3.20–3.35
CRYPTO:HYPEHUSD
Chart:
Support: 48.5–47.35–46
Resistance: 55.5–60
BINANCE:SOLUSDT
Chart:
Short-term support: 223–219
Mid-term support: 212–207
Resistance: 247–260
Thank you for reading - wishing you a great Sunday and a strong start to the new trading week.
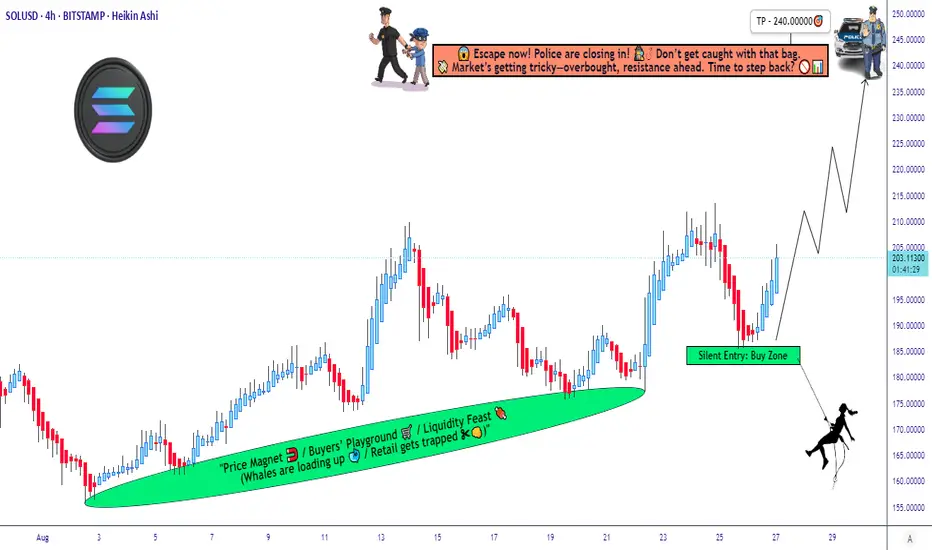
SOL/USD: Bullish Swing Plan w/ Layered Buy Limits & Target🏴☠️ ATTENTION ALL THIEVES & ROBBERS! 🏴☠️
Asset: SOL/USD "Solana vs U.S Dollar" Crypto Market Heist Plan (Swing / Day Trade)
Plan: Bullish Heist ✅
🎯 THE MASTER PLAN: OPERATION SOLANA BULL RUN
Ladies & Gentlemen of the thieving community! 👔🦹♂️🦹♀️ Based on the Thief Trader's secret technical analysis, the vault door to Solana profits is creaking open! Time to execute the heist!
🚪 ENTRY: LAYER UP & SLIP IN SILENTLY
The Thief is using a multi-layer limit order strategy for this entry! We don't knock down the door, we pick the locks one by one! 🔓
Place your buy limit orders at these levels:
Layer 1: 190.00000
Layer 2: 195.00000
Layer 3: 200.00000
🛠 PRO TIP: You can increase your limit layers based on your own capital! More layers = bigger haul! 💰💰
🛑 STOP LOSS: THE GETAWAY DRIVER'S LOCATION
This is the Thief's SL: @180.00000
Listen up, OG's! 👉 Adjust your final SL based on your own strategy and risk appetite! Don't get caught because you got greedy on the entry! Know your exit route! 🚗💨
🎯 TARGET: ESCAPE BEFORE THE COPS ARRIVE!
The police barricade is forming at @240.00000! 🚨👮♂️
Do NOT get greedy! Grab the stolen money, exit the vehicle, and ESCAPE WITH THE PROFITS before the target! A true thief knows when the job is done! 🏁💰
⚠️ THIEF'S FINAL WARNING & DISCLAIMER
📰 News is an Undercover Cop: It will wreck our plan! Avoid new trades during high-impact news!
🔄 Use Trailing SL: Once in profit, trail your stop to lock it in! Protect the loot!
📉 This is not financial advice. This is a heist plan. You are the thief. Your capital, your risk. I'm just the mastermind.
💖 Enjoyed the plan? SMASH THAT LIKE & BOOST BUTTON! ✅ It helps our crew grow and plan the next big score! 🚀🤝
Stay sharp, thieves! I'll see you on the next heist. 🤑👋
TradersCity Pro | Solana Bulls Eye Breakout Beyond Resistance👋 Welcome to TradeCity Pro!
In this analysis, I’ll be breaking down Solana (SOL),one of the most popular “Ethereum Killer” projects, currently ranked #6 on CoinMarketCap with a market cap of $122.87B.
⌛️ 4-Hour Timeframe
On the 4-hour chart, Solana started a bullish move after being supported at the $194 zone. Once it broke the trigger at $213.14, it rallied strongly toward the next resistance zone I’ve marked on the chart.
✨ At the moment, that bullish wave has cooled off. The RSI has exited the overbought zone, and price has been rejected from the resistance ceiling.
✔️ The next bullish trigger we’re watching will be a clean breakout of this resistance zone. On future retests, we can identify the exact resistance level more precisely and use it as an actionable entry trigger.
⭐ The main resistance for SOL is at $248.58. A breakout here would confirm the start of a larger bullish wave in the higher cycles. That’s why it’s important to already have a position before this breakout—so if the level flips, you’re not left behind and your earlier long runs into solid profit.
🔍 If price pulls back, the outlook remains bullish as long as SOL stays above $213.14. In that case, I see more probability for the next bullish leg than for a trend reversal.
📊 However, if $213.14 breaks and price consolidates below it, that would be the first confirmation of a bearish shift and a possible trend reversal.
📝 Final Thoughts
Stay calm, trade wisely, and let's capture the market's best opportunities!
This analysis reflects our opinions and is not financial advice.
Share your thoughts in the comments, and don’t forget to share this analysis with your friends! ❤️

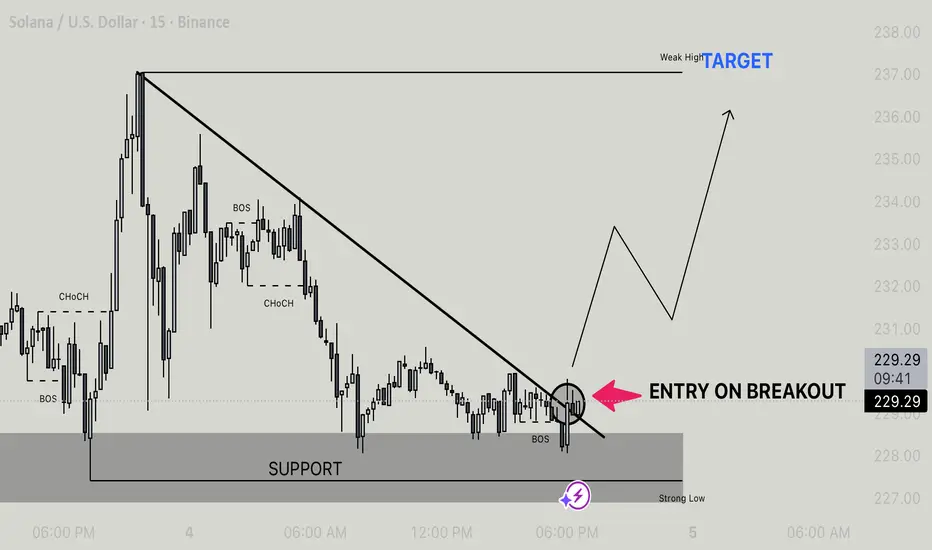
Sol/Usdt - Bullish Breakout Setup From Support Price has been consolidating around the support zone after a strong bearish move. We can observe multiple BOS (Break of Structure) and a clear descending trendline acting as resistance.
• Currently, price is testing the support zone and forming a potential trendline breakout setup.
• Entry confirmation will be on a clean breakout above the descending trendline (marked area).
• Once the breakout occurs, price is expected to retest and then push higher towards the weak high liquidity area, with the next target around 236–238.
Plan:
• Entry: On breakout + retest confirmation.
• Target: 236–238 (weak high).
• Invalidation: A strong break below the support zone would invalidate this bullish setup.
SOL: Ready for a Big MoveWe can see CRYPTOCAP:SOL is currently in a period of accumulation, just like it was back in 2021 before a massive rally . The key rising support line has been holding up strong, and after periods of accumulation, the price has consistently exploded upwards, reaching new highs.
Right now , the price is approaching its previous all-time high (ATH), and if history repeats itself, we could be in for another "boom" phase. The price is holding well above the key support, which strengthens the bullish outlook.
Keep an eye on the price action around the ATH level, if we break through, it could signal the next major leg up. This setup looks very similar to past accumulation phases that led to significant price jumps.
#PEACE
Stay tuned for more updates

SOLUSD sell at Market PriceHi everyone.
I think we can sell our Solana at this level.
I'll partial exit at first tp that I mentioned, and I think it will has potential to go lower.
Let's see what happens.
Good luck.
Dear traders, please support my ideas with your likes and comments to motivate me to publish more signals and analysis for you.
Best Regards
Navid Nazarian
