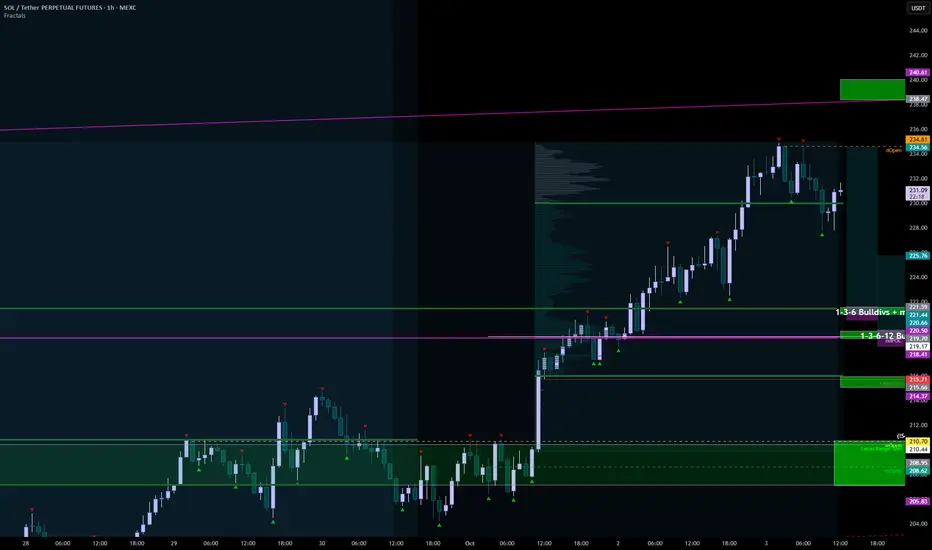
SOL 03.10At 3 AM (when else, only when we're sleeping) R1 reacted, with weakness in beardivs + mfd divs 1-3-6-12-24m, and corrected by 3%.
BUT
1) they left almost equivalent positions,
2) the daily session closed almost without a shadow above,
3) there are no diversifiers on the indicator, and there are fat mfds on mfd 1h and higher.
I think we'll go to 240, but there's a slight correction right now. At 240, it will be possible to part-take profit from the main long from 192. But how and when we'll get there is unclear. If Bitcoin starts to move into the 117-115 zones today within the console, Salt could even move from the current levels to the key support zone around 210, but for now, it needs to lose another 220 and 216 to do so.
Support zones:
221-221.5
219-219.6
215-215.9
207-210.7
Resistance zones:
238.4-240
255-256.4
Solusdt
BTC, ETH, SOL Support, Resistance, and Discovery Zones From HereHere's the 'heat map' for Bitcoin, ETH and Solana's prices from here.
Despite the big liquidation target zone and buy limit order concentration in the $106k zone in Green...
Price pushed higher the last few days as 'Uptober' took hold and the US Government shut down, effectively silencing any negative economic news releases.
Plus we can see that 2 more rate cuts are virtually guaranteed in October and December.
So, very likely that Bitcoin rallies to new ATH later in October into November.
However, I'm seeing sell block pressure just above on Bitcoin in the $121k - $124k range, and also on the TOTAL market cap.
What's interesting is that I'm not seeing any sell block pressure on TOTAL2 or TOTAL3, indicating that Alts are more likely to push higher from here, as BTC retraces.
What do you think?

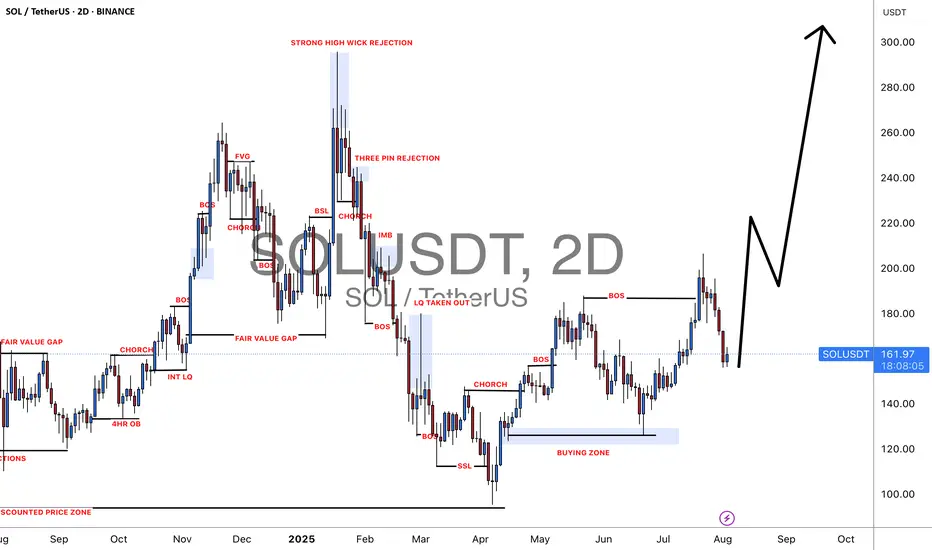
Solana Breaks $220 on ETF HypeSolana Breaks $220 on ETF Hype, Can the Momentum Sustained?
Solana has broken through the critical resistance at $220, fueled by growing excitement over a potential ETF. Price hit an intraday high of $226.7 as bullish sentiment takes hold. At press time, SOL is trading at $224.35
On the 2-day chart, we can say that the bullish momentum remains intact as the liquidity curve is being respected. The resistance that we need to break is $230, a break above $230 could pave the way toward $260-$270.
If we can establish the $200 as base support, buyers remain in control. However, a drop below $200 might stall the bullish momentum and a possible retest of $160.

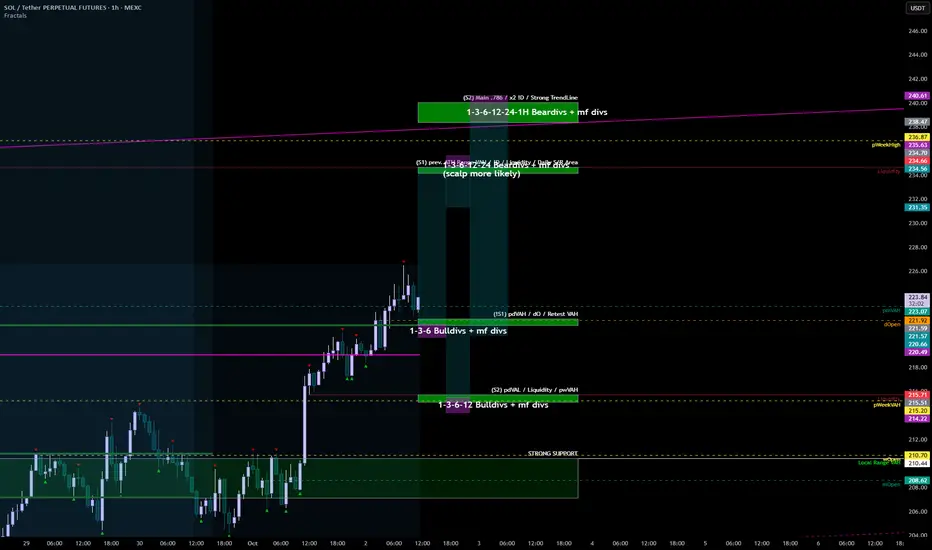
SOL 02.10#SOL
Easily broke out of the VAH local range since September 22. A possible retest of 221-222 could propel us further; I don't see any significant weakness on the indicator.
There are no serious resistances at all. The closest possible ones, from which we could react, are 235-240, 253-256, with liquidity at 273 and ATH.
Support zones:
221.5-222
215.1-215.7
207-210
Resistance zones:
207-210
234.2-234.7
238.4-240
Support near 222.61 is key
Hello, fellow traders!
Follow us to get the latest information quickly.
Have a great day!
-------------------------------------
(SOLUSDT 1D chart)
There are many lines drawn, but the important area is ultimately the 179.74-247.50 range.
Among these, a rise above 236.88-247.50 is necessary for a stepwise uptrend to continue.
The key is whether the current 202.45-222.61 range, i.e. the DOM (60) ~ HA-High range on the 1W chart, can provide support and allow for an upward movement.
Therefore, based on the 202.45-222.61 range, we need to monitor whether the price rises above 236.88-247.50 or falls below 179.74.
-
To break through this critical point or range and continue the uptrend,
- The StochRSI indicator must be trending upward. If possible, it should be below the overbought level.
- The On-By-Significant Volume indicator must be trending upward. If possible, it should remain above the High Line.
- The TC (Trend Check) indicator must be trending upward. If possible, it should remain above the 0 level.
-
Thank you for reading to the end.
I wish you successful trading.
--------------------------------------------------

$SOL for Long Monthly ChartThis target will complete in next 1000 Days. Long target for SOL.
Cup & Handle Pattern on Monthly.
Short term
target is 900$
Target 2 is 1200$
Let's go.

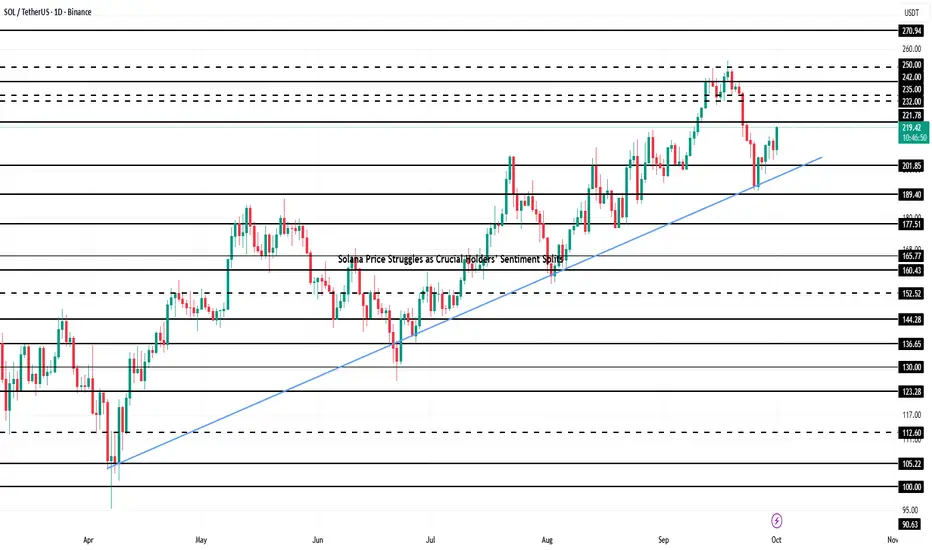
Solana Price Struggles as Crucial Holders’ Sentiment SplitsSolana is trading at $209, holding above the $206 support level and testing its uptrend line. The steady recovery underscores investor commitment to maintaining bullish momentum after brief interruptions caused by increased selling pressure from LTHs.
The mildly bullish outlook could extend Solana’s rally. If momentum holds, SOL could climb past $214 and $221 resistance levels. A push beyond those thresholds would open the path to $232, reinforcing optimism about further gains in the coming weeks.
However, if selling pressure from long-term holders intensifies, Solana risks slipping below $206. A drop to $200 would invalidate the bullish thesis, signaling weakness and potentially sparking renewed bearish sentiment in the altcoin’s market structure.
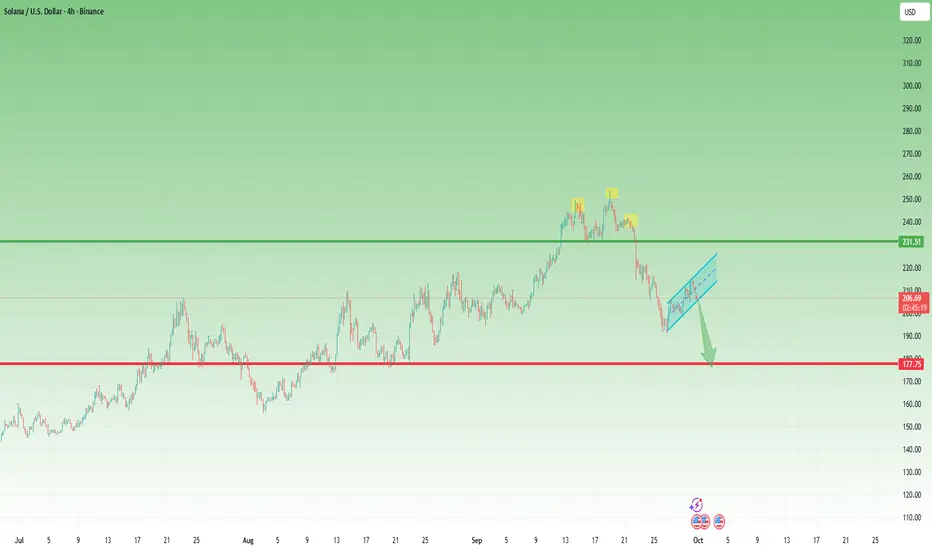
Solana: From 254 Highs Back to the 200 Line – What’s Next?At the end of August, I wrote that as long as 190 remained intact, Solana had room to rise toward 250, and I suggested a buy around the 200 level. That trade worked beautifully, with price reaching as high as 254.
From there, Solana started to roll over. At first, it looked like a normal correction, but the picture changed after a weak bounce attempt. Price broke decisively below 230, and the recent low was set right back at 190.
Currently, Solana is recovering once again. However, the structure of this bounce looks corrective in nature, forming what appears to be a bearish flag.
🔑 Key levels to watch:
• A break below the flag’s support – and more importantly below 200 – would likely trigger another leg down.
• In that case, the market could head toward a 175–180 major support zone, which is the next critical area for buyers to defend.
Until then, the bias remains cautious: Solana must prove it can break free from the corrective structure before bulls can regain control. 🚀

Weekly Crypto Market Review: BTC, ETH, SOL, XRP, BNB, HYPEReview of trend structures and my expectations for the coming weeks on Bitcoin and key altcoins.
The key local support zones highlighted in the previous market outlook did not hold against selling pressure, increasing the likelihood of a more prolonged consolidation across the crypto space.
As long as prices continue to close below their local resistance areas, the base scenario remains in favor of further correction toward macro support levels.
Below is a brief summary of important resistance, support zones and potential trend structures I am following:
BITSTAMP:BTCUSD
Chart:
Resistance: 112–114.5k
Support: 103.5–101–98k
BITSTAMP:ETHUSD
Chart:
Resistance: 4115–4215
Support: 3700–3430
BINANCE:BNBUSD
Chart:
Resistance: 1020–1040
Support: 900–870–840
BITSTAMP:XRPUSD
Chart:
Resistance: 2.87–2.99 / 3.07
Support: 2.55–2.40–2.32
PYTH:HYPEUSD
Chart:
Resistance: 49–50–53
Support: 35.5–29–23
COINBASE:SOLUSD
Chart:
Resistance: 213–219
Support: 177–169
Thank you for your attention, and I wish you a successful week ahead.

SOLUSDT 1D - Bulls back in control with Golden Cross and channelOn the daily chart, SOLUSDT is forming a bullish continuation structure. After the Golden Cross (MA50 crossing MA200), the price is now pulling back toward the midline of the ascending channel and the 0.5 Fibonacci level at 166.38. This confluence with the broken trendline and 200 EMA makes this zone a prime technical area of interest.
Support: 166.38 (0.5 Fibo), EMA200 (161.77), broken trendline
Resistance: 182.84–189.67 (Fibo 0.705–0.79), 206.54, target - 255.93 (Fibo 1.618)
This retracement looks healthy, supported by higher volume during the prior bullish leg. As long as the 166.38–161.77 zone holds, continuation toward 206.54 and potentially 255.93 is on the table.
Fundamentally, Solana remains a key L1 narrative with strong traction in DePIN and AI-linked dApps. The rising TVL and investor sentiment support the trend.
Watch price action around 166 for confirmation - this is the battleground.

SOL/USDT 1D chart review 1. General trend
• A strong upward trend has been underway since June (orange trend marked).
• Recently, we had a very strong rally to around USD 250, but there was a violent correction.
2. Support and resistance
• resistance:
• USD 214 (local resistance, the market has bounced down here).
• 230 USD (strong resistance).
• USD 250 (peak, main resistance).
• Support:
• USD 193 (here the price is currently fighting).
• 176 USD (another strong support - earlier consolidation).
• USD 158 (key support, fracture could mean a change in the trend).
3. STOCHASTIC RSI
• Currently in the sales zone (nearly 0) → may suggest that the market is approaching a local hole and a potential reflection.
4. Scenarios
• Bullish:
If support is supported at 193 USD, possible reflection in the direction of USD 214, and after breaking this level - an attack on USD 230.
• Bearish:
If the price pierces $ 193 down, the next goal is 176 USD, and below even USD 158.
5. Summary
• The market is in correction after strong height.
• At the moment, the key level is 193 USD. Maintaining this support can be reflected.
• However, breaking 193 will open the road to 176.
• RSI shows the sale → short -term relief.

Solana coin up another 60% Whats next In this video I recap our previous video calling for a pullback into $150 with a target of $240 which has now been fulfilled .
The question is whats next from $240, we are top heavy and despite market structure still bullish I anticipate a move up to fill the single prints at $245/250 before a healthy pull back into $200 zone .
I also recap Bitcoin and the ETH /BTC pair
Take the trades level by level and plan ahead . Enjoy

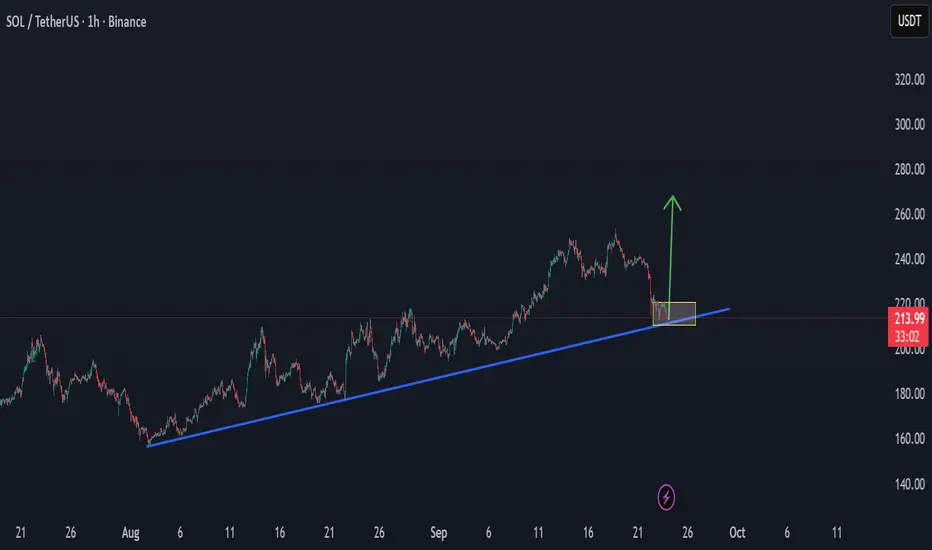
SOLUSDT: Strong Uptrend with Solid SupportSOLUSDT is currently showing a strong upward trend thanks to the stability of the cryptocurrency market and a positive risk sentiment from investors. The Solana (SOL) token is receiving significant support from fundamental factors, such as a stable commodities market and the pressure on the US dollar due to the Federal Reserve's interest rate cuts.
From a technical perspective, SOLUSDT is testing the important support level at $199.00. If this level holds, the likelihood of a rebound and continuation of the uptrend is very high. The next resistance level is expected to be at $218.00, and if this level is breached, the price could continue towards $230.00.
The upward trend line remains intact, providing positive signals for the next move. Based on both fundamental and technical factors, SOLUSDT is likely to maintain its upward momentum if the support at $199.00 holds.

Solana$It seems that Solana has reached its price peak, and I’m expecting a correction.
Of course, the price may decline gradually in stages

SOLUSDT Strong Rejection at Key Support – 230.00 Incoming!Hey everyone, Ken here!
SOLUSDT has been quite interesting lately. After a sharp decline from the channel’s top, the price broke through the support zone, often referred to as the neckline, and reached a key support area below. Here, we saw a strong rejection wick, which clearly indicates that buyers have stepped in and are ready to take control of the market.
With this setup, I predict that the 230.00 level will be a reasonable target in the short term. The strong rejection at this support zone suggests a high potential for a reversal.
Feel free to leave a comment if you agree with this prediction, or if you have a different perspective. Let’s discuss and share our ideas!

Warning - Bitcoin bullish trend is over
Over the past 15 years, the cryptocurrency market has repeatedly witnessed exponential price surges in Bitcoin followed by altcoins—movements that sparked excitement and drew massive amounts of liquidity into the space.
However, the cycle that began in 2024 and will end in about 20 days has failed to meet the expectations of market participants. This time, altcoins were no longer able to attract capital as they once did, and more than 70% of enthusiasts have permanently turned away from the space. A significant part of this downturn stems from the actions and policies of major exchanges such as Binance, FTX, and others.
Altcoins have not only failed to gain value compared to Bitcoin’s 2023 prices but have also suffered sharp declines, with their downward trend still ongoing. Even Ethereum was unable to surpass its historic peak from 2021.
The market is now entering a dangerous slope for Bitcoin price depreciation, where predictions suggest that altcoins like **Dogecoin** could fall to $0.05, **Ethereum** to $1,100, **Solana** to $80, and **Toncoin** to $0.60.
This can be regarded as the worst experience in crypto history—not only for investors who will lose substantial portions of their capital but also for exchanges themselves, which, despite short‑term gains, will ultimately rank among the long‑term losers. Following this, the rate of new user acquisition in crypto will likely drop to one‑tenth of previous years, leaving the industry widely viewed as a **major scam** in the eyes of the public.

Solana Eyes 14% Upside, Approaching $275 Breakout Target SoonHello✌️
Let’s analyze Solana’s price action both technically and fundamentally 📈.
🔍Fundamental analysis:
The SIMD-0326 upgrade could cut Solana’s block finality to just 150ms, possibly bringing big traders and fresh capital. But new validator fees might be tough on smaller player
📊Technical analysis:
SOL is trading within a strong ascending channel, nearing a breakout above the upper boundary, which could propel price toward $275 with at least 14% upside. 📈🚀
✨We put love into every post!
Your support inspires us 💛 Drop a comment we’d love to hear from you! Thanks , Mad Whale

SOL/USDT (4H chart) Bearish Bias🔎 Technical Outlook
• Trend: After a strong rally toward $250, Solana has started forming lower highs and lower lows, a clear sign of weakening momentum.
• Resistance Zone: Price faced rejection near $237 – $240, which aligns with a previous supply zone. This has turned into a ceiling for the market.
• Support Levels: Current price is hovering around $222, but if sellers maintain control, the next strong demand zone lies near $200 — also your marked target.
• Candlestick Behavior: The recent sharp decline shows strong bearish pressure, and recovery attempts have been weak, signaling more downside potential.
________________________________________
📉 Trade Setup (Bearish)
• Entry Zone: $222 – $223 (current area)
• Stop-Loss: $238 (above resistance and last swing high)
• Take Profit 1: $210 (interim support)
• Take Profit 2: $200 (major support)
• Risk/Reward: ~1:2 (attractive setup)
________________________________________
🛡 Risk Management
• 📉 Partial Profits: Secure partial gains at $210 before targeting $200.
• 🔒 Trailing Stop: Once $210 is hit, move SL to breakeven ($222) and trail down to lock profits.
• 🚫 Invalidation: A sustained break above $240 would cancel the bearish outlook and could push SOL back to $250+.
________________________________________
✅ Summary
Solana looks weak after repeated rejections at $237 – $240, and bears are in control. If sellers maintain momentum, a drop toward $210 and $200 is likely. The setup favors shorting rallies with a tight stop-loss above resistance.
________________________________________

Will Solana Break Above 250 After Its Pause?The Solana (SOLUSDT) market is entering an exciting phase, with price repeatedly testing key levels and forming a dramatic sideways range. After a strong rally, SOL is now consolidating within the 230–245 zone , where support and resistance are battling fiercely.
If the 230 level holds , it could serve as a launchpad for a move toward 242 (TP1) and potentially 250 (TP2) . Positive developments, such as major institutions accumulating SOL and the surge of stablecoin inflows on the network, continue to strengthen the long-term bullish outlook .
However, risks remain if SOL loses the 230 mark and breaks the trendline, which could trigger deeper corrections. In the short term, the market remains sideways, but the broader picture still points toward a potential breakout.
The big question: can SOL sustain its momentum and explode beyond 250, opening the door to a new rally?

Solana - The sleeping giant waking up!🔦Solana ( CRYPTO:SOLUSD ) will still head higher:
🔎Analysis summary:
Yes, over the past four years, Solana has overall been just consolidating. But eventually, Solana will catch up with the entire crypto market and create a new all time high. Specifically with bulls picking up momentum lately, it becomes more and more likely that Solana will do exactly that.
📝Levels to watch:
$250
SwingTraderPhil
SwingTrading.Simplified. | Investing.Simplified. | #LONGTERMVISION

SOLANA can hold the cycle trend to up $250Solana is now at an important level of trend, and can hold in the coming time the cycle key level for a new power trend increase to up $250 in the coming time.
On the low time frame $220 can be the next target, when BTC has a stability trend or an increase trend.
#SOLUSDT: A Big Move In Making Crypto Market Is BullishCrypto market remain bullish and as for the SOLANA we remain quite optimistic; currently price is trading at critical level and waiting for liquidity to emerge. We need strong volume for big price movement. Follow a strict risk management while trading crypto market.
Good luck and trade safe.
Team Setupsfx