Solana (SOL) — 1H: Bearish Structure Remains in FocusOn the 1-hour chart, Solana may appear to be forming a reversal after an extended decline. However, the current structure does not yet support this view.
Price action remains weak, with downside risk still present. A move toward the 125-125,5 area could allow for short-term consolidation, followed by a rotation into the 116–118 zone.
From there, continuation toward 108 remains a level to monitor.
This scenario would change if price reaches the 127 level.
Solusdtanalysis

Coinranger|SOLUSDT. Continuing decline to 114🔥News
🔹No important news today. Only an old data on american market will be released, which is usually considered preliminary.
🔥SOL
🔹Fell to the lowest level from the last forecast.
1️⃣ Above: 125 potential pullback level.
2️⃣ Below: 118.5, 114, 110 - different levels of a downward wave sequence. 114 is the most likely for now.
Likely a continuation of the decline without news. Кeep watching BTC and ETH.
---------------
Share your thoughts in the comments!

Coinranger|SOLUSDT. Potential reversal to 135🔥News
🔹The International Economic Forum continues. US GDP is at 16:30 (UTC+3). US PCE data for November and October will be released at 18:00 (UTC+3) – this is still important due to possible recalculations for later months.
🔥SOL
🔹Time to update the Solana chart:
1️⃣A potential set of upward wave markers has appeared above: 133, 135, 138.
2️⃣Below, 124 and 122 remain significant levels. They could still play out during a potential flat phase.
For now, the priority is a continued upward pullback. There is also a possibility of a flat at 131 - 124, but not yet.
-------------------
Share your opinion in the comments

Coinranger|SOLUSDT. Pullback to 140 and further goes down🔥News
🔹The International Economic Forum in Davos begins today and will continue all week. America is closed for M. Luther King Day. No other significant news.
🔥SOL
🔹The full set of downward waves has been completed. Now we can recalculate the levels. They are as follows:
1️⃣ The price has reached all extensions, so the pullback could be quite large. The main levels are 136 and 140. That is for the aims above the current price.
2️⃣ Below there is 126 as the first wave in the next set of downward waves. 121 is an intermediate level between the potential end of the new set and its first extension.
For now, the pullback is the priority. A decline is likely to follow.
-------------------
Share your thoughts in the comments.

Coinranger|SOLUSDT. Pullback to 137 before continued growth🔥News
🔹Today at 16:30 (UTC+3) will issue the US PPI data for December, and most likely for October at the same time. Plus retail sales at the same time.
🔥SOL
🔹We've reached the second extension on h1 - 147:
1️⃣Above: 153 and 155 – the first part of a new set of upward waves.
2️⃣Below: 142, 137, and 133 (preliminary calculated levels of the set of downward waves)
We're keeping an eye on the news, BTC , and ETH . Ideally, we should see a slight pullback before continuing the rise. Minimum to 142. Ideally, to 137.

SOLANA — Absorption at HTF Resistance | Downside Risk IncreasingTraders,
CRYPTOCAP:SOL pushed into resistance and stalled. Not aggressively. Not weakly either.
What we are seeing now is absorption, and the market is quietly deciding what to do next.
The question is not “bullish or bearish.”
The question is where the real decision gets made.
Right now, the chart gives us a very clean structure.
1. What happened
SOL rallied back into a higher-timeframe resistance zone around $142–145.
This area is important because:
It previously acted as distribution
It aligns with a harmonic exhaustion level
Liquidity is clearly resting above
Price did not reject immediately.
Instead, it slowed down.
That already tells us something.
2. What price is doing now
On the 1H, price is pushing higher in small steps:
Push
Pause
Shallow pullback
Push again
Each high looks constructive, but none are being accepted cleanly.
This is not breakout behavior.
This is price being worked inside supply.
Liquidity above is visible.
Yet price hesitates just below it.
3. Momentum in strength, not divergence
RSI is not aggressively diverging here.
Instead:
RSI stays elevated
Each push higher produces less expansion
Momentum rolls over inside strength
That usually means effort is being absorbed, not rewarded.
When momentum stalls at resistance without breaking down, it often reflects absorption inside strength, not weakness.
4. Spot flow tells the real story
Spot CVD continues to rise.
On both the 1H and the 4H, spot CVD is making clear higher highs. Buyers are not hesitating. Market orders keep hitting the ask, and spot demand is persistent across timeframes.
On the surface, that looks bullish.
But price is not responding.
Despite spot CVD printing higher highs, price remains capped beneath resistance and fails to gain acceptance. Each attempt higher is absorbed rather than extended.
That mismatch matters.
When spot demand increases across multiple timeframes and price fails to move, it usually means one thing:
Supply is sitting above the market
Sellers are passive and patient
Buyers are doing all the work
This is classic absorption behavior.
The important detail here is that this is not a single-timeframe signal. The fact that spot CVD is making higher highs on both the 1H and 4H strengthens the read. Real buyers are present, but they are being met by consistent supply.
That is not how breakouts start.
That is how distribution hides.
5. Futures are not confirming
While spot keeps buying:
Stablecoin-margined futures CVD trends lower
Perp traders are selling into strength
Leverage is not chasing this move
Coin-margined futures remain net negative, suggesting longer-horizon participants are still distributing.
Different groups, same message: less appetite for higher prices here.
6. Open interest adds tension
Open interest remains elevated.
Price is not expanding, yet positions are being added.
That creates pressure.
Crowded markets don’t drift.
They eventually move, and usually fast.
7. The higher-timeframe context
On the daily, accumulation and distribution remains pointed lower.
Rallies continue to be used to offload supply.
This move fits that pattern.
Push into resistance.
Effort from buyers.
No acceptance.
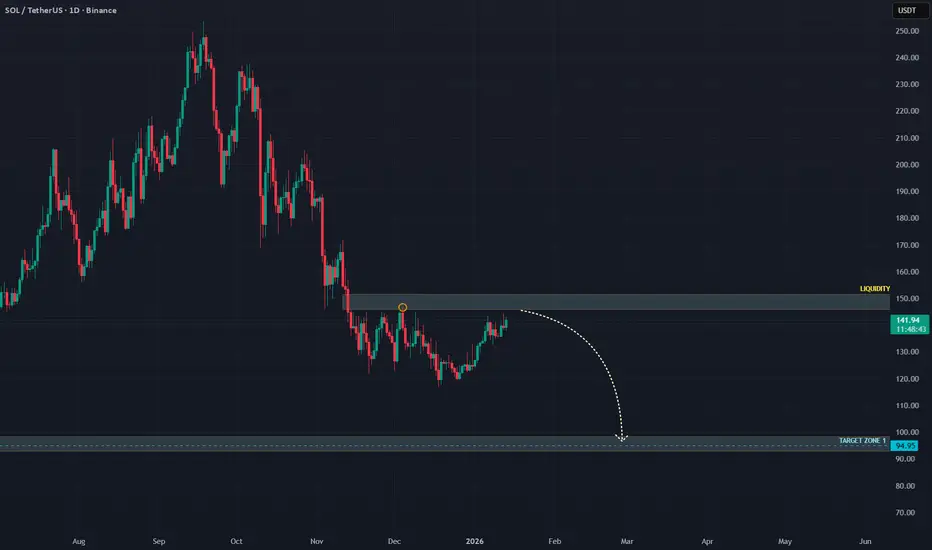
8. The decision zone
The area around $142–145 is the key checkpoint.
This is where supply has been active before, and it is where the market has to prove it can do more than just absorb.
If price:
Pushes slightly higher
Sweeps the liquidity sitting in the blue box
But fails to hold or shows weakening spot follow-through
Then this area becomes a distribution and take-profit zone, not a breakout.
A sweep without acceptance is often the final act before rotation.
If sellers remain patient here, downside opens quickly.
9. Downside focus
Below the current range, the structure is thin.
There is unfinished business lower, and price has not spent enough time there to build support.
Target zone: $94–100
This area stands out because:
It previously acted as acceptance
Liquidity is concentrated there
It represents a clean mean reversion for the entire move
If price starts to roll from the current region, this zone becomes the primary magnet.
Moves like this rarely stop halfway.
10. How to read it in real time
A push into the blue box followed by stalling price and slowing spot CVD → distribution
Spot CVD still rising but price failing to hold → absorption, not strength
Spot CVD rolling over at highs → rotation starting
The market does not need to break down immediately.
It only needs to stop rewarding buyers.
When that happens, the path lower opens fast.
------------------------------------------
The market is leaning into supply.
It may take one more push into liquidity before the real move starts, but the risk remains skewed lower as long as buyers are not being rewarded.
Let price do the talking.
If this analysis helped you see the structure more clearly, a like is always appreciated.
Feel free to share your thoughts or alternative scenarios in the comments.
Thanks for reading.
#SOL/USDT IS AT DECISIVE POINT! WHO WILL WIN? BULLS OR BEARS?SOL/USDT – Daily Outlook
SOL is attempting a trend shift after forming a higher low near the lower boundary of the descending channel. Price has bounced with strength and is now trading above the short-term moving averages.
The 13 EMA (green) is leading the move and has crossed above the 21 EMA (blue), which typically signals improving momentum and short-term trend reversal. As long as price holds above these EMAs, bulls remain in control.
🔑 Major Resistance Zone:
$155–158 → a strong resistance cluster formed by prior support-turned-resistance and EMA congestion.
📈 Bullish Scenario:
A daily close above $158 would confirm a breakout and trend continuation, opening the path toward $175–180, followed by $ 190 or higher if momentum sustains.
⚠️ Risk / Invalidation:
Rejection from $155–158 may lead to short-term consolidation or a pullback toward $133 to 127.
Overall, the structure is constructive, momentum is improving, and $158 remains the key trigger level for the next leg higher.
If you like this chart, do hit the like button and share your views in the comments.
Thank you
#PEACE

Coinranger|SOLUSDT. Big potential reversal from 141News at 16:15 PM and 18:00 UTC+3 could add volatility.
🔹Solana has reached exactly the first extension at 141 on h4. And this is a serious point for a potential reversal.
1️⃣I'll leave 141 above as a reminder of micro rally.
2️⃣ A set of downward waves with potential extensions: 131, 130, 125, 120.
We'll likely move to 130 today or tomorrow.

SOLANA OBAMA - pamp itSOLANA OBAMA - pamp it
levels to watch for in case we are just being bull trapped
basically ; if the price action ledges out here and then pukes ,, well ya know whats up and wait for red fractal tripple bottom to try to buy again with tight stop. but those two negative options suck pretty bad, would be a multi year bear again. just accumulate btc if thats the case as we've seen the obvious change in the ALT market.
or
valhalla awaits us. and the whole 'alt season is dead' trap was sprung very well.
this cycle has been hard. gl

Solana (SOL) — 15m Local Bullish StructureHello, friends!
How did you celebrate the New Year? 🎉
I wish everyone a productive and profitable 2026!
I haven’t posted ideas on TradingView for a few weeks, but I’ve decided that starting from the very first day of 2026, I’ll be sharing ideas daily.
So here is my first one:
Despite my previous bearish outlook, Solana looks quite positive on the local timeframe right now 🐂
After a small pullback to the 124.76 area, I’m considering long positions.
🎯 Targets:
• 127.5
• 130
❌ Invalidation:
Any touch of 124.69 fully invalidates this setup.
As always, manage your risk and stay tuned for updates. 🚀

SOL/USDT – Accumulation or Continuation? Key Support!SOL/USDT on the 8-hour timeframe is still moving within a bearish corrective structure / broader downtrend, characterized by a series of lower highs and lower lows since the rejection from the 230+ area.
Currently, price is trading inside a strong historical demand zone at 127–121, which previously acted as a major accumulation and bounce area.
Price is now consolidating above this demand zone while pressing against a descending trendline, making this area a critical decision zone for the next major move.
---
Pattern & Price Structure
1. Descending Trendline (Bearish Pressure)
The descending trendline remains valid and unbroken
Each recovery move continues to be capped by this trendline
Indicates seller dominance is still present
2. Demand Zone / Support Base (127 – 121)
The yellow box marks a strong demand zone
Multiple lower-wick rejections indicate active buying interest
Price is forming a base / consolidation range above support
3. Compression Pattern (Range Tightening)
Price is compressed between:
Dynamic resistance (descending trendline)
Static support (demand zone)
This structure often leads to a high-momentum breakout
---
Key Levels
Dynamic Resistance: Descending trendline
Horizontal Resistances:
144
154.5
167
177
Major Support:
127
121
Invalidation Level:
Strong close below 121
---
Bullish Scenario
The bullish scenario is valid if:
1. Price holds above the 127–121 demand zone
2. A strong candle close breaks above the descending trendline
3. Volume expansion confirms the breakout
Upside Targets:
144 (minor resistance)
154.5 (key reaction level)
167 (mid-range resistance)
177 (major resistance)
A confirmed breakout above the trendline may signal a trend reversal or bullish continuation from a base structure.
---
Bearish Scenario
The bearish scenario occurs if:
1. Price fails to break the descending trendline
2. A strong breakdown and close below 121
3. The demand zone fails to absorb selling pressure
Downside Risk:
116.8 (previous low)
Further downside could form new lower lows, continuing the broader bearish trend
---
Conclusion
SOL/USDT is currently at a critical decision area.
The 127–121 demand zone is the key level to watch:
Holding support + trendline breakout → bullish reversal potential
Demand breakdown → bearish continuation
Patience is required. Wait for clear breakout or breakdown confirmation before committing to a directional trade.
---
#SOLUSDT #Solana #CryptoAnalysis #TechnicalAnalysis #DescendingTrendline #DemandZone #SupportResistance #AltcoinTrading #CryptoMarket

SOLUSDT Bullish Trade Idea on 4hr TFSOLUSDT Bullish Trade Idea on 4hr TF
- Bullish Divergence
- Falling Wedge broken
- Alligator opening mouth towards upside
Simple 1:3RR Trade. Let's see

SOL at a Critical Decision Zone – Double Bottom vs ResistanceHi!
Market Context
Solana is trading near a key decision zone after a corrective move from recent highs. Price action suggests short-term bullish attempts, but the broader structure remains mixed.
Technical Structure
Broken Trendline: The descending trendline from the recent high has been broken, indicating a short-term momentum shift.
Double Bottom Formation: A clear double bottom has formed near the $121–$122 area, showing strong buyer reaction and short-term demand.
Support Zone: The horizontal support around $120 remains critical. This level has been tested multiple times and is still holding.
Resistance & Scenarios
Bullish Scenario: If price holds above $120 and continues higher, a move toward the $125–$126 supply zone is likely. This area previously acted as resistance and may trigger selling pressure.
Bearish Scenario: Failure to sustain above current levels, followed by a breakdown below $120, would invalidate the double bottom and open the door for a deeper correction.
Conclusion
While short-term bullish signs are present, confirmation requires continuation above resistance. Until then, SOL remains in a sensitive zone where both scenarios are possible. Risk management is essential around these levels.

SOL/USDT – Major Support Zone the Key to Bullish Continuation?SOL/USDT on the weekly timeframe (1W) remains in a long-term bullish market structure, despite the current corrective phase. The rejection from the major resistance area around 240 – 250 USDT has triggered a healthy pullback. As long as the key support zone holds, the broader uptrend structure remains valid.
This correction is best interpreted as a reset phase, not a trend reversal.
---
Market Structure & Price Action
From a structural perspective, SOL continues to print:
Higher Highs and Higher Lows (macro bullish structure)
Signs of distribution near major resistance
A controlled pullback toward a high-probability demand zone
Identified Price Pattern
Range Distribution → Minor Breakdown → Deep Retracement
Bullish continuation setup while holding demand
The yellow zone 94 – 78 USDT represents:
Previous weekly resistance turned support
Strong institutional demand zone
A key reaction area from the last major impulsive move
---
Key Technical Levels
Major Resistance:
240 – 250 USDT
Intermediate Support / Reaction Zone:
120 – 130 USDT
Key Support (Yellow Zone):
94 – 78 USDT
Bullish Invalidation Level:
A strong weekly close below 78 USDT
---
Bullish Scenario
If price:
Holds the 94 – 78 USDT zone
Forms bullish weekly confirmation (long lower wick, bullish engulfing, strong close above support)
Potential upside path:
1. Bounce toward 125 – 140 USDT
2. Continuation to 180 – 200 USDT
3. Retest of 240 – 250 USDT
4. A confirmed breakout opens the door for new all-time highs
Bullish Conclusion:
The yellow zone acts as a high-confidence buy-the-dip area on the weekly structure, as long as it remains intact.
---
Bearish Scenario
If price:
Closes decisively below 78 USDT on the weekly timeframe
Fails to reclaim the key support zone
Then the risk shifts to:
1. Breakdown of the macro bullish structure
2. Decline toward 60 – 55 USDT
3. Extension toward 40 – 30 USDT (historical support region)
Bearish Conclusion:
A confirmed weekly breakdown below 78 USDT signals a long-term trend reversal, not just a correction.
---
Final Conclusion
SOL remains structurally bullish on the higher timeframe, and the current pullback is still considered healthy and technical.
The 94 – 78 USDT zone is the decisive level that will determine the next major move:
Hold → bullish continuation
Break → macro trend shift
Patience and weekly candle confirmation are crucial.
---
#SOLUSDT #Solana #CryptoAnalysis #WeeklyChart #KeySupport #DemandZone #BullishStructure #AltcoinMarket #PriceAction #MarketStructure

SOLUSDT – Long Trade Setup and Analysis | 4H)SOLUSDT – Long Trade Setup and Analysis | 4H)
SOL is currently trading within a high-probability demand zone (123–121) that has been tested multiple times. Price compression at this base suggests that sellers are exhausted, and an upward reaction is likely.
Trade Plan
Entry Zone: 123 – 121
Stop-Loss: Below 121 (Daily close preferred)
Targets:
T1: 132 – 135
T2: 140 – 145 (Major resistance and range high)
Technical Analysis
Strong Horizontal Support: Multiple reactions confirm that buyers are active.
RSI ~35: Near oversold territory → increases the probability of a bounce.
Liquidity Sweep: Wick reversal below support indicates a stop-hunt before the reversal.
Structure: Downside momentum is slowing; base formation is visible.
DYOR | NFA.

SOL in Downtrend: Crypto Winter Hits HardFinally, Solana has broken out of its stagnation.
For a long time, the chart has been building a consolidation in the form of a three-wave WXY correction.
Right now, wave Y is wrapping up. I believe this wave could play out in two scenarios:
🔻• Solana drops from current levels to around 116-118;
🔻• or we see it much lower, in the 108 area.
I’m leaning more toward the second option because the consolidation has been quite prolonged. Plus, as I mentioned earlier, I think we’ve entered a downtrend. Crypto winter has already kicked off and is in full swing.
❌ The invalidation level for my bearish plan is 131.8 — any touch, even briefly, would cancel this scenario.
⚠️Be cautious: don’t trade without stop-losses, and avoid trying to catch the bottom, or you might end up with an unwanted “gift.”
🚀Drop reactions and comments if you want me to post daily updates on Solana.

SOL/USDT Update — Bullish Trend Structure and Resistance Ahead“🚨 Solana vs Tether: Bullish Heist on SOL/USDT 💰”
📊 Description
Market: SOL/USDT
Bias: Bullish (Swing / Day Trade)
✅ Trade Plan
Entry: 🎯 Any good support / demand area — stay alert & flexible.
Stop Loss: 🛡️ “Thief SL” @ 160.00 USDT — this is my SL, not yours. Manage your own risk!
Targets (TP):
• 🎯 Target 1: 215.00 USDT
• 🏁 Target 2: 240.00 USDT
⚠️ Heads up: Use your discretion. Do not blindly follow my SL/TP — trade responsibly, at your own risk.
🔍 Key Insights / Logic
🚧 Expect resistance & traps near 215–240 — don’t get stuck in overbought zones.
📈 Momentum is building; structure is favorable on retests.
🔊 Watch volume on impulsive moves — rising volume = strength.
🔄 Related pairs / correlation watch:
• BINANCE:SOLBTC — strength vs BTC strengthens the bullish case.
• BINANCE:ETHUSDT — altcoin momentum may carry SOL upward.
• BINANCE:BNBUSDT — BNB strength can support ecosystem flow.
✨ “If you find value in my analysis, a 👍 and 🚀 boost is much appreciated — it helps me share more setups with the community!”
#SOL #SOLUSDT #Solana #CryptoSwing #CryptoDayTrade #AltcoinAnalysis #TradingViewIdeas #CryptoFun

SOL/USDT : SIGNALHello friends
Given the decline we had and the strength of the sellers, the price has reached the support areas we identified and has been well supported by the buyers in this area and has managed to hit higher lows.
The price is now in an important support area, and if buyers show support from this area, the price could grow and move to the specified targets.
Please note that this analysis is purely technical and does not constitute a buy or sell offer, so do not act emotionally and observe capital management.
*Trade safely with us*

SOL : LIVE TRADEHello friends
as you can see, after the resistance we set was broken, the price has grown well, and now with this red shadow, there is a sign of sellers entering, and there is a possibility of price correction, and the price can grow again from these areas and move to our targets, of course, if buyers support the support area again...
This analysis is purely from a technical perspective and is not a buy or sell recommendation, so please follow risk and capital management.
*Trade safely with us*

SOL at a Major Turning Point — Big Move Ahead#SOL
SOL is sitting right on its major weekly support, a zone that has held the chart together multiple times. This area is still acting as the main foundation for the current structure 🧱
If SOL can bounce from here and push back into the resistance zone above, the chart opens the door for a larger continuation toward the upper distribution area 🚀
We can already see how clean the structure becomes once price reclaims that mid-zone.
But if this major support fails to hold, SOL could slide into the deeper accumulation zone — a long-term area where strong buyers usually step in 👀
Right now, SOL is at a critical point. How it reacts here will shape the next big weekly move. Stay patient and follow the reaction, not the prediction ⚡
#SOLUSDT

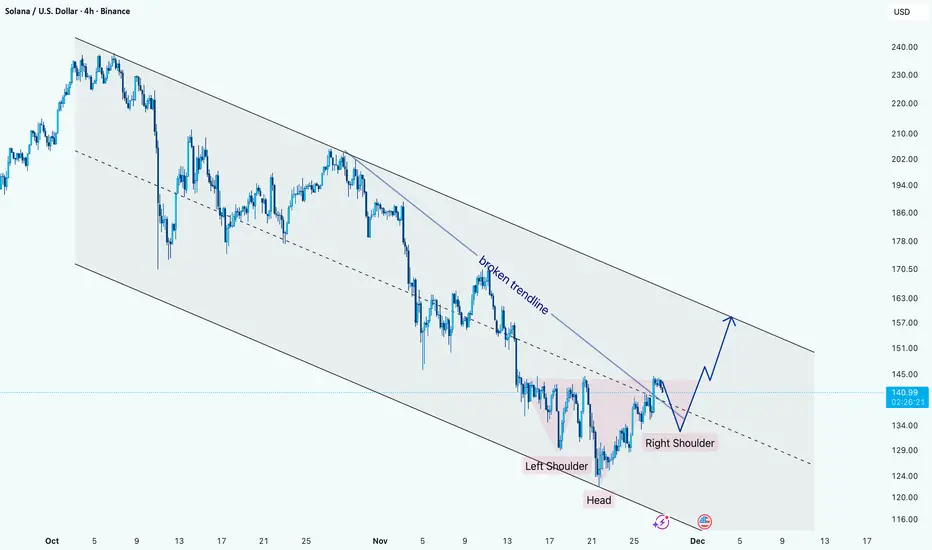
SOLUSD: Breakout from Bottom Structure Inside Downtrend ChannelHi!
SOL has been trading inside a descending channel, consistently respecting both upper and lower boundaries. Recently, price formed a clear Inverse Head & Shoulders at the bottom of the channel, signaling potential bullish reversal momentum. The neckline breakout aligns with the break of the minor descending trendline, strengthening the shift in structure.
If price holds above the neckline, the pattern projects a move toward the 160–165 USD zone, which also aligns with the channel’s upper boundary, a strong confluence area and natural target for bulls.
However, failure to sustain above the neckline could lead to a pullback toward the right-shoulder region, though the setup remains valid as long as price stays above the head level.
Overall, SOL is showing a bullish reversal signal, with upside continuation favored while above the breakout zone.

Solana: Is the Bottom In, or More Downside Ahead? SOL has already climbed more than 15% from last Friday’s low at its peak, potentially signaling the completion of wave ii in orange. For now, however, we’re still keeping open the possibility that this move could dip to a new low—within our green Target Zone ($155.80–$113.20). In any case, once this interim correction wraps up, wave iii in orange should kick off an impulsive rally, only losing steam above resistance at $295.31.

SOL Reversal Structure Forming Inside Downtrend ChannelHi!
Solana is trading inside a well-defined descending channel, but momentum is shifting. Price has broken the inner descending trendline and is now forming a clear inverse Head & Shoulders at the bottom of the structure.
The neckline zone has been tested multiple times, showing growing buyer strength. As long as price holds above the right-shoulder support, the structure favors a bullish continuation.
A breakout above the neckline opens the way toward the upper boundary of the main descending channel, with the next key reaction zone near $155–160. Failure to hold the right shoulder would delay the reversal and pull the price back toward mid-channel support.