SOLUSDT Bullish Trade Idea on 4hr TFSOLUSDT Bullish Trade Idea on 4hr TF
- Bullish Divergence
- Falling Wedge broken
- Alligator opening mouth towards upside
Simple 1:3RR Trade. Let's see
Solusdtidea

Solana (SOL) — 1H: Bearish Structure Remains in FocusOn the 1-hour chart, Solana may appear to be forming a reversal after an extended decline. However, the current structure does not yet support this view.
Price action remains weak, with downside risk still present. A move toward the 125-125,5 area could allow for short-term consolidation, followed by a rotation into the 116–118 zone.
From there, continuation toward 108 remains a level to monitor.
This scenario would change if price reaches the 127 level.

Solana question: $160 or $95?Boost this post if you believe $160 will be HIT sooner than $95
Reply "No" if you believe $95 will be HIT before $160
Let's find out what people think!

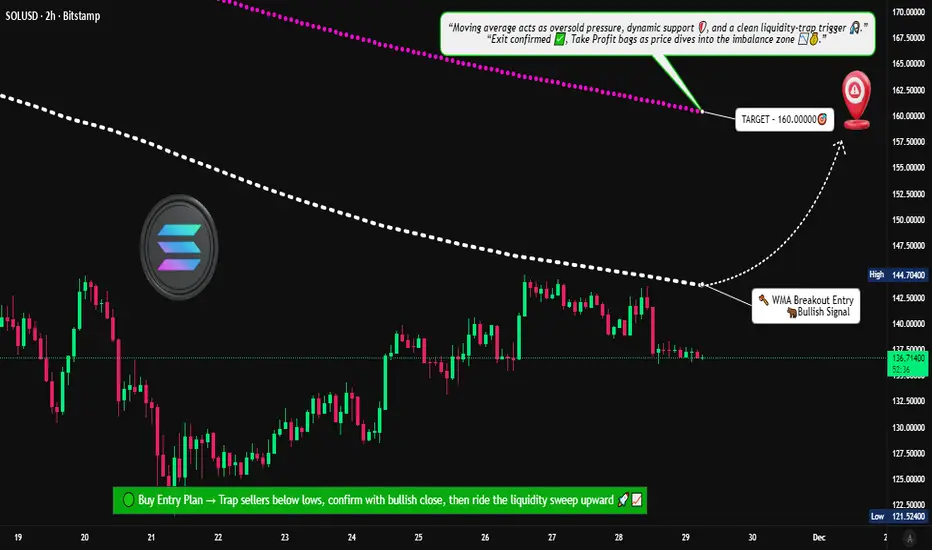
Is Solana Preparing for a New Upside Wave After WMA Breakout?📊 SOL/USD – “SOLANA VS U.S Dollar” Crypto Market Opportunity Blueprint (Swing Trade)
🟢 Trade Plan Overview
The bullish structure is confirmed after Weighted Moving Average (WMA) dynamic support breakout, signalling fresh momentum entering the market. This setup favors continuation as long as SOL holds above the breakout zone.
📌 Entry Zone
➡️ Entry: Any price level after the WMA breakout above 145.00000
The breakout + retest combination is your strongest confirmation. Let the chart validate the move—no rush entries.
🛡️ Stop Loss (Risk Protection)
➡️ Suggested SL: 132.50000
Dear Ladies & Gentlemen (Thief OG’s):
Use this SL only as a reference. Adjust based on your personal execution style, risk tolerance, and position size.
Place SL only after breakout confirmation — not before.
🎯 Profit Target
➡️ Target: 160.00000
Weighted moving averages are acting as dynamic resistance, and indicators show signs of potential overbought traps, so secure profits early instead of overstaying.
Dear Ladies & Gentlemen (Thief OG’s):
TP is your own choice. Lock in profits based on your comfort, not just my blueprint.
📚 Market Reasoning
WMA breakout shows renewed bullish strength.
Structure support aligned with higher-timeframe trend.
Volume expansion confirms buyers stepping in.
Resistance cluster around 160 remains the key zone to offload profits.
🔎 Related Pairs to Watch (Correlation & Key Notes)
💠 BITSTAMP:BTCUSD (Bitcoin)
High correlation with total crypto liquidity.
Strong BTC breakouts often pull SOL upward because altcoins follow BTC’s macro flow.
If BTC loses trend support, SOL setups weaken.
💠 BITSTAMP:ETHUSD (Ethereum)
ETH and SOL share similar Layer-1 ecosystem flows.
When ETH rallies aggressively, funds rotate into strong alts like SOL.
Good to use as a sentiment confirmation tool.
💠 COINBASE:ADAUSD (Cardano)
Another L1 competitor; correlated during broad alt-season pushes.
When ADA moves, retail interest usually spreads across L1s — including SOL.
💠 COINBASE:AVAXUSD (Avalanche)
Solana + Avalanche often move together during risk-on bursts.
AVAX momentum adds conviction to SOL’s breakout reliability.
💠 BINANCE:SOLBTC
The most important relative strength pair for SOL.
If SOLBTC is trending upward, SOL outperforms majors — huge confirmation signal for swing trades.
📈 Final Thoughts
This trade plan balances momentum, trend structure, and dynamic WMA confirmation. Follow the breakout logic, respect your risk, and let the chart guide your exits. The idea is designed to help traders act with clarity, control, and professional-level precision.
SOLU/USD Buy Trade Scenario.Here’s an up-to-date SOLU/USD Buy trade outlook (technical + fundamental) to help you assess whether positioning for a Upside makes sense right now.
Thank You......
SOL/USDT – Accumulation or Continuation? Key Support!SOL/USDT on the 8-hour timeframe is still moving within a bearish corrective structure / broader downtrend, characterized by a series of lower highs and lower lows since the rejection from the 230+ area.
Currently, price is trading inside a strong historical demand zone at 127–121, which previously acted as a major accumulation and bounce area.
Price is now consolidating above this demand zone while pressing against a descending trendline, making this area a critical decision zone for the next major move.
---
Pattern & Price Structure
1. Descending Trendline (Bearish Pressure)
The descending trendline remains valid and unbroken
Each recovery move continues to be capped by this trendline
Indicates seller dominance is still present
2. Demand Zone / Support Base (127 – 121)
The yellow box marks a strong demand zone
Multiple lower-wick rejections indicate active buying interest
Price is forming a base / consolidation range above support
3. Compression Pattern (Range Tightening)
Price is compressed between:
Dynamic resistance (descending trendline)
Static support (demand zone)
This structure often leads to a high-momentum breakout
---
Key Levels
Dynamic Resistance: Descending trendline
Horizontal Resistances:
144
154.5
167
177
Major Support:
127
121
Invalidation Level:
Strong close below 121
---
Bullish Scenario
The bullish scenario is valid if:
1. Price holds above the 127–121 demand zone
2. A strong candle close breaks above the descending trendline
3. Volume expansion confirms the breakout
Upside Targets:
144 (minor resistance)
154.5 (key reaction level)
167 (mid-range resistance)
177 (major resistance)
A confirmed breakout above the trendline may signal a trend reversal or bullish continuation from a base structure.
---
Bearish Scenario
The bearish scenario occurs if:
1. Price fails to break the descending trendline
2. A strong breakdown and close below 121
3. The demand zone fails to absorb selling pressure
Downside Risk:
116.8 (previous low)
Further downside could form new lower lows, continuing the broader bearish trend
---
Conclusion
SOL/USDT is currently at a critical decision area.
The 127–121 demand zone is the key level to watch:
Holding support + trendline breakout → bullish reversal potential
Demand breakdown → bearish continuation
Patience is required. Wait for clear breakout or breakdown confirmation before committing to a directional trade.
---
#SOLUSDT #Solana #CryptoAnalysis #TechnicalAnalysis #DescendingTrendline #DemandZone #SupportResistance #AltcoinTrading #CryptoMarket

SOL at a Critical Decision Zone – Double Bottom vs ResistanceHi!
Market Context
Solana is trading near a key decision zone after a corrective move from recent highs. Price action suggests short-term bullish attempts, but the broader structure remains mixed.
Technical Structure
Broken Trendline: The descending trendline from the recent high has been broken, indicating a short-term momentum shift.
Double Bottom Formation: A clear double bottom has formed near the $121–$122 area, showing strong buyer reaction and short-term demand.
Support Zone: The horizontal support around $120 remains critical. This level has been tested multiple times and is still holding.
Resistance & Scenarios
Bullish Scenario: If price holds above $120 and continues higher, a move toward the $125–$126 supply zone is likely. This area previously acted as resistance and may trigger selling pressure.
Bearish Scenario: Failure to sustain above current levels, followed by a breakdown below $120, would invalidate the double bottom and open the door for a deeper correction.
Conclusion
While short-term bullish signs are present, confirmation requires continuation above resistance. Until then, SOL remains in a sensitive zone where both scenarios are possible. Risk management is essential around these levels.

SOL/USDT – Major Support Zone the Key to Bullish Continuation?SOL/USDT on the weekly timeframe (1W) remains in a long-term bullish market structure, despite the current corrective phase. The rejection from the major resistance area around 240 – 250 USDT has triggered a healthy pullback. As long as the key support zone holds, the broader uptrend structure remains valid.
This correction is best interpreted as a reset phase, not a trend reversal.
---
Market Structure & Price Action
From a structural perspective, SOL continues to print:
Higher Highs and Higher Lows (macro bullish structure)
Signs of distribution near major resistance
A controlled pullback toward a high-probability demand zone
Identified Price Pattern
Range Distribution → Minor Breakdown → Deep Retracement
Bullish continuation setup while holding demand
The yellow zone 94 – 78 USDT represents:
Previous weekly resistance turned support
Strong institutional demand zone
A key reaction area from the last major impulsive move
---
Key Technical Levels
Major Resistance:
240 – 250 USDT
Intermediate Support / Reaction Zone:
120 – 130 USDT
Key Support (Yellow Zone):
94 – 78 USDT
Bullish Invalidation Level:
A strong weekly close below 78 USDT
---
Bullish Scenario
If price:
Holds the 94 – 78 USDT zone
Forms bullish weekly confirmation (long lower wick, bullish engulfing, strong close above support)
Potential upside path:
1. Bounce toward 125 – 140 USDT
2. Continuation to 180 – 200 USDT
3. Retest of 240 – 250 USDT
4. A confirmed breakout opens the door for new all-time highs
Bullish Conclusion:
The yellow zone acts as a high-confidence buy-the-dip area on the weekly structure, as long as it remains intact.
---
Bearish Scenario
If price:
Closes decisively below 78 USDT on the weekly timeframe
Fails to reclaim the key support zone
Then the risk shifts to:
1. Breakdown of the macro bullish structure
2. Decline toward 60 – 55 USDT
3. Extension toward 40 – 30 USDT (historical support region)
Bearish Conclusion:
A confirmed weekly breakdown below 78 USDT signals a long-term trend reversal, not just a correction.
---
Final Conclusion
SOL remains structurally bullish on the higher timeframe, and the current pullback is still considered healthy and technical.
The 94 – 78 USDT zone is the decisive level that will determine the next major move:
Hold → bullish continuation
Break → macro trend shift
Patience and weekly candle confirmation are crucial.
---
#SOLUSDT #Solana #CryptoAnalysis #WeeklyChart #KeySupport #DemandZone #BullishStructure #AltcoinMarket #PriceAction #MarketStructure

SOL in Downtrend: Crypto Winter Hits HardFinally, Solana has broken out of its stagnation.
For a long time, the chart has been building a consolidation in the form of a three-wave WXY correction.
Right now, wave Y is wrapping up. I believe this wave could play out in two scenarios:
🔻• Solana drops from current levels to around 116-118;
🔻• or we see it much lower, in the 108 area.
I’m leaning more toward the second option because the consolidation has been quite prolonged. Plus, as I mentioned earlier, I think we’ve entered a downtrend. Crypto winter has already kicked off and is in full swing.
❌ The invalidation level for my bearish plan is 131.8 — any touch, even briefly, would cancel this scenario.
⚠️Be cautious: don’t trade without stop-losses, and avoid trying to catch the bottom, or you might end up with an unwanted “gift.”
🚀Drop reactions and comments if you want me to post daily updates on Solana.

Solana vs USD – Bearish Playbook High-Probability Swing Setup🔹 Asset: SOL/USD – “SOLANA VS U.S. DOLLAR”
🔹 Trade Style: Crypto Market Opportunity Blueprint (Swing Trade)
🔻 Plan: Bearish Plan
📍 Entry Zone
You can enter at any price level according to your strategy and confirmation signals.
🛑 Stop Loss (SL)
This is Thief SL → @ 152.50
Dear Ladies & Gentleman (Thief OG’s), adjust your SL based on your own strategy & risk levels.
🔔 Important:
Place SL only after breakout confirmation.
I am not recommending to use only my SL. It’s your choice — you make money, you take money at your own risk.
🎯 Target (TP)
Market has strong support + oversold conditions + potential trap zones, so kindly exit with profits.
Our Target → @ 125.00
🔔 Important:
Dear Ladies & Gentleman (Thief OG’s), I am not recommending to use only my TP.
It’s your choice — you make money, you take money at your own risk.
📊 Related Pairs to Watch (Correlation Guide)
1️⃣ BITSTAMP:BTCUSD – Bitcoin
King of crypto; SOL often follows BTC’s direction.
If BTC breaks down, SOL bearish continuation becomes stronger.
2️⃣ BITSTAMP:ETHUSD – Ethereum
High correlation with major altcoins.
ETH weakness usually signals pressure on L1 chains like SOL.
3️⃣ COINBASE:AVAXUSD – Avalanche
Competitor L1 chain; often moves in similar sentiment flow.
If AVAX also shows bearish structure → confirms broad L1 weakness.
4️⃣ COINBASE:LTCUSD – Litecoin
Old major coin; used for risk-on/risk-off sentiment checks.
If LTC dumps → market-wide bearish confirmation.
5️⃣ CRYPTOCAP:TOTAL2 – Altcoin Market Cap
Measures overall altcoin health.
If TOTAL2 breaks its support → SOL likely accelerates toward bearish target.
🔍 Why These Pairs Matter? (Key Correlation Points)
BTC sets the tone – SOL follows the major trend 75–85% of the time.
ETH determines altcoin liquidity – if ETH dominance rises, SOL loses capital flow.
AVAX acts as sector correlation – L1 competitors weaken together during bearish cycles.
TOTAL2 confirms broad alt weakness, making SOL’s downside more reliable.

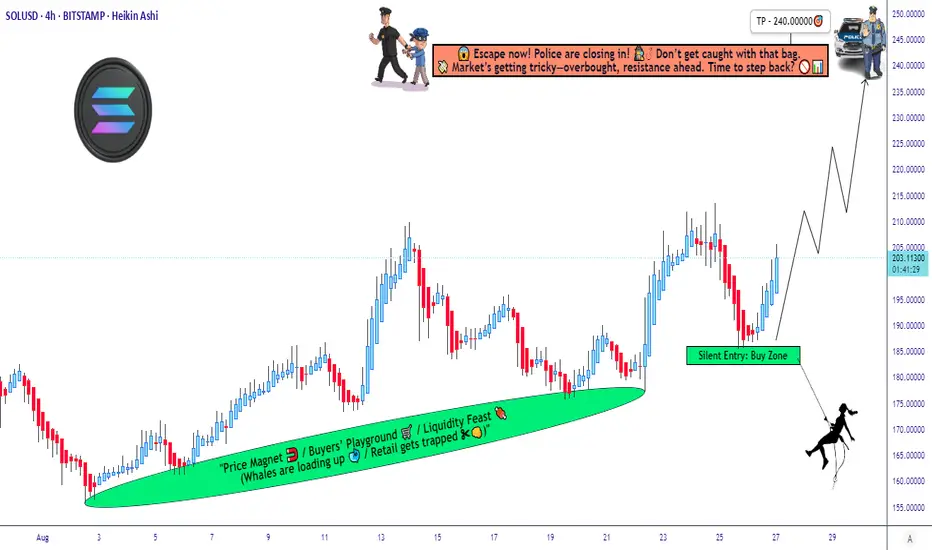
SOL/USDT Update — Bullish Trend Structure and Resistance Ahead“🚨 Solana vs Tether: Bullish Heist on SOL/USDT 💰”
📊 Description
Market: SOL/USDT
Bias: Bullish (Swing / Day Trade)
✅ Trade Plan
Entry: 🎯 Any good support / demand area — stay alert & flexible.
Stop Loss: 🛡️ “Thief SL” @ 160.00 USDT — this is my SL, not yours. Manage your own risk!
Targets (TP):
• 🎯 Target 1: 215.00 USDT
• 🏁 Target 2: 240.00 USDT
⚠️ Heads up: Use your discretion. Do not blindly follow my SL/TP — trade responsibly, at your own risk.
🔍 Key Insights / Logic
🚧 Expect resistance & traps near 215–240 — don’t get stuck in overbought zones.
📈 Momentum is building; structure is favorable on retests.
🔊 Watch volume on impulsive moves — rising volume = strength.
🔄 Related pairs / correlation watch:
• BINANCE:SOLBTC — strength vs BTC strengthens the bullish case.
• BINANCE:ETHUSDT — altcoin momentum may carry SOL upward.
• BINANCE:BNBUSDT — BNB strength can support ecosystem flow.
✨ “If you find value in my analysis, a 👍 and 🚀 boost is much appreciated — it helps me share more setups with the community!”
#SOL #SOLUSDT #Solana #CryptoSwing #CryptoDayTrade #AltcoinAnalysis #TradingViewIdeas #CryptoFun

SOLUSDT: Get Ready For 300 Mark, This Time Reversal BigSOLUSDT has the potential to reach the 300 price range once it falls to our buying zone, defined by two horizontal white lines. Upon reaching this area we can target the 300 price level. Please exercise accurate risk management when trading cryptocurrencies.
For further analysis please like and comment.
Team Setupsfx_

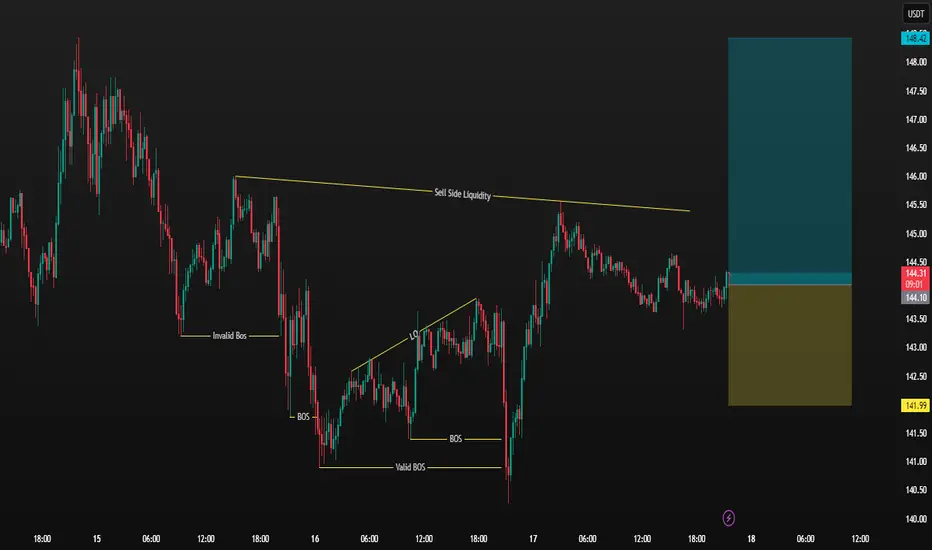
SOL Short 1D Rebalancing the bearish inefficiency is likely to lead to further development of the downward movement.

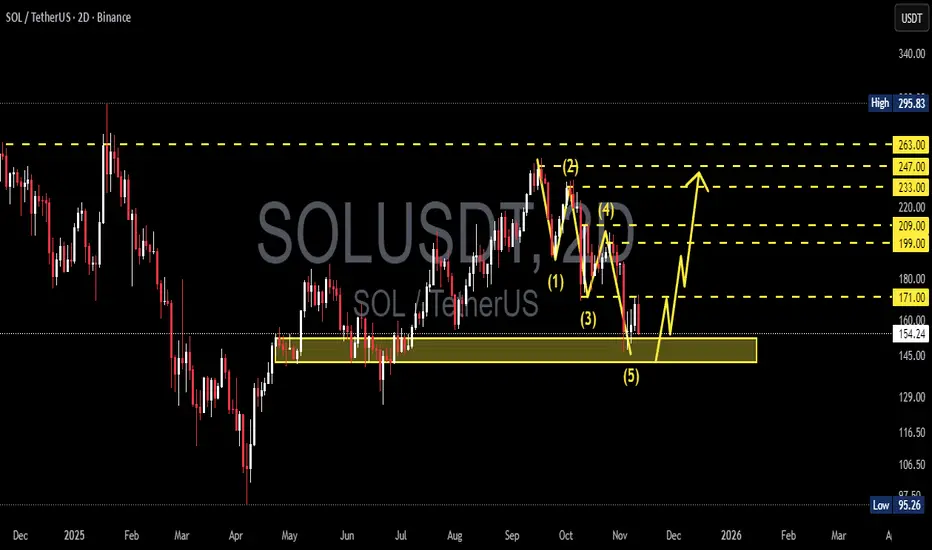
SOL/USDT — Will Solana Start a Major Reversal from Here?Solana (SOL/USDT) is now sitting at a critical turning point, as the market tests a major historical demand zone between 152–142 USDT. After completing a clear 5-wave impulsive decline, sellers appear to be losing momentum, while buyers are starting to react around this key area.
This yellow zone has previously acted as a strong demand base, triggering powerful rallies in the past. Now, it’s once again becoming the battlefield between bulls and bears — and the outcome could define Solana’s direction for the coming months.
---
Pattern & Structure
1. 5-Wave Decline (Elliott Wave Structure):
The chart shows a clean 5-wave downward pattern, often marking the end of a corrective phase. If valid, the next move could be an ABC corrective rally, signaling the start of a broader bullish reversal.
2. Critical Demand Zone (152–142):
This area serves as a strong institutional accumulation zone, where smart money often steps in. A confirmed rebound from here could ignite the next leg higher.
3. Layered Resistance Levels:
Key resistance levels are lined up at
171 → 199 → 209 → 233 → 247 → 263.
Each breakout acts as a step confirming a stronger bullish trend.
4. Fibonacci Confluence:
The 38–61% retracement levels align with 199–263, strengthening the case for this region as a natural recovery target zone in the next upward phase.
---
Bullish Scenario — “The Reversal Zone Awakens”
If price holds above 152 and forms a strong bullish reversal candle (engulfing / hammer on the 2D chart), we could see:
Target 1: 171 → first confirmation of trend reversal.
Target 2: 199–209 → mid-level recovery zone.
Target 3: 233–247 → full corrective phase.
Extended Target: 263 → upper resistance and profit-taking zone.
This scenario represents the potential end of a multi-month bearish phase and the beginning of a fresh bullish cycle.
A 2D close above 171 would strongly confirm the reversal structure.
Additional confirmation: bullish divergence on RSI, increasing buy volume, or formation of higher lows on the 2D timeframe.
---
Bearish Scenario — “Breaking the Floor”
If the price closes below 142, the current demand zone will flip into resistance, signaling continuation of the downtrend toward:
First target: around 116 (minor demand).
Main target: 95 (previous historical low).
A breakdown below 142 would suggest that wave (5) may not yet be complete, indicating one final capitulation wave before a potential long-term bottom forms.
---
Strategy & Outlook
Conservative traders: Wait for a confirmed 2D close above 171 before entering any bullish setups.
Aggressive traders: Consider gradual accumulation near 152–142 with tight SL below 142.
Risk management: Maintain a minimum R:R of 1:2, and avoid averaging down blindly without confirmation.
Multi-timeframe confirmation: Watch daily and 3D candles for stronger conviction signals.
---
Market Psychology
This current phase represents a “capitulation zone” — where retail confidence fades while smart money starts positioning quietly.
Historically, major trend reversals are born from such exhaustion zones. If SOL can defend this support area, it could be the beginning of a powerful new uptrend toward 200+ and beyond.
---
Conclusion
Zone 152–142 = critical buyer defense line.
Reaction in this zone will determine the next macro trend for Q4 2025 – Q1 2026.
Breakdown → downside target 95.
Reversal → upside potential up to 263.
---
#Solana #SOLUSDT #CryptoAnalysis #TechnicalAnalysis #SupportResistance #ElliottWave #CryptoReversal #SwingTrade #PriceAction #AltcoinSeason #SolanaAnalysis
SOL Short SOL Short 📉
In the medium term, I am bearish.
Rebalancing the bearish inefficiency (POI) is likely to lead to continued aggressive markdowns, which can be used to open a short position.

SOLANA’S SWING — BEARS TAKE WINGHey guys! How was your trading week? Hope you made some great profits!
Solana has completed only half the way to my target at 167 and then reversed — and now I don’t see any signs of continuation to the upside.
In my previous Solana post, I mentioned that my next downside targets are 144 and then 124.
I believe we’ve just finished the correction and are heading toward 144 — at least, that’s what all the signs on the chart are showing me right now.
However, first I expect a dip to 147, as there might be a short-term bounce before further decline.
🎯 Targets:
1️⃣ 147
2️⃣ 144
3️⃣ 124
❌ Invalidation: 158.53
📈 Follow me to stay updated on Solana’s next moves and other crypto setups — don’t miss my updates!
⚠️ Disclaimer:
This is not financial advice. I share my personal market view for educational purposes only. Always do your own research before making trading decisions.

Solana’s pause after the causeHi friends!
How are you doing after the recent Bitcoin–Solana drop?
I hope you didn’t lose anything — and maybe even managed to make some profit instead! 💪
📉 My next targets on the downside are around $144 and $124, but at the moment, Solana seems to be taking a breather from the fall.
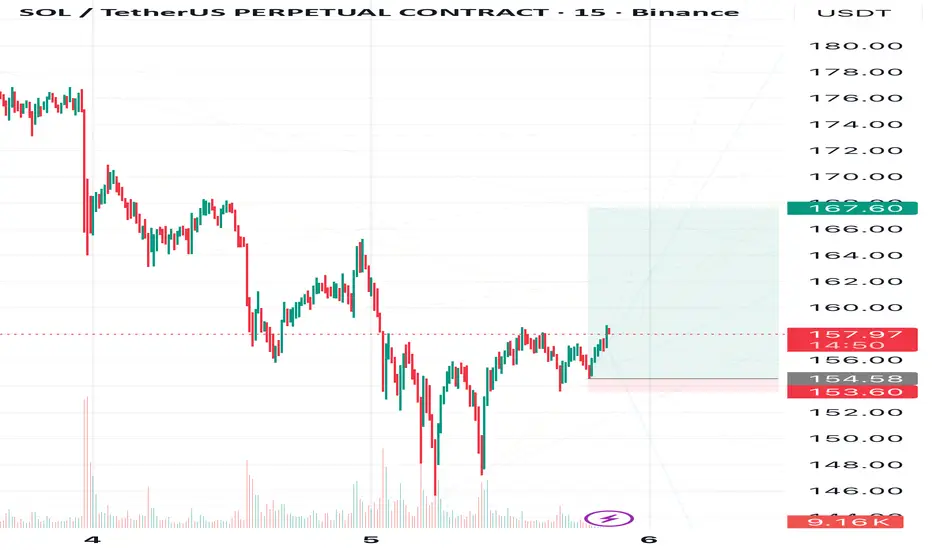
After a long and deep decline, even below my earlier expectations, Solana is finally showing some signs of a small correction to 167,60 📈
🎯Target - 167,60
❌Invalidation zone are marked on the chart - 153,60
💬 What do you think — is this the start of a reversal, or just a short pause before another move down? Share your thoughts in the comments. I always enjoy reading your views!
🔔 Follow me to stay updated on Solana and other crypto market analyses.
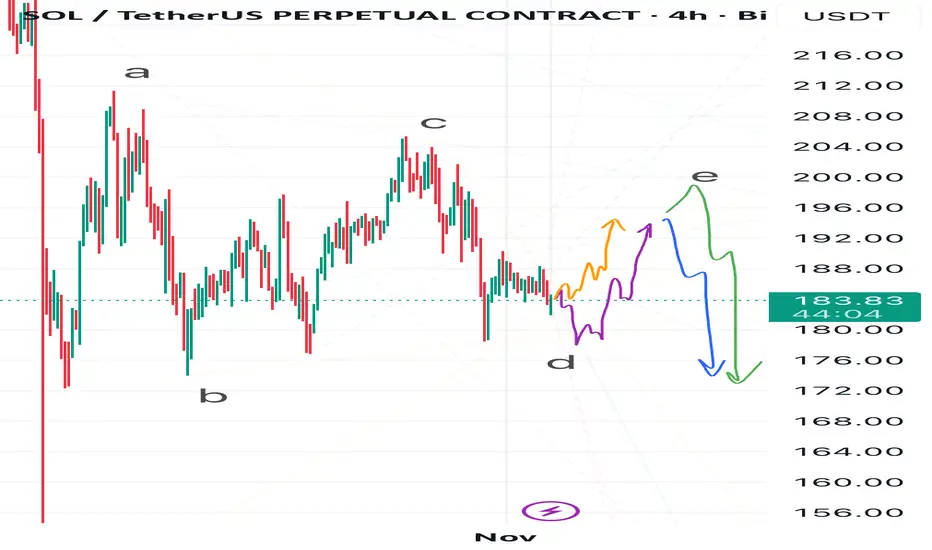
Solana Swing — D or E in the Ring?I see several possible scenarios for Solana at the moment.
In my view, either wave D of the corrective ABCDE triangle has already formed, and the price will follow the orange path, starting to build wave E —
or wave D isn’t complete yet, and Solana might still drop toward 178 or even lower, following the purple path, before beginning wave E.
As for wave E, I also see two possible outcomes:
• The green path, where wave E extends up to around 200,
• Or the blue path, where wave E ends near 194–196, followed by a downside breakout from the triangle, sending Solana toward ~170 or even lower.
💬 Which scenario do you find more likely? Share your thoughts in the comments!
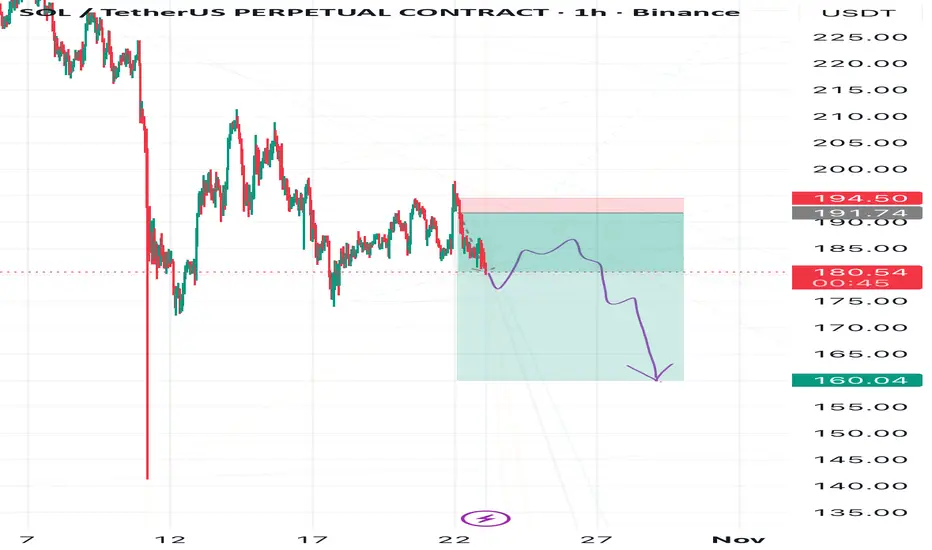
Solana — Triangle Tale Before the Pale As you might remember from my previous publications, I’m expecting Solana to decline toward 164 and possibly even lower.
At the moment, I’d like to see it around 178, and depending on how the move toward this level develops, I’ll decide on my next steps — which you’ll see in my upcoming updates.
I have a thought that after reaching 178, Solana might move upward first, forming a corrective triangle, and only later drop to 164 or even below.
The invalidation zone for the current plan is marked in red on the chart.
📉 Follow me so you don’t miss my next analyses and scenario updates

SOLANA HIGH PROBABILITY SETUPS SOON!!!🚨 SOL HIGH PROBABILITY SELL/BUY SETUP 🚨
* Here We Can See Clearly The Next Potential Moves For SOLUSD Coming Hours/Days.
* Keep Your Eyes Close On Your Trading Positions.
* Happy PIP Hunting Traders.
FXKILLA.

Is Solana Ready for a Technical Breakout or Just a Fake Pump?🎯 SOL/USDT Wealth Strategy Map | The Gentleman Thief's Playbook 💎
📊 Market Overview
Asset: SOLANA/USDT (SOL/USDT)
Trading Style: Swing/Day Trade Hybrid
Market Sentiment: Bullish Pending Breakout Setup 🚀
🎭 The Setup (As Told by a Professional Thief)
Dear Ladies & Gentlemen, gather 'round for today's calculated heist...
🔓 The Entry Plan
Breakout Zone: $240
Entry Strategy: ANY price level AFTER confirmed breakout above $240
💡 Why this matters: We're watching for resistance to crack like a vault door. Once $240 breaks with volume, the path to riches opens.
🛡️ Risk Management (The Thief's Insurance Policy)
Stop Loss: $220
⚠️ Important Notice: This is my thief-style SL, but YOU are the master of your own vault. Set your risk tolerance based on YOUR capital and comfort level. Make money, take money — at your own calculated risk.
🎯 Profit Targets (Where We Cash Out)
Primary Target: $270 (Our recommended exit)
Technical Target: $280 (Strong resistance + overbought territory + potential trap zone)
📌 Strategic Exit Reasoning:
$270 offers a clean 12.5% gain from breakout
$280 presents multiple bearish factors: strong resistance, overbought conditions, and classic bull trap setup
Smart thieves escape with profits before the alarm sounds 🚨
⚠️ Important Notice: This is my thief-style TP, but only YOU can decide when to take profits. Your money, your rules, your risk.
🔍 Technical Analysis Deep Dive
Key Levels to Watch:
Resistance: $240 (current), $270 (target), $280 (danger zone)
Support: $220 (our safety net)
The Correlation Play 📈
Related Pairs to Monitor:
CRYPTOCAP:BTC (Bitcoin) - The market's king affects all. If BTC pumps, SOL typically follows with 1.5x volatility
CRYPTOCAP:ETH (Ethereum) - Direct competitor in smart contracts; inverse correlation on capital rotation
CRYPTOCAP:AVAX (Avalanche) - Similar L1 narrative; watch for sector rotation signals
SEED_DONKEYDAN_MARKET_CAP:MATIC (Polygon) - L2 competitor; check for broader altcoin momentum
💡 Correlation Strategy: If BTC holds above $65K while ETH consolidates, SOL historically outperforms due to capital flow seeking higher beta plays.
⚡ The Gentleman Thief's Trading Philosophy
This isn't gambling — it's calculated robbery from the market's inefficiencies. We enter with precision, manage risk like professionals, and exit before greed becomes our enemy.
Remember:
✅ Breakouts need volume confirmation
✅ Risk management is non-negotiable
✅ Profits aren't real until you take them
✅ The market doesn't care about your feelin
📢 Community Engagement
✨ "If you find value in my analysis, a 👍 and 🚀 boost is much appreciated — it helps me share more setups with the community!"
⚖️ Legal Disclaimer
IMPORTANT: This is a "thief-style" trading strategy shared purely for educational and entertainment purposes. This is NOT financial advice. Trading cryptocurrencies involves substantial risk of loss. Past performance does not guarantee future results.
You are solely responsible for your own trading decisions. Always:
Do your own research (DYOR)
Never invest more than you can afford to lose
Understand the risks before trading
Consider your personal financial situation
The author is not a registered financial advisor and assumes no liability for your trading outcomes.
Trade safe, steal smart, exit elegant. 🎩💰
#SOLUSDT #Solana #CryptoTrading #SwingTrading #DayTrading #TradingStrategy #Breakout #TechnicalAnalysis #CryptoSignals #AltcoinSeason #SOL #USDT #CryptoAnalysis #TradingView #PriceAction #CryptoChart #BullishSetup
Don’t Trust the Twist — Solana’s Fall May PersistBe careful with Solana — the market might trick you into thinking a bullish reversal is forming.
In reality, the downtrend hasn’t finished yet.
A descending triangle is forming, and the breakout could be strongly to the downside.
🎯 Targets:
1️⃣ 164
2️⃣ 156
3️⃣ 138
❌ Invalidation: if price reaches the red zone marked on the chart
SOL/USD: Bullish Swing Plan w/ Layered Buy Limits & Target🏴☠️ ATTENTION ALL THIEVES & ROBBERS! 🏴☠️
Asset: SOL/USD "Solana vs U.S Dollar" Crypto Market Heist Plan (Swing / Day Trade)
Plan: Bullish Heist ✅
🎯 THE MASTER PLAN: OPERATION SOLANA BULL RUN
Ladies & Gentlemen of the thieving community! 👔🦹♂️🦹♀️ Based on the Thief Trader's secret technical analysis, the vault door to Solana profits is creaking open! Time to execute the heist!
🚪 ENTRY: LAYER UP & SLIP IN SILENTLY
The Thief is using a multi-layer limit order strategy for this entry! We don't knock down the door, we pick the locks one by one! 🔓
Place your buy limit orders at these levels:
Layer 1: 190.00000
Layer 2: 195.00000
Layer 3: 200.00000
🛠 PRO TIP: You can increase your limit layers based on your own capital! More layers = bigger haul! 💰💰
🛑 STOP LOSS: THE GETAWAY DRIVER'S LOCATION
This is the Thief's SL: @180.00000
Listen up, OG's! 👉 Adjust your final SL based on your own strategy and risk appetite! Don't get caught because you got greedy on the entry! Know your exit route! 🚗💨
🎯 TARGET: ESCAPE BEFORE THE COPS ARRIVE!
The police barricade is forming at @240.00000! 🚨👮♂️
Do NOT get greedy! Grab the stolen money, exit the vehicle, and ESCAPE WITH THE PROFITS before the target! A true thief knows when the job is done! 🏁💰
⚠️ THIEF'S FINAL WARNING & DISCLAIMER
📰 News is an Undercover Cop: It will wreck our plan! Avoid new trades during high-impact news!
🔄 Use Trailing SL: Once in profit, trail your stop to lock it in! Protect the loot!
📉 This is not financial advice. This is a heist plan. You are the thief. Your capital, your risk. I'm just the mastermind.
💖 Enjoyed the plan? SMASH THAT LIKE & BOOST BUTTON! ✅ It helps our crew grow and plan the next big score! 🚀🤝
Stay sharp, thieves! I'll see you on the next heist. 🤑👋