You will ask yourself "how did he know Sol would do that"?On Aug 30th I suggested that Sol was approaching my ideal buy zone at T2. I anticipated a bounce to my take profit target soon after. That played out perfectly.
Question remains...will T2 remain support? What do you think? I'd love to hear your thoughts.
May the trends be with you.
Solusdtlong

Sep 2, 2025 - SOLUSDT Long Position ReviewFollowing up on yesterday’s analysis, with each reaction to the 204.34 level, I became more confident about the presence of sellers above this zone. At the same time, since every rejection off this level was also creating a higher low , I decided to treat it as a risky long trigger.
After the breakout of this line and the 15m and 1H candle closing above it, I was still cautious, suspecting that the main sellers might be sitting around 206.24 .
At that point, as the RSI also reached its resistance line, I placed a buy stop order at 207 , just above the highest previous wick. I intentionally set the buy stop at the highest possible point to ensure that both price and RSI had convincingly broken their resistances.
This position is still open, and I’m now waiting for higher targets to be reached.

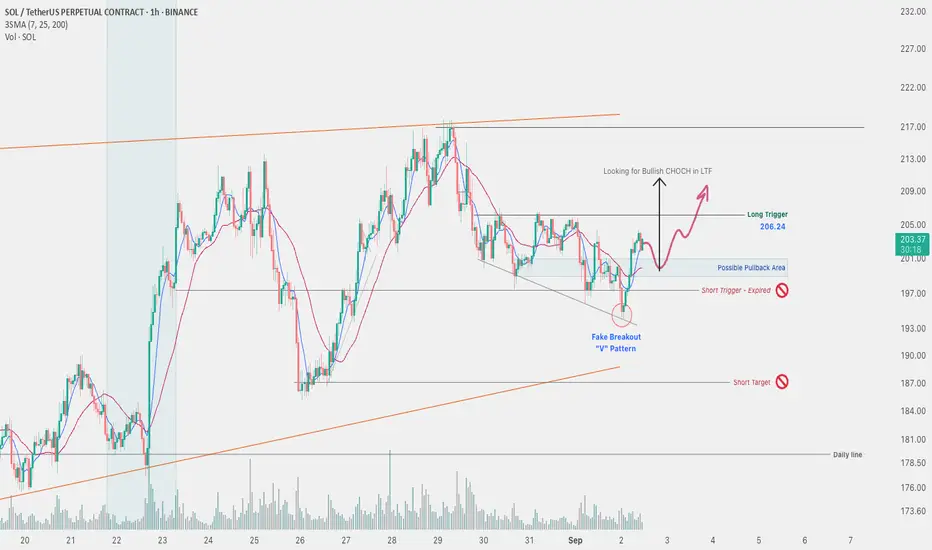
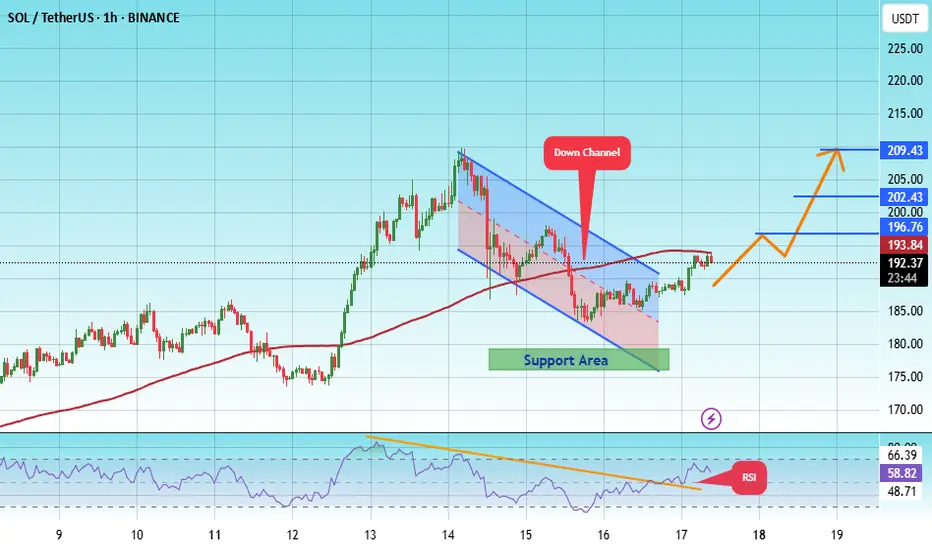
Sep 2, 2025 - SOLUSDT 1H Chart Analysis-01Despite the broader long-term uptrend in Solana, yesterday I was considering a risky short position on one of the altcoins and had already defined the triggers. Fortunately, the short trigger was broken while I wasn’t monitoring the chart, so no position was opened.
The positive development is that we saw a fake breakdown of the 197.36 support zone. After collecting liquidity below this level, Solana initiated a strong bullish move.
I’ve marked the long trigger at 206.24. However, for an early entry ، if I spot a market structure shift in the pullback zone, I’ll scale in with a partial position. Then, if the main level breaks, I’ll add more volume to the trade.
I will also check my entries with the SOLBTC chart for more confirmation
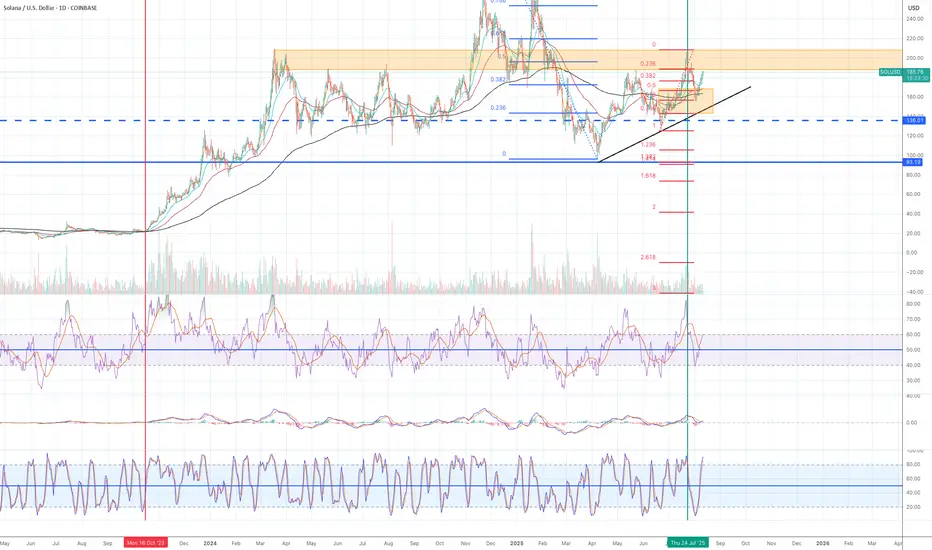
Solana -> a descending broadening wedgeHello guys!
A descending broadening wedge is forming, indicating a potential bullish reversal if price follows the typical pattern.
Pattern Analysis: Descending Broadening Wedge
The wedge is marked with two diverging trendlines, where the upper line is descending and the lower line slopes down but at a slower rate.
This pattern generally signals a reversal scenario, especially after a downtrend.
Price typically oscillates between the upper and lower trendlines before a breakout occurs.
Support and Resistance Levels
Immediate resistance: Near $205–207 (upper trendline of the wedge).
Support zone: Around $192–193, marked by the lower wedge line and a grey horizontal area, which historically acted as strong demand.
Price objective: Upon breakout, the target is around $212+, as indicated by the schematic at the top-left corner of the chart.

SOLUSDT: Trade 15 min Trade Hello friends. As you seen the chart of SOLUSDT we see the correction Wave abc to reach the 212$ price and I gusse will be start the countinues the big correction.

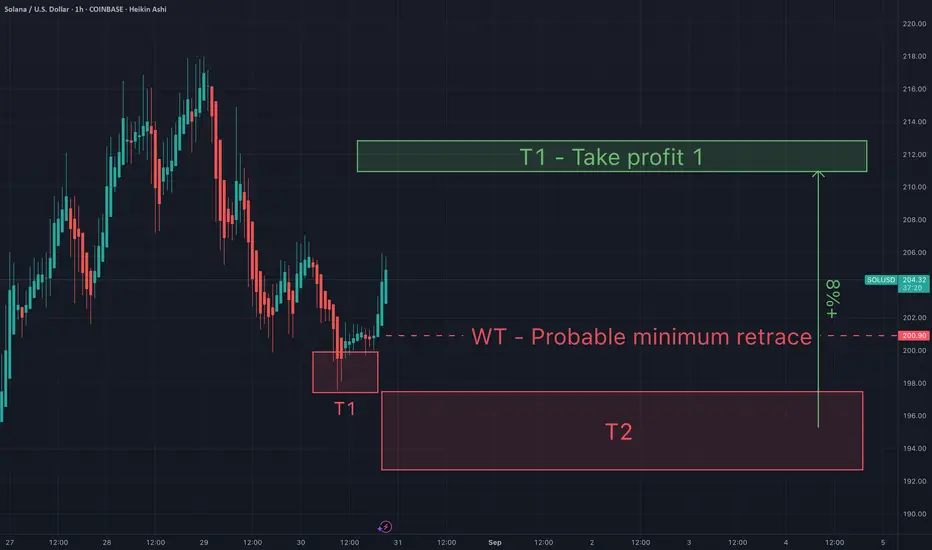
Sol - Support and resistance & take profit targetsSol - Support and resistance & take profit targets. Ideally Sol gets a retrace this weekend to my T2 so I can load up even more. Either way I'm taking profits at my green T1.
May the trends be with you.
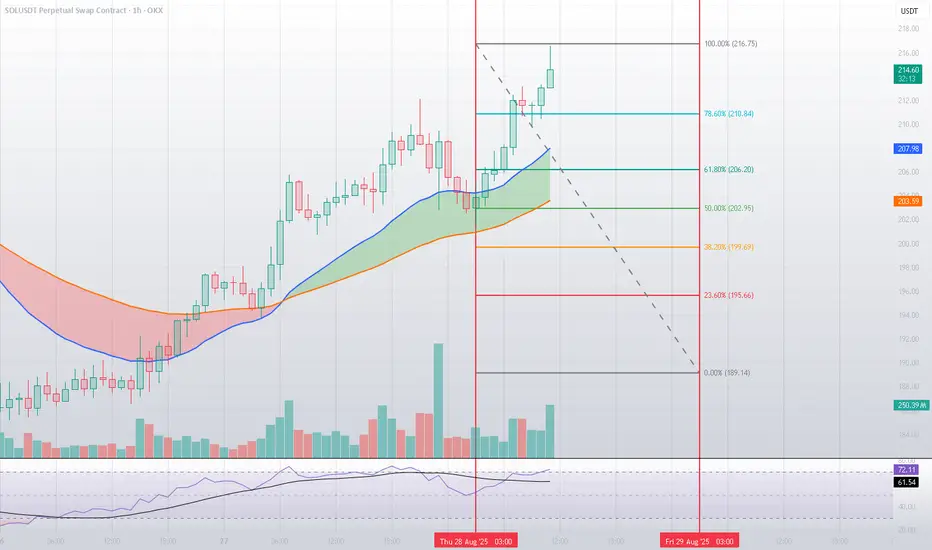
Technical Analysis for SOL/USDTBased on mathematical and statistical models, along with technical tools such as Fibonacci retracement levels and moving averages, Solana (SOL) continues to show strong bullish momentum after breaking key levels and trading around $215.
🔹 Resistance Levels
$216.75: The first major resistance, derived from the 100% Fibonacci extension. A confirmed breakout above this level would likely trigger a new impulsive move upward. 🚀
$225.61: A critical resistance zone. Surpassing this level would further validate the bullish trend and open the door for an extended rally toward $230+.
🔹 Support Levels
$213.38: The first support level. Holding above this zone reflects buyers’ strength, while a break below it could lead to a short-term correction. 🛡️
$210.84: A stronger and more decisive support aligned with the 78.6% Fibonacci retracement. Losing this level would weaken bullish momentum and potentially push the price down toward $206 – $202.
📈 Indicators
The RSI is hovering around 72, signaling overbought conditions ⚠️, which may trigger short-term corrections before any further upside.
The 20 & 50 EMAs remain in a bullish alignment, confirming the upward trend as long as price holds above key support levels.
🟢 Bullish Scenario
A successful breakout above $216.75 will pave the way toward $225.61, with potential continuation toward $230+ if momentum persists.
🔴 Bearish Scenario
Failure to clear resistance and a corrective pullback could test $213.38 first, followed by $210.84 as a decisive support level to avoid a deeper trend reversal.
✅ Conclusion
Solana stands at a critical juncture between strong resistances around $216 – $225 and solid supports near $213 – $210. A breakout or breakdown from these zones will define the next major move — either extending the bullish rally or triggering a deeper correction. ⚖️
SOLANA to $600Solana held $123 as support on the monthly timeframe, with the next resistance at approximately $640 in November.

SOL : I want to shop in these areas.Hello friends
Well friends, after a few hunts for the channel, the buyers finally broke the channel and the task was clear.
Now, with the price growth and correction we had in the areas identified as channel price pivots, I want to buy and move with it to the specified targets.
*Trade safely with us*

Bullish preparing to break above resistance?Solana gaining power vs. USD and that is boosting also other Solana paires.
On D tf I notice higher highs and higher lows, the market today a little bearish, but the bulls are accumulating. I am long. If the market falls back to 996, I add my longs. If below 990, I get out. First target is 1157, 2nd target is 1361
I dont show my stops. If you use stops. it depends on your own risk tolerance.

#SOL/USDT Golden Pocket Retest ?#SOL
The price is moving within an ascending channel on the 1-hour frame, adhering well to it, and is on its way to breaking strongly upwards and retesting it.
We have support from the lower boundary of the ascending channel, at 174.85.
We have a downtrend on the RSI indicator that is about to break and retest, supporting the upside.
There is a major support area in green at 173, which represents a strong basis for the upside.
Don't forget a simple thing: ease and capital.
When you reach the first target, save some money and then change your stop-loss order to an entry order.
For inquiries, please leave a comment.
We have a trend to hold above the 100 Moving Average.
Entry price: 181.
First target: 183.
Second target: 186.
Third target: 190.
Don't forget a simple thing: ease and capital.
When you reach the first target, save some money and then change your stop-loss order to an entry order.
For inquiries, please leave a comment.
Thank you.

#SOL/USDT Is This the Perfect Time for a Solana Bullish Heist?#SOL
The price is moving within an ascending channel on the 1-hour frame, adhering well to it, and is on track to break it strongly upwards and retest it.
We have support from the lower boundary of the ascending channel, at 180.
We have a downtrend on the RSI indicator that is about to break and retest, supporting the upside.
There is a major support area in green at 178, which represents a strong basis for the upside.
Don't forget a simple thing: ease and capital.
When you reach the first target, save some money and then change your stop-loss order to an entry order.
For inquiries, please leave a comment.
We have a trend to hold above the moving average of 100.
Entry price: 192.
First target: 196.
Second target: 202.
Third target: 209.
Don't forget a simple thing: ease and capital.
When you reach the first target, save some money and then change your stop-loss order to an entry order.
For inquiries, please leave a comment.
Thank you.
SOL - Buy it before it's too late!As simple as the chart looks, everything on it is clear with strong targets expected in a short time.
The blue line: a close above it means BOS (Break Of Structure), signaling continuation of the upward move.
🔸Notice: this is the third attempt to break it.
In trading, resistance that the price tests multiple times weakens over time, and when it finally breaks, it usually does so with a huge green candle.
The price has also broken the daily 0.618 Fibonacci level, crossed above the 25 EMA, and made a retest of it.
Your minimum target from here is $400.
It’s a beautiful chart, strong project, and a leading coin in the market with big targets ahead… all that’s left is for you to buy it.
Best Regards:
Ceciliones🎯

SOL — Growth Scenario from $187: TP4 Done, Position Still ActiveOn the 4-hour chart of Solana (SOL), our algorithmic model on August 20 identified a set of conditions favoring the continuation of the upward movement. The starting zone was around $187, where several factors aligned: strengthened buying volume, a breakout from the local range, and the defense of a key support level.
The trade has since unfolded according to the step-by-step management plan: price moved through the intermediate milestones, with profit-taking levels being triggered gradually. At this point, TP4 has been reached, with SOL already trading above $200. The position remains open, as the trend structure continues to hold and no confirmed reversal impulse to the downside has appeared.
The current working range is $198–$201. Holding this zone keeps the door open for continuation toward $205–$208, and potentially testing local highs around $212–$215. A breakdown and close below $198 would shift the focus back to the $194–$192 zone, where the model would reassess the buyer’s strength.
The key idea remains the same: we don’t try to guess direction but follow market structure and probabilities. The algorithm captures conditions where the trend has a statistical advantage, and the TP levels allow us to lock in profits step by step without giving control to emotions.
Solana Prediction for 8/22I believe what we're seeing (order flow) is a bullish range order flow.
I don't see abnormal or excited sellers with huge size coming in constantly to bring price to any huge bearish targets.
Which leads me to believe, we're in a giant range.
Also today we had lots of buying activity that did strike me as excited. Big buyers, if they can get loose this target should be easy.

Long!!!!!I bought more Solana, opened a leveraged long position and also opened an option trading over the weekend.
I think Solana is about to end the 18th month's consolidation and is getting ready to move to the upside.
Reasons for my directional bias:
1) RSI lines crossed at 50 area and are moving to the upside.
2) MACD stayed in the bull zone and lines have crossed to the upside.
3) EMA 55 crossed above EMA200 on 24th July. As I said in the previous articles, when they cross, the price often pulls back significantly and retests some key areas. The price dropped to Fib 0.618, found support and it is now moving to the upside. (green vertical line in the chart)
4) EMA21>EMA55>EMA200 - all EMAs are pointing to the upside (not horizontal)
5) $185 -$200 has been working as a strong liquidity zone. It has been difficult to break above and stay above, but I think it has enough momentum to start the next leg up.
6) In the monthly chart, RSI lines and MACD lines are above to cross to the upside. The last time that happened was Oct 2023. The price consequently moved from $20 ro $210 (Fib 0.786) in a matter of 6 months. And it was when EMA55 crossed above EMA200 in the daily chart and price pulled back and retested Fib 0.618. (Red vertical line)
SOL - BTC Is it a buy? Checking the SOLBTC chart I notice that it might be time to buy into SOL.
Why? We have reached the golden pocket 0.702 level in retracement and now SOL could gear up for a massive pump.
Are you buying? Or Waiting?
Do you want to risk your BTC for it?
#OL is aiming for the $259–$300 zone in the next bullish legSOL is aiming for the $259–$300 zone in the next bullish leg, as long as it holds above the $155–$130 support range. A break below this zone could delay the move, but momentum remains strong while above support.

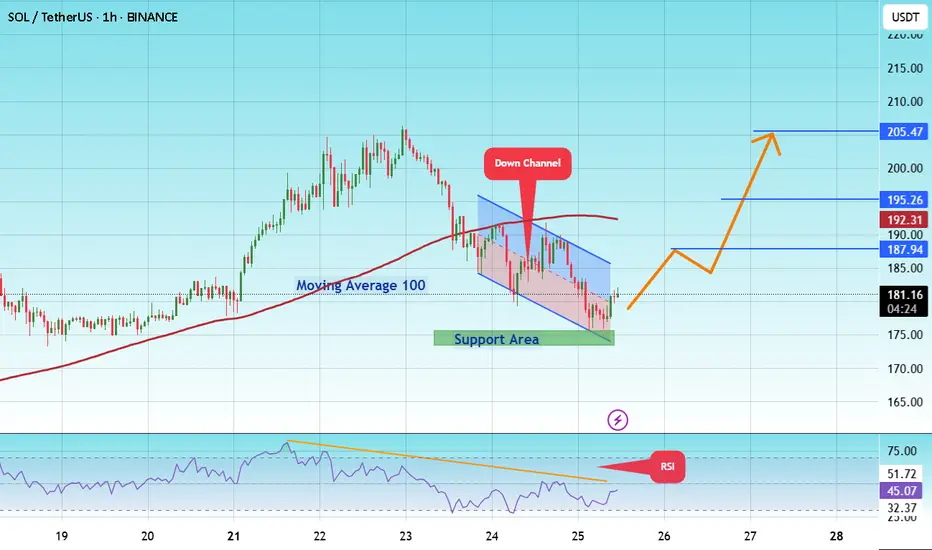
#SOL/USDT coin market structure analysis#SOL
The price is moving within a descending channel on the 1-hour frame and is expected to break and continue upward.
We have a trend to stabilize above the 100 moving average again.
We have a downtrend on the RSI indicator that supports the upward move with a breakout.
We have a support area at the lower boundary of the channel at 175, acting as strong support from which the price can rebound.
We have a major support area in green that pushed the price upward at 174.
Entry price: 181.
First target: 187.
Second target: 195.
Third target: 205.
To manage risk, don't forget stop loss and capital management.
When you reach the first target, save some profits and then change the stop order to an entry order.
For inquiries, please comment.
Thank you.
Smart money levels for $SOLUSDT, don't miss this zoneSolana continues to respect its long-term rising support line, showing strong underlying strength.
After a solid accumulation phase in early 2023 that led to a sharp rally, SOL is now in another accumulation zone just below its all-time high of $296.
A clean breakout from this range could set the stage for a major move into uncharted territory.
DYOR, NFA

"SOL/USD BULLISH HEIST! Steal Profits Like a Pro"🏆 "SOLANA HEIST ALERT! 🚨 Bullish Loot Ahead – Thief Trading Style (SOL/USD)" 🏆
💸 Steal Profits Like a Pro – Day/Swing Trade Plan 💸
🌟 Greetings, Market Pirates & Profit Raiders! 🌟
Hola! Bonjour! Hallo! Marhaba! 🤑 Dear Thieves & Trend Snipers, the SOL/USD vault is WIDE OPEN! Time to execute the heist with precision.
🔥 THIEF TRADING MASTER PLAN 🔥
🎯 Mission: LONG SOLANA (Escape Near Blue ATR Line)
⚠️ Danger Zone: Overbought | Consolidation | Bear Trap Ahead
🏆 Rule: "Take Profit & Treat Yourself – You’ve Earned It!" 💪💰
📈 ENTRY STRATEGY (The Heist Begins!)
"SWIPE THE BULLISH LOOT!" – Enter at any price, but smart thieves use:
Buy Limit Orders (15-30min timeframe)
Swing Low/High Pullbacks for optimal entry
DCA/Layering Strategy (Multiple limit orders for max loot)
🛑 STOP-LOSS (Escape Plan)
📍 Thief SL: Below nearest low (Daily MA @ $160.00)
⚠️ Adjust SL based on: Risk tolerance, lot size, & DCA layers.
Pro Tip: Tighten SL if market flips bearish!
🎯 TARGETS (Profit Escape Routes)
🎯 Main Take-Profit: $220.00 (or exit earlier if momentum fades)
🧲 Scalpers: Only LONG! Use trailing SL to lock gains.
💰 Big Bank Thieves: Go all-in. Smaller Raiders: Join swing traders.
📰 WHY SOLANA? (Fundamental Boosters)
Bullish Momentum (Tech + Sentiment Driving Price)
Macro Trends, On-Chain Signals 👉 Check Liinkss 🔗
Intermarket Analysis: Crypto & equities syncing for gains!
⚠️ TRADING ALERTS (News & Risk Control)
🚨 News = VOLATILITY! Avoid new trades during major releases.
🔒 Protect Running Trades: Use trailing stops to secure profits.
💥 SUPPORT THE HEIST! (Boost & Win Together) 💥
🔥 Hit the "LIKE" & "BOOST" button to strengthen our Thief Trading Squad!
🚀 More Heist Plans Coming Soon – Stay Tuned! 🤑🎉
📌 Reminder: This is NOT financial advice – DYOR & manage risk!

Solana – Momentum Continues After \$155 LaunchpadTrend:
SOL rallied from \$155 support and is now trading well above both the 50 EMA and 200 EMA on 4H/Daily charts.
Strong uptrend with higher highs and higher lows in place.
Pattern:
Breakout from ascending channel retest at \$155 triggered fresh buying.
Price is currently approaching resistance near \$185–\$188, which, if broken, opens the path to \$200+.
Key Levels:
Support: \$172, \$165, \$155 (major swing low)
Resistance: \$185, \$200, \$215
Breakout Trigger: 4H close above \$185 on strong volume
Indicators:
RSI remains in bullish zone (65–70), showing strength without extreme overbought conditions.
MACD still in bullish crossover with widening histogram.
Volume increasing on upswings, confirming buyer dominance.
Trade Plan:
Entry: Buy pullbacks to \$172–\$175 OR breakout above \$185 with volume
Stop-loss: Below \$165 (swing low)
TP1: \$200
TP2: \$215
TP3: \$230 (if momentum accelerates)
Bias: Bullish while price holds above \$165.
📈 SOL’s rebound from \$155 has shifted market sentiment firmly bullish. A breakout above \$185 could be the ignition point for a run into the \$200–\$230 range.

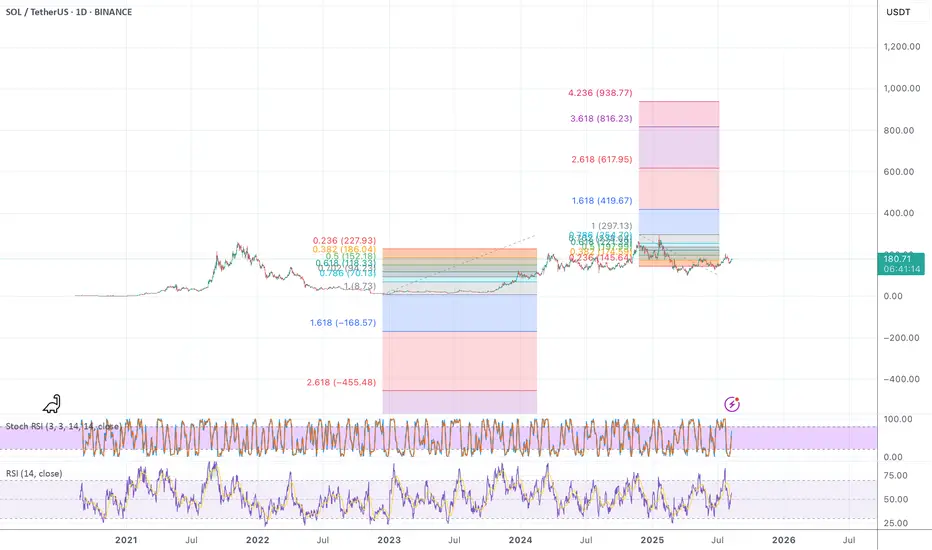
SOL - How high can this thing fly? 1000USD?? Checking the fibbs here I see what is possible.. is it really?
It looks to me like this thing hasn't even started yet.
Can it go to 1000USD? Tell me your thoughts