SOLUSDTPERP

#SOL/USDT Final Liquidity Zone Before Expansion ?#SOL
The price is moving within a descending channel on the hourly timeframe. It has reached the upper boundary and is heading towards breaking it. A retest of this boundary is expected.
The Relative Strength Index (RSI) is showing an upward trend, as it has approached the upper boundary. A bearish reversal is expected.
There is a key support zone in green at 74.00. The price has bounced from this zone several times and is expected to bounce again.
A consolidation trend is observed above the 100-period moving average, which we are approaching. This trend supports a decline towards this level.
Entry Price: 82.00
Target 1: 84.39
Target 2: 87.93
Target 3: 92.43
Stop Loss: Above the green support zone.
Remember this simple thing: Money management.
For any questions, please leave a comment.
Thank you.

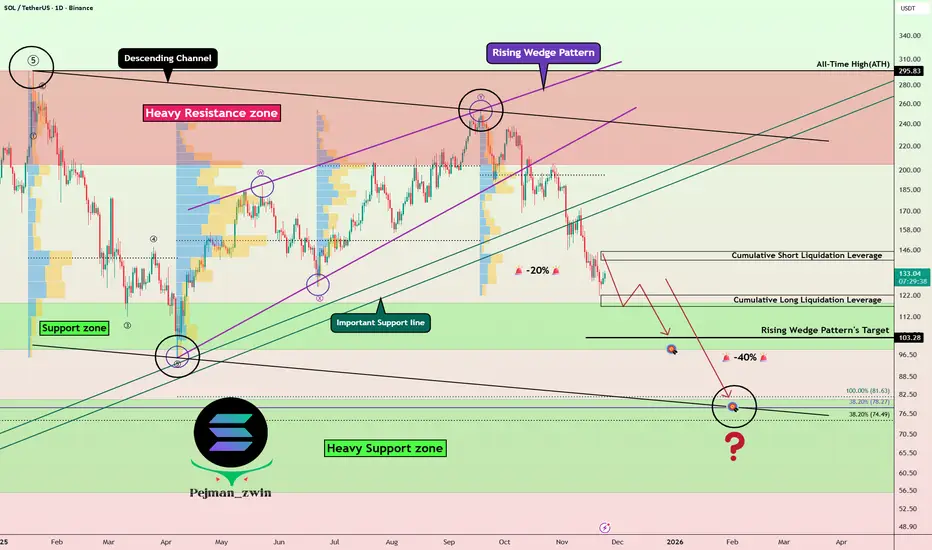
Solana Breakdown Roadmap—Is the Correction Just Getting Started?Today, I analyze the Solana( BINANCE:SOLUSDT ) project and explore its roadmap for the coming days and weeks, so stay tuned!
Solana, with the help of the Rising Wedge Pattern, has successfully broken through its important support lines and is currently moving near the Support zone($118-$98).
From an Elliott Wave perspective, it seems that Solana has completed its five main waves and is now in a corrective phase.
Given the current cryptocurrency market conditions, I expect Solana to break through the Support zone($118-$98) and at least reach the target of the rising wedge pattern, potentially dropping down to $80.
Additionally, it’s worth noting that the SOLBTC( BINANCE:SOLBTC ) pair is also showing a bearish trend, which means that if the broader crypto market declines, Solana could face even greater losses.
First Target: $107
Second Target: $83
Stop Los(SL): $174
Cumulative Long Liquidation Leverage: $122-$119
Cumulative Short Liquidation Leverage: $150-$145
💡 Please respect each other's opinions and express agreement or disagreement politely.
📌Solana Analyze (SOLUSDT), Daily time frame.
🛑 Always set a Stop Loss(SL) for every position you open.
✅ This is just my idea; I’d love to see your thoughts too!
🔥 If you find it helpful, please BOOST this post and share it with your friends.
Solana (SOL) — 1H: Bearish Structure Remains in FocusOn the 1-hour chart, Solana may appear to be forming a reversal after an extended decline. However, the current structure does not yet support this view.
Price action remains weak, with downside risk still present. A move toward the 125-125,5 area could allow for short-term consolidation, followed by a rotation into the 116–118 zone.
From there, continuation toward 108 remains a level to monitor.
This scenario would change if price reaches the 127 level.

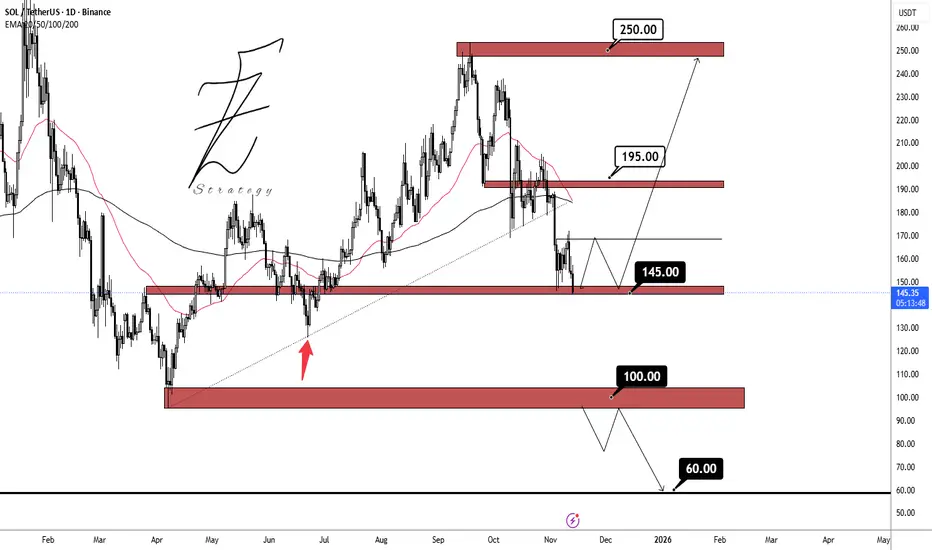
SOLUSDTLast week, the price BINANCE:SOLUSDT showed a positive reaction around the 145.00 dollar support zone, and with weakening bearish momentum, the likelihood of holding above this level has increased. If this support remains intact, the next target will be the 195.00 dollar resistance area.
Support zones: 145.00 dollar, 100.00 dollar, 60.00 dollar
Resistance zones: 195.00 dollar, 250.00 dollar
#SOL/USDT Final Liquidity Zone Before Expansion ?#SOL
The price is moving within a descending channel on the hourly timeframe. It has reached the lower boundary and is heading towards a breakout, with a retest of the upper boundary expected.
The Relative Strength Index (RSI) is showing a downward trend, approaching the lower boundary, and an upward bounce is anticipated.
There is a key support zone in green at 97.05, and the price has bounced from this level several times. Another bounce is expected.
The RSI is showing a trend towards consolidation above the 100-period moving average, which we are approaching, supporting the upward move.
Entry Price: 101.80
Target 1: 103.95
Target 2: 106.65
Target 3: 109.93
Stop Loss: Below the green support zone.
Remember this simple thing: Money management.
For any questions, please leave a comment.
Thank you.

#SOL/USDT Final Liquidity Zone Before Expansion ?#SOL
The price is moving within a descending channel on the hourly timeframe. It has reached the upper boundary and is heading towards breaking it. A retest of this boundary is expected.
The Relative Strength Index (RSI) is showing an upward trend, as it has approached the upper boundary. A bearish reversal is expected.
There is a key support zone in green at 114.50. The price has bounced from this zone several times and is expected to bounce again.
A consolidation trend is observed above the 100-period moving average, which we are approaching. This trend supports a decline towards this level.
Entry Price: 116.78
Target 1: 117.96
Target 2: 119.91
Target 3: 122.82
Stop Loss: Above the green support zone.
Don't forget one simple thing: Money Management.
For any questions, please leave a comment.
Thank you.

SOLUSDT Bullish Trade Idea on 4hr TFSOLUSDT Bullish Trade Idea on 4hr TF
- Bullish Divergence
- Falling Wedge broken
- Alligator opening mouth towards upside
Simple 1:3RR Trade. Let's see

SOL/USDT: Respecting the Structural Supply LineThe Macro Context Solana (SOL) continues to navigate a prolonged corrective phase on the Daily timeframe. The price action is strictly defined by a multi-month Descending Trendline, which acts as the dynamic "governor" of the current trend. Every attempt to rally into this diagonal structure has been met with supply (selling pressure), confirming its validity as a key resistance zone.
Why this setup is on our radar:
Trendline Adherence: The chart exhibits a clean series of lower highs, with the trendline connecting the liquidity peaks perfectly. The recent rejection near this structure confirms that sellers are still defending this zone aggressively.
Momentum Gatekeeper: This diagonal resistance is the line in the sand. As long as the price trades below this level, the market remains in a corrective structure. A "Change of Character" (ChoCh) can only be considered once this ceiling is breached.
Correction vs. Reversal: We are distinguishing between a "rally" and a "reversal." Current upside moves are merely relief rallies within a bearish context until proven otherwise by a structural breakout.
Technical Levels & Plan:
Watch Zone (Resistance): The immediate resistance is the descending trendline itself (dynamic level, currently acting around 135 - 140).
Invalidation Level (Bullish Shift): The bearish/corrective bias would be invalidated ONLY if we see a sustained Daily close above the trendline. This would shift momentum and open the door for higher valuations.
Structural Levels (Downside/Support): Immediate Support: 110 - 115 (Recent consolidation base) Major Structural Floor: 95 - 98 (Yearly Range Lows)
Macro / Moonbag: Structural expansion towards 160+ and beyond is conditional on reclaiming the trendline first.
Risological Note: We do not anticipate the breakout; we wait for it. Buying at resistance is a low-probability play. We remain observers until the structure shifts.
Disclaimer: This analysis is for educational purposes only. Crypto assets are highly volatile. This is not financial advice.
And if you would like to know my trading setup, check out the links below.

Solana question: $160 or $95?Boost this post if you believe $160 will be HIT sooner than $95
Reply "No" if you believe $95 will be HIT before $160
Let's find out what people think!

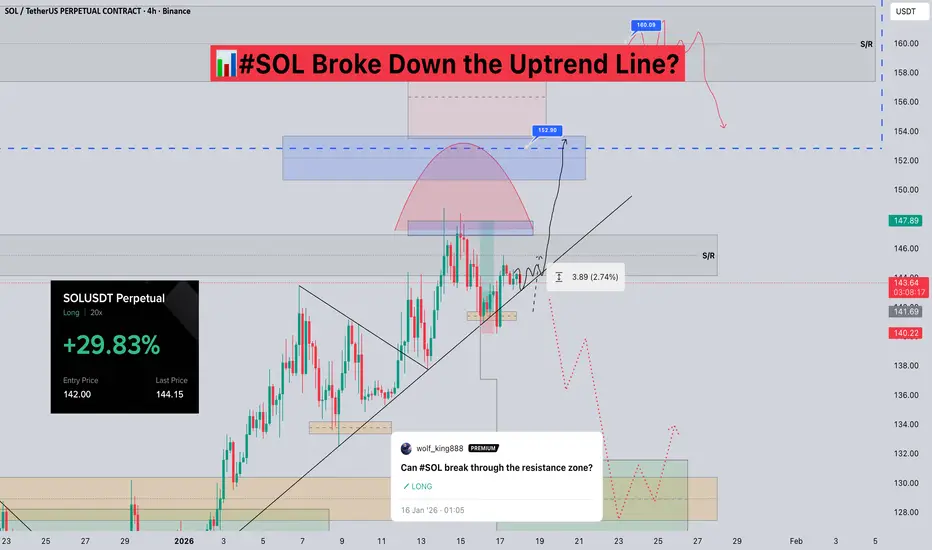
#SOL Broke Down the Uptrend Line?📊#SOL Broke Down the Uptrend Line?
🧠Looking at the 4-hour chart, we have indeed broken below the uptrend support line. However, we haven't continued to break strongly through the resistance zone (S/R), so we need to be wary of a potential correction.
➡️I'm still holding my long positions entered near the uptrend support line, hoping for a breakout above the S/R to 152-160.
⚠️Note the contradiction here, so I'm choosing to hold risk-free and wait for the market to determine the outcome. If your position is relatively large and you're currently seeing good profits, you could conservatively reduce your holdings.
🤜If you like my analysis, please like💖 and share💬
BINANCE:SOLUSDT.P
#SOL/USDT Final Liquidity Zone Before Expansion ?#SOL
The price is moving within a descending channel on the hourly timeframe. It has reached the lower boundary and is heading towards a breakout, with a retest of the upper boundary expected.
The Relative Strength Index (RSI) is showing a downward trend, approaching the lower boundary, and an upward bounce is anticipated.
There is a key support zone in green at 132. The price has bounced from this level several times and is expected to bounce again.
The indicator is showing a trend towards consolidation above the 100-period moving average, which we are approaching, supporting the upward move.
Entry Price: 133.50
First Target: 134.93
Second Target: 137.30
Third Target: 140.25
Stop Loss: Below the green support zone.
Remember this simple thing: Money management.
For any questions, please leave a comment.
Thank you.

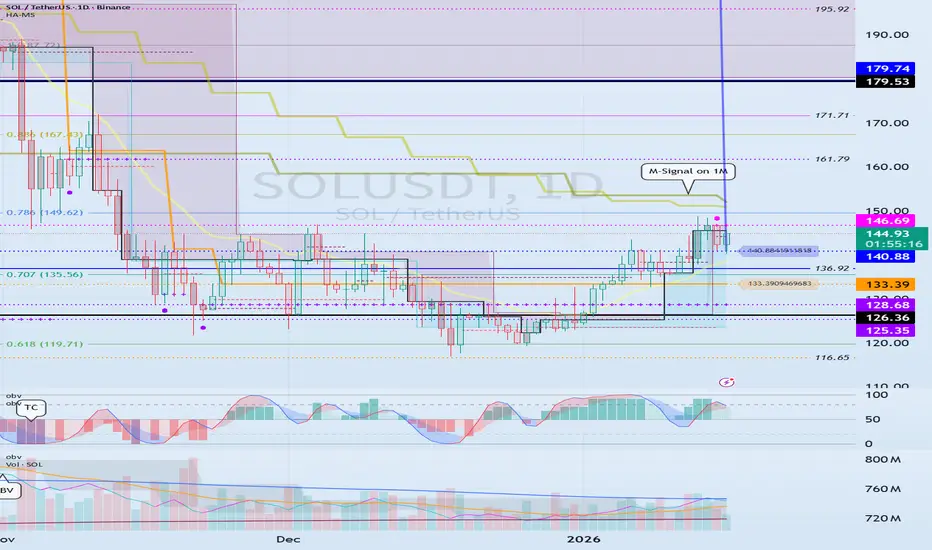
Support and Resistance Area: 140.88-146.69
Hello, traders!
Follow us to get the latest information quickly.
Have a great day!
-------------------------------------
(SOLUSDT 1D Chart)
SOLUSDT is entering a new phase with the emergence of the DOM(60) and HA-High indicators.
Accordingly, the key question is whether the price can rise while gaining support near the 140.88-146.69 level.
If not, it could fall below the 128.66-133.39 level and set a new low.
A decline below the M-Signal indicator on the 1M chart is highly likely to trigger a downtrend, so caution is advised when trading.
Therefore, we should set a buy point when the price rises above the M-Signal indicator on the 1M chart and maintains its level.
Since BTCUSDT's volatility period is around January 20th, we should monitor whether the price can rise above the M-Signal indicator on the 1M chart after this period.
-
To continue the uptrend by breaking above a key point or level, the StochRSI, TC, and OBV indicators must show upward trends.
If possible,
1. The StochRSI indicator should not have entered an overbought zone. 2. The TC indicator should remain above the 0 level.
3. The OBV indicator should remain above the High Line.
Looking at the current auxiliary indicators, we can see that the conditions for a sustained uptrend are not met.
Therefore, we should examine whether the conditions for a sustained uptrend can be met around the 140.88-146.69 range.
-
Thank you for reading to the end.
We wish you successful trading.
--------------------------------------------------
Can #SOL break through the resistance zone?📊Can #SOL break through the resistance zone?
🧠From a structural perspective, it's reasonable for us to encounter resistance and consolidate here. If the uptrend continues, then we can expect to see 152-160.
🤜If you like my analysis, please like💖 and share💬 BINANCE:SOLUSDT.P

#SOL/USDT Final Liquidity Zone Before Expansion ?#SOL
The price is moving within a descending channel on the hourly timeframe. It has reached the lower boundary and is heading towards a breakout, with a retest of the upper boundary expected.
The Relative Strength Index (RSI) is showing a downward trend, approaching the lower boundary, and an upward bounce is anticipated.
There is a key support zone in green at 142.67, and the price has bounced from this level several times. Another bounce is expected.
The RSI is showing a trend towards consolidation above the 100-period moving average, which we are approaching, supporting the upward move.
Entry Price: 145.00
First Target: 145.80
Second Target: 147.77
Third Target: 150
Stop Loss: Below the green support zone.
Remember this simple thing: Money management.
For any questions, please leave a comment.
Thank you.

SOL/USDT – This Reclaimed Level Could Send SOL Flying Again#SOL has finally reclaimed a major resistance zone, now acting as strong support. This level previously rejected price hard, and the successful reclaim signals a potential trend continuation.
Momentum is clearly shifting bullish, and as long as price holds above this reclaimed zone, the upside scenario remains highly favored. This is the type of structure that often leads to fast expansions once liquidity above gets targeted.
Bias: Bullish continuation
Invalidation: Loss of the reclaimed support zone
📊 Risk/Reward: 1:2
⚠️ DYOR (Do Your Own Research)

#SOL/USDT IS AT DECISIVE POINT! WHO WILL WIN? BULLS OR BEARS?SOL/USDT – Daily Outlook
SOL is attempting a trend shift after forming a higher low near the lower boundary of the descending channel. Price has bounced with strength and is now trading above the short-term moving averages.
The 13 EMA (green) is leading the move and has crossed above the 21 EMA (blue), which typically signals improving momentum and short-term trend reversal. As long as price holds above these EMAs, bulls remain in control.
🔑 Major Resistance Zone:
$155–158 → a strong resistance cluster formed by prior support-turned-resistance and EMA congestion.
📈 Bullish Scenario:
A daily close above $158 would confirm a breakout and trend continuation, opening the path toward $175–180, followed by $ 190 or higher if momentum sustains.
⚠️ Risk / Invalidation:
Rejection from $155–158 may lead to short-term consolidation or a pullback toward $133 to 127.
Overall, the structure is constructive, momentum is improving, and $158 remains the key trigger level for the next leg higher.
If you like this chart, do hit the like button and share your views in the comments.
Thank you
#PEACE

#SOL/USDT may continue its trend after correction#SOL
The price is moving in a descending channel on the 1-hour timeframe. It has reached the upper limit and is heading towards breaking it. A retest of the upper limit is expected.
We have an upward trend on the RSI indicator, which has reached near the upper limit. A downward reversal is expected.
There is a key support zone in green at 139.70. The price has bounced from this zone multiple times and is expected to bounce again.
We have a trend of consolidation above the 100-period moving average, as we are moving close to it. This supports a downward move towards touching this level.
Entry price: 137.70
First target: 136.15
Second target: 135.09
Third target: 133.66
Stop loss above the resistance zone in green.
Don't forget a simple thing: money management.
For inquiries, please leave a comment.
Thank you.

#SOL Key S/R📊#SOL Key S/R 🔔
🧠From a structural perspective, the ideal target area for the bullish structure built within the green buy zone has not yet been reached, which is the heavy resistance zone of the gray S/R above. Therefore, we still have a chance to rise, so there's no rush to short. It's safer to wait for a price breakout before looking for shorting opportunities.
➡️If it doesn't choose to break upwards and instead experiences a pullback, then the yellow support zone will be very worthy of our attention. We can look for long trading opportunities here.
Let's see 👀
🤜If you like my analysis, please like 💖 and share 💬
BINANCE:SOLUSDT.P

#SOL/USDT Final Liquidity Zone Before Expansion ?#SOL
The price is moving in a descending channel on the 1-hour timeframe. It has reached the lower boundary and is heading towards a breakout, with a retest of the upper boundary expected.
We are seeing a bearish bias in the Relative Strength Index (RSI), which has reached near the lower boundary, and an upward bounce is expected.
There is a key support zone in green at 128, and the price has bounced from this level several times. Another bounce is expected.
We are seeing a trend towards stabilizing above the 100-period moving average, which we are approaching, supporting the upward trend.
Entry Price: 133
First Target: 134
Second Target: 137
Third Target: 140
Remember a simple principle: Money Management.
Place your stop-loss order below the green support zone.
For any questions, please leave a comment.
Thank you.

Solana (SOL) — 15m Local Bullish StructureHello, friends!
How did you celebrate the New Year? 🎉
I wish everyone a productive and profitable 2026!
I haven’t posted ideas on TradingView for a few weeks, but I’ve decided that starting from the very first day of 2026, I’ll be sharing ideas daily.
So here is my first one:
Despite my previous bearish outlook, Solana looks quite positive on the local timeframe right now 🐂
After a small pullback to the 124.76 area, I’m considering long positions.
🎯 Targets:
• 127.5
• 130
❌ Invalidation:
Any touch of 124.69 fully invalidates this setup.
As always, manage your risk and stay tuned for updates. 🚀

SOL/USDT – Accumulation or Continuation? Key Support!SOL/USDT on the 8-hour timeframe is still moving within a bearish corrective structure / broader downtrend, characterized by a series of lower highs and lower lows since the rejection from the 230+ area.
Currently, price is trading inside a strong historical demand zone at 127–121, which previously acted as a major accumulation and bounce area.
Price is now consolidating above this demand zone while pressing against a descending trendline, making this area a critical decision zone for the next major move.
---
Pattern & Price Structure
1. Descending Trendline (Bearish Pressure)
The descending trendline remains valid and unbroken
Each recovery move continues to be capped by this trendline
Indicates seller dominance is still present
2. Demand Zone / Support Base (127 – 121)
The yellow box marks a strong demand zone
Multiple lower-wick rejections indicate active buying interest
Price is forming a base / consolidation range above support
3. Compression Pattern (Range Tightening)
Price is compressed between:
Dynamic resistance (descending trendline)
Static support (demand zone)
This structure often leads to a high-momentum breakout
---
Key Levels
Dynamic Resistance: Descending trendline
Horizontal Resistances:
144
154.5
167
177
Major Support:
127
121
Invalidation Level:
Strong close below 121
---
Bullish Scenario
The bullish scenario is valid if:
1. Price holds above the 127–121 demand zone
2. A strong candle close breaks above the descending trendline
3. Volume expansion confirms the breakout
Upside Targets:
144 (minor resistance)
154.5 (key reaction level)
167 (mid-range resistance)
177 (major resistance)
A confirmed breakout above the trendline may signal a trend reversal or bullish continuation from a base structure.
---
Bearish Scenario
The bearish scenario occurs if:
1. Price fails to break the descending trendline
2. A strong breakdown and close below 121
3. The demand zone fails to absorb selling pressure
Downside Risk:
116.8 (previous low)
Further downside could form new lower lows, continuing the broader bearish trend
---
Conclusion
SOL/USDT is currently at a critical decision area.
The 127–121 demand zone is the key level to watch:
Holding support + trendline breakout → bullish reversal potential
Demand breakdown → bearish continuation
Patience is required. Wait for clear breakout or breakdown confirmation before committing to a directional trade.
---
#SOLUSDT #Solana #CryptoAnalysis #TechnicalAnalysis #DescendingTrendline #DemandZone #SupportResistance #AltcoinTrading #CryptoMarket

#SOL/USDT Final Liquidity Zone Before Expansion ?#SOL
The price is moving in a descending channel on the 1-hour timeframe. It has reached the lower boundary and is heading towards breaking above it, with a retest of the upper boundary expected.
We have a downtrend on the RSI indicator, which has reached near the lower boundary, and an upward rebound is expected.
There is a key support zone in green at 122.00. The price has bounced from this level multiple times and is expected to bounce again.
We have a trend towards stability above the 100-period moving average, as we are moving close to it, which supports the upward movement.
Entry price: 124.00
First target: 125.48
Second target: 127.15
Third target: 129.63
Stop loss: Below the support zone in green.
Don't forget a simple thing: capital management.
For inquiries, please leave a comment.
Thank you.
