Support around 212.91 is crucial
Hello, fellow traders.
By "Following," you'll always get the latest information quickly. Have a great day today.
-------------------------------------
(SOLUSDT 1W Chart)
The chart may look complicated due to the drawn lines, but the key is whether the price can rise above the boxed area.
In other words, whether the price can rise above the 179.53-237.60 range and maintain its upward momentum is crucial.
-
(1D Chart)
The HA-Low indicator on the 1D chart is showing signs of forming at the 212.91 level.
Therefore, if support is confirmed around 212.91, it would be a good time to buy.
However, the HA-High ~ DOM (60) range has formed in the 236.88-237.60 range, so we need to see if it can break above this range.
If the upward breakout fails, it's time for a partial sell-off.
-
To continue the uptrend by breaking above a key zone or point,
1. The StochRSI indicator must be trending upward. If possible, it should be below the overbought level.
2. The On-By-Value (OBV) indicator must be trending upward. If possible, it should remain above the High Line.
3. The TC (Trend Check) indicator must be trending upward. If possible, it should remain above the 0 level.
If the above conditions are met, the uptrend is likely to continue.
-
Thank you for reading to the end.
I wish you successful trading.
--------------------------------------------------
SOLUSDTPERP

SOL/USDT – Daily OutlookAfter forming a potential harmonic structure, SOL seems to be following a corrective path from point B (0.789 Fib) toward a possible C leg around the 0.886 retracement zone — an area that could act as a strong support.
If the pattern completes, we might see a bullish reaction from that zone, targeting:
1st Target: 345.5 USDT (1.27 Fib extension)
2nd Target: 412 USDT (1.618 Fib extension)
However, failure to hold near the C zone could lead to deeper retracements before any significant reversal.
📊 Overall, I’m watching for a confirmed bounce at C before considering long positions.
#SOLUSDT #HarmonicPattern #CryptoAnalysis #TradingView

Solana Faces Bearish Pressure Below $190 SupportHi everyone!
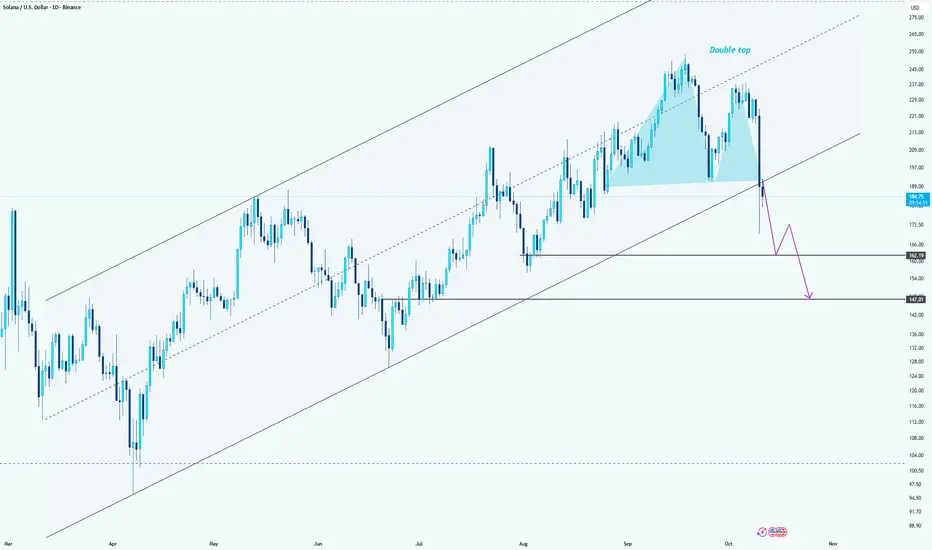
Solana appears to be forming a double top pattern near the $250 zone, signaling potential bearish momentum. After failing to sustain above the upper channel resistance, the price broke below the midline support, confirming short-term weakness.
Currently, SOL is retesting the neckline area around $190. If it fails to reclaim this level, further downside is likely. The next key support zones lie around $165 and $147, aligning with the previous structure and the lower channel boundary.
A clean break below $165 would likely accelerate the move toward $147, confirming a deeper correction within the broader ascending channel.
Bias: Bearish below $190
potential targets at $165 → $147.
BUY AND HOLDHello friends
Due to Solana's ATH and the Solana network becoming wider every day, big money is entering this currency, and considering the pullback we made, it is a good opportunity to enter with risk capital management and buy in steps in the specified areas.
Note that the holding period is at least 3 months, so be patient and observe capital management.
*Trade safely with us*

SOLUSDTSOLUSDT
I expect the price to go to 250 zone, the latest hh and if the price is not making a new hh then i expect the price to go down to 212 zone and bounce from there if the support stay.

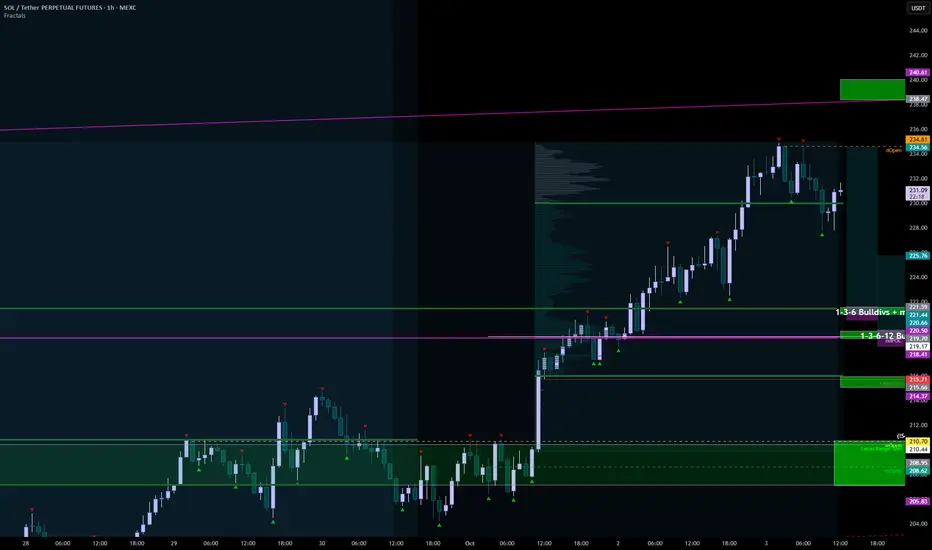
SOL 03.10At 3 AM (when else, only when we're sleeping) R1 reacted, with weakness in beardivs + mfd divs 1-3-6-12-24m, and corrected by 3%.
BUT
1) they left almost equivalent positions,
2) the daily session closed almost without a shadow above,
3) there are no diversifiers on the indicator, and there are fat mfds on mfd 1h and higher.
I think we'll go to 240, but there's a slight correction right now. At 240, it will be possible to part-take profit from the main long from 192. But how and when we'll get there is unclear. If Bitcoin starts to move into the 117-115 zones today within the console, Salt could even move from the current levels to the key support zone around 210, but for now, it needs to lose another 220 and 216 to do so.
Support zones:
221-221.5
219-219.6
215-215.9
207-210.7
Resistance zones:
238.4-240
255-256.4
Support near 222.61 is key
Hello, fellow traders!
Follow us to get the latest information quickly.
Have a great day!
-------------------------------------
(SOLUSDT 1D chart)
There are many lines drawn, but the important area is ultimately the 179.74-247.50 range.
Among these, a rise above 236.88-247.50 is necessary for a stepwise uptrend to continue.
The key is whether the current 202.45-222.61 range, i.e. the DOM (60) ~ HA-High range on the 1W chart, can provide support and allow for an upward movement.
Therefore, based on the 202.45-222.61 range, we need to monitor whether the price rises above 236.88-247.50 or falls below 179.74.
-
To break through this critical point or range and continue the uptrend,
- The StochRSI indicator must be trending upward. If possible, it should be below the overbought level.
- The On-By-Significant Volume indicator must be trending upward. If possible, it should remain above the High Line.
- The TC (Trend Check) indicator must be trending upward. If possible, it should remain above the 0 level.
-
Thank you for reading to the end.
I wish you successful trading.
--------------------------------------------------

SOLUSDT ShortedWe saw a free fall for SOLUSDT, which can touch around 210-20,5, taking a short position with a risk of 10$ and RR of 1:4. Risk Management is more important than trading RM first trading next

#SOL/USDT bullish structure formed at the chart#SOL
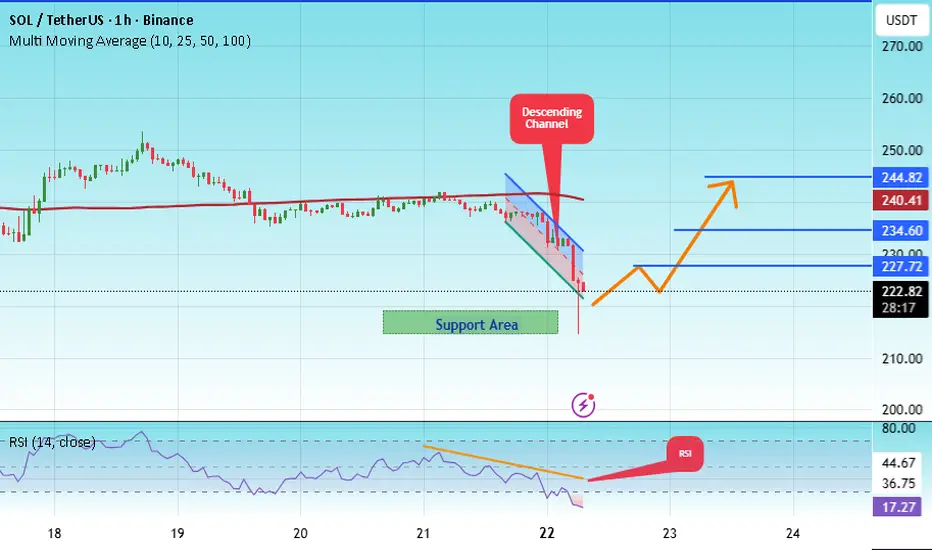
The price is moving within a descending channel on the 1-hour frame, adhering well to it, and is heading for a strong breakout and retest.
We have a bearish trend on the RSI indicator that is about to be broken and retested, which supports the upward move.
There is a major support area in green at 216, which represents a strong support point.
We are heading for consolidation above the 100 moving average.
Entry price: 218
First target: 227
Second target: 234
Third target: 244
Don't forget a simple matter: capital management.
When you reach the first target, save some money and then change your stop-loss order to an entry order.
For inquiries, please leave a comment.
Thank you.
SOL AGAIN/;Hello friends
You see that the price is stuck in a trading range and you must know that 80% of failures in trading ranges are fake!
Now, as the trading range lengthens, we can finally wait for its failure, and if it fails, the price will move by the same amount as the trading range.
*Trade safely with us*

#SOL/USDT bullish structure formed at the chart#SOL
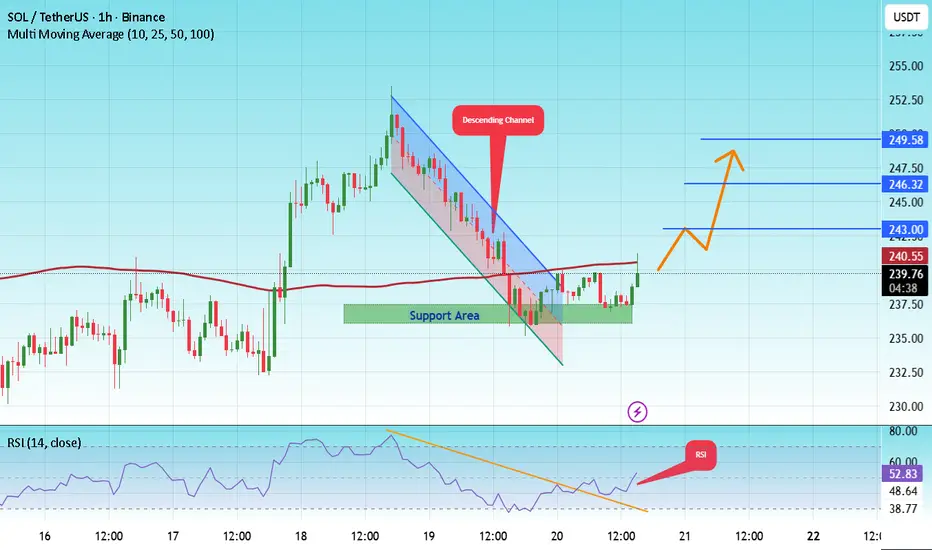
The price is moving in a descending channel on the 1-hour frame and is expected to break and continue upward.
We have a trend to stabilize above the 100 moving average again.
We have a downtrend on the RSI indicator that supports the upward move with a breakout.
We have a major support area in green that pushed the price higher at 236.
Entry price: 240.
First target: 243.
Second target: 246.
Third target: 249.
To manage risk, don't forget stop loss and capital management.
When you reach the first target, save some profits and then change your stop order to an entry order.
For inquiries, please comment.
Thank you.
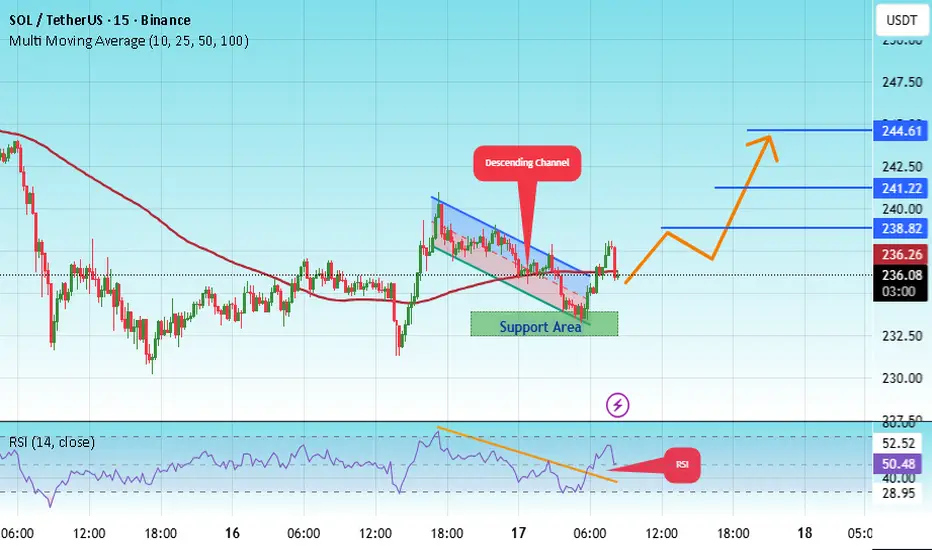
#SOL/USDT bullish structure formed at the chart#SOL
The price is moving within a descending channel on the 1-hour frame, adhering well to it, and is heading for a strong breakout and retest.
We have a bearish trend on the RSI indicator that is about to be broken and retested, which supports the upward breakout.
There is a major support area in green at 233, representing a strong support point.
We are heading for consolidation above the 100 moving average.
Entry price: 236
First target: 238
Second target: 241
Third target: 244
Don't forget a simple matter: capital management.
When you reach the first target, save some money and then change your stop-loss order to an entry order.
For inquiries, please leave a comment.
Thank you.
SOLANA UPDATEHello friends🙌
📉Given the decline we had, you can see that buyers came in and supported the price and were able to change the trend and create an ascending channel.
📈Now, considering that the price is hitting higher ceilings and floors, we can expect an ascending wave until the ceiling of the channel.
Don't forget risk and capital management.⚠
🔥Follow us for more signals🔥
*Trade safely with us*
Up or down?Hello friends
Well, considering the growth we had, the analysis of which we have already given you and it was full target, now we needed to go for another update.
Well, considering the price growth, there is an important resistance area on our way that they have determined for us.
If this resistance is validly broken, the price can move to the specified targets, but what if the price cannot break the resistance?
Well, don't worry, we have another scenario where if the price fails to break the resistance and falls, we have identified good support areas that if reached, the price can grow well to the set targets. Finally, it must be said that given the large number of buyers and the buying pressure we have in Solana, sooner or later, I think this resistance will be broken and we will see higher numbers.
*Trade safely with us*

SOL BREAKS OUT We can easily see a bullish breakout from SOL/USDT , this is one of the most basic price action where in the coins breakout and retest the upper trendline . Now in the current scenario we are targeting the previous resistance clusters and also bitcoin seems pretty bullish here.

SOLUSDTThis is a bullish setup for BINANCE:SOLUSDT , but the $230 level is crucial for potential reactions. My strategy is to stay bullish and wait for the upcoming US CPI news, then decide whether to buy or sell CRYPTOCAP:SOL based on the news.
⚠️Ensuring your position size aligns with your risk tolerance.

Solana's Price Coils in Rare Bullish FormationSolana's Price Coils in Rare Bullish Formation, Hinting at a Potential Rally to $230
Solana (SOL) has captured the attention of the cryptocurrency market, with its price charting a course that suggests a significant upward movement may be on the horizon. After a robust gain over the past month and a powerful rebound from its recent lows, the high-performance blockchain's native token is trading within a classic technical pattern known as a symmetrical triangle. A decisive breakout from this formation could propel SOL towards a price target of $230 in the coming days, a move supported by strengthening on-chain metrics, resurgent NFT market activity, and bullish sentiment in the derivatives market.
The digital asset has shown considerable strength, rallying to intraday highs well above the $200 mark before stabilizing. This price point not only marks a significant recovery but also positions SOL tantalizingly close to the upper boundary of its consolidation pattern. This technical setup, combined with strong fundamental tailwinds, is creating a compelling narrative for a potential bullish continuation.
The Anatomy of a Bullish Setup: The Symmetrical Triangle
At the heart of the current bullish thesis for Solana is the formation of a symmetrical triangle on its price chart, a pattern that has been developing over recent weeks. In technical analysis, a symmetrical triangle is characterized by two converging trendlines—one descending line connecting a series of lower highs and one ascending line connecting a series of higher lows. This pattern visually represents a period of consolidation and indecision in the market, where the trading range tightens and volatility contracts. It signifies a temporary equilibrium between buyers and sellers, often preceding a significant price move or "breakout."
While a symmetrical triangle is technically a continuation pattern—suggesting the price will likely resume the trend it was in prior to the triangle's formation—it can break in either direction. However, for Solana, which has been in a broader uptrend, a breakout to the upside is the more anticipated outcome. Analysts are closely watching for a decisive close above the triangle's upper trendline, ideally accompanied by a spike in trading volume, which would serve as confirmation of the breakout.
Multiple analyses converge on a significant price target should this breakout occur. The height of the triangle at its widest point, projected upward from the breakout point, suggests a potential rally that could take SOL to the $230 mark. Other technical strategists have identified targets in a similar range, with some pointing to the $230-$235 area and others looking at a near-term pivot range that could open the path toward higher targets.
Strengthening this possibility are key momentum indicators. The Moving Average Convergence Divergence (MACD), a popular trend-following indicator, has shown its primary line crossing above its signal line, a classic sign of a strengthening uptrend and building bullish momentum.
The Road to Recovery: A Powerful Rebound Ignites Momentum
Solana's current consolidation does not exist in a vacuum. It follows a period of impressive recovery that has renewed investor confidence. After dipping to a notable low in the preceding month, SOL has mounted a formidable comeback of over 30%. This rebound demonstrates strong buying pressure at lower price levels and has established a solid foundation for the current market structure.
Over the past month alone, SOL has registered a double-digit percentage increase in value, a period during which the symmetrical triangle began to take shape. This price action suggests that the recent consolidation is a healthy pause, allowing the market to digest recent gains before a potential next leg up. The series of higher lows established since late August is particularly constructive, indicating that buyers remain active and are stepping in to defend key support levels.
The cryptocurrency is currently consolidating above a critical support level in the high $190s. This price zone is considered highly significant by on-chain analysts, as a massive volume of tokens has historically been traded at this level, creating a strong foundation of support that bulls are actively defending.
Beyond the Charts: Fundamental Tailwinds Gathering Strength
While the technical picture is compelling, a confluence of fundamental factors is adding significant weight to the bullish case for Solana.
The NFT Ecosystem Reawakens
A notable catalyst has been a sharp resurgence in activity within Solana's non-fungible token (NFT) ecosystem. In a recent notable 24-hour window, sales volume for Solana-based NFTs experienced a dramatic spike, more than doubling from the previous day's figures and reaching well into the millions of dollars. This surge propelled Solana to become the second-largest NFT market globally by daily sales volume, trailing only Ethereum.
This spike was largely driven by the explosive popularity of certain new collections, which saw their daily sales volumes skyrocket by orders of magnitude. Other collections also posted significant gains. While the broader NFT market has seen fluctuations, Solana's performance showcases a notable relative strength and a growing appeal for its high-speed, low-cost architecture among NFT creators and collectors. This renewed retail and speculative interest in Solana's NFT scene could be a powerful driver of market momentum.
Bullish Bets in the Derivatives Market
Sentiment among professional traders, especially in the derivatives market, has shifted decisively toward a bullish outlook. Open interest in SOL futures, which represents the total value of all outstanding futures contracts, has seen a substantial increase over the past month, climbing by several billion dollars. This indicates a high degree of speculative interest and suggests a growing number of traders are positioning for a future price increase.
Furthermore, SOL's weighted funding rate has remained consistently positive for an extended period. The funding rate is a mechanism used by perpetual futures exchanges to keep the contract price in line with the spot price. A positive funding rate indicates that traders holding long positions are paying a premium to those holding short positions, a clear sign that the prevailing sentiment is bullish and traders expect the price to continue rising.
The Institutional Stamp of Approval
A steady drumbeat of institutional adoption continues to provide a strong fundamental floor for Solana's valuation. The launch and subsequent inflows into Solana-focused Exchange-Traded Funds (ETFs) in North America have signaled growing confidence from traditional finance. These products have seen millions of dollars in inflows on strong trading days.
This trend extends to corporate treasuries. The listing of Solana-focused companies on major stock exchanges, holding significant amounts of SOL tokens, brings considerable Wall Street exposure to the asset. This institutional demand, coupled with whale accumulation, where large holders have been observed adding to their positions, provides a powerful source of buying pressure.
The Alpenglow Upgrade
Adding to the long-term bullish case is the anticipated Alpenglow network upgrade. Approved by an overwhelming majority of validators, this upgrade is set to slash transaction finality times significantly, bringing them down to a fraction of a second. This enhancement would provide Solana with Web2-level settlement speeds, dramatically increasing its competitiveness in high-frequency applications like decentralized finance (DeFi) and gaming, and potentially driving a new wave of developer and user adoption.
Navigating the Hurdles: Resistance and Risks on the Horizon
Despite the overwhelmingly bullish confluence of factors, investors should remain aware of the potential risks and key resistance levels that lie ahead. The symmetrical triangle, until a breakout is confirmed, remains a pattern of indecision. A break below the lower support trendline could invalidate the bullish thesis and trigger a move to the downside, with potential targets at lower support levels.
Even with an upward breakout, the path to $230 is not without obstacles. Solana faces immediate resistance in the zone just above its current trading range, an area that has been tested multiple times. A more significant band of resistance is anticipated in the range between $210 and $250, where sellers may look to take profits.
Furthermore, some on-chain metrics suggest that while momentum is building, some long-term holders may be taking the opportunity to distribute their holdings, which could create selling pressure. The broader cryptocurrency market remains subject to volatility, and a downturn in major assets like Bitcoin or Ethereum could negatively impact altcoins like Solana, regardless of their individual technical and fundamental strength.
Conclusion
Solana currently presents one of the most compelling risk-reward setups in the cryptocurrency market. The formation of a rare symmetrical triangle on its price chart, following a powerful rebound, has laid the technical groundwork for a potential rally toward $230. This bullish structure is not merely a product of chart patterns; it is underpinned by a potent combination of fundamental drivers. A re-energized NFT ecosystem, overwhelmingly positive sentiment in the derivatives market, growing institutional adoption, and a landmark network upgrade on the horizon all contribute to a powerful narrative of growth and expansion.
While traders and investors must remain vigilant of key resistance levels and the inherent risks of the crypto market, the evidence suggests that Solana is coiling for a potentially explosive move. A confirmed breakout in the coming days could validate the bullish setup and send SOL on the next major leg of its upward journey, solidifying its position as a leading blockchain platform for the future of decentralized applications.

"SOL: Drop from $201 ""
On August 30, Solana turned downward on the 4-hour chart around the $201 area. The move was precise and steady: price reached $197, giving a potential difference of about $5 per coin. The trade was closed according to plan, and the result was secured.
The real value here isn’t just in the profit, but in the process. The algorithm guided the trade step by step: marking profit-taking zones, helping to manage risk, and maintaining discipline. This removes chaotic decisions and turns trading into a structured process.
For experienced traders, such a tool works as an accelerator: it reduces routine analysis, speeds up decision-making, and eliminates emotional mistakes. Instead of constant doubts about where to take profit or whether to keep holding, the focus shifts to following rules and working within a clear system.
The market will always move unpredictably. But when there’s an algorithm highlighting structure and managing trades in stages, trading stops being chaos and becomes disciplined work."

SOLUSDT NEXT MOVE.SOLUSDT is expecting rejection from current supply zone and it better for short trade, and expecting towards green demand area of liquidity where we can book profit of Short and take long position.

From Rocket to Rock: Solana’s Gravity CheckCRYPTOCAP:SOL may reach $262 as network adoption accelerates and throughput metrics hit new highs, but market dynamics are rarely linear. Cyclical retracements below $100 remain a distinct possibility, reflecting the interplay between speculative sentiment, ecosystem development, and the inherent volatility of high-performance blockchain networks.

The key is whether it can rise above 237.60
Hello, fellow traders!
Follow us to get the latest information quickly.
Have a great day.
-------------------------------------
(SOLUSDT 1M Chart)
To understand the strangely drawn trendline, you need to refer to the StochRSI indicator.
This is because the StochRSI indicator was used to draw the trendline.
When the K indicator of the StochRSI forms a peak in the overbought zone, a trend line is drawn by connecting those peaks. When the K indicator forms a peak in the oversold zone, a trend line is drawn by connecting those peaks.
When drawn this way, the trend line drawn in the overbought zone becomes the high trend line, and the trend line drawn in the oversold zone becomes the low trend line.
However, due to the long timeframe of the 1M chart, the high and low trend lines are not separated and are instead displayed as a single line.
Of the three trend lines, we need to determine whether the upward trend can continue along trend line (1).
The DOM (60) indicator is forming at 237.60, so the key question is whether it can break above this level.
Illegible areas are marked with circles.
-
(1W Chart)
Looking at the explanation of the big picture below, a major bear market is expected to begin in 2026.
However, the trend lines drawn on the chart suggest that the upward trend could continue until the first quarter of 2026.
With time remaining until the end of 2025, we need to closely monitor BTC's movements.
The DOM (60) indicator on the 1M chart is at 237.60, so the key question is whether it can break above 237.60 and maintain its price.
However, the DOM (60) ~ HA-High range formed in the 202.45-222.61 range on the 1W chart, so whether it can find support within this range is crucial.
Accordingly, the volatility period on the 1W chart is the period around the week of September 29th, i.e., September 22nd to October 5th.
Please refer to the circled area on the 1M chart for the important period.
-
(1D chart)
This volatility period ends on August 29th.
The next volatility period will be around September 7th.
After the volatility period around September 7th, we need to see if the price remains above 195.92.
If the price remains above trendline (1), it is highly likely that an attempt to rise above 222.61 will occur.
---------------------------------
As mentioned earlier on the 1W chart, the key question is whether the price can rise above 237.60.
To draw a line, we need to examine whether the 202.45-222.61 range provides support and can move upward.
From this perspective, if the 202.45-222.61 range provides support, it's considered a buying opportunity.
However, considering the basic trading strategy, buying in the DOM(-60) ~ HA-Low range and selling in the HA-High ~ DOM(60) range is necessary, so we can see that this is actually a selling opportunity.
Therefore, executing a new purchase in the 202.45-222.61 range requires a short and quick response.
If you maintain a basic trading strategy, you can either sell in installments to gain psychological stability or choose to purchase additional shares when the 202.45-222.61 range provides support.
-
Some people argue that support and resistance aren't important, but rather whether the price will rise or fall.
Yes, I agree with this.
However, to move up or down, you need to understand the support and resistance points or ranges that serve as reference points.
If you can't distinguish between these, you won't be able to trade, regardless of whether the price is rising or falling.
Therefore, you need to evaluate how important the support and resistance points or ranges formed at the current price are.
If you don't understand this, you'll end up trading by buying late after the price has risen or selling late after the price has fallen.
-
Thank you for reading to the end.
I wish you successful trading.
--------------------------------------------------
- This is an explanation of the big picture.
(3-year bull market, 1-year bear market pattern)
I will explain in more detail when the bear market begins.
------------------------------------------------------

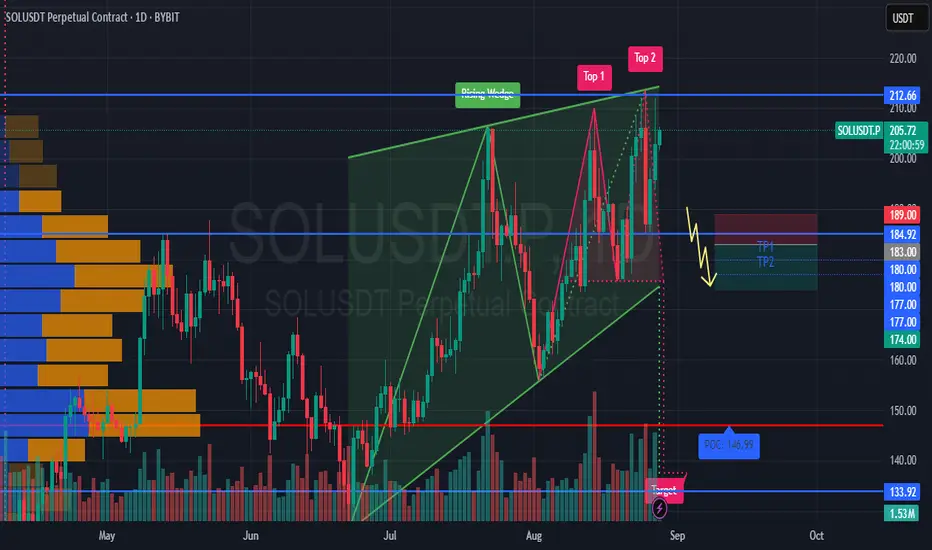
#SOLUSDT maintains a bearish setup📉 SHORT from $183.00
🛡 Stop loss $189.00
🕒 Timeframe: 1D
❗ If the price consolidates above $189, the setup becomes invalid.
⚡ Overview:
➡️ On the daily chart, a Rising Wedge has formed — a bearish pattern signaling potential reversal.
➡️ The $183.00 level is the key zone where the short scenario gets activated.
➡️ The POC at $146.99 remains a strong long-term magnet for price.
➡️ Increasing volumes on red candles confirm seller interest.
🎯 TP Targets:
💎 TP 1: $180.00
💎 TP 2: $177.00
💎 TP 3: $174.00
📢 Short entry is optimal from $183 with a clear stop at \$189.
📢 Focus on holding below $183 — this will confirm the bearish continuation.
📢 In the long term, if $174 breaks, the target could extend to the $147 (POC) zone.
🚀 #SOLUSDT maintains a bearish setup — as long as price holds below $183, expect a move toward $174 and potentially further downside.
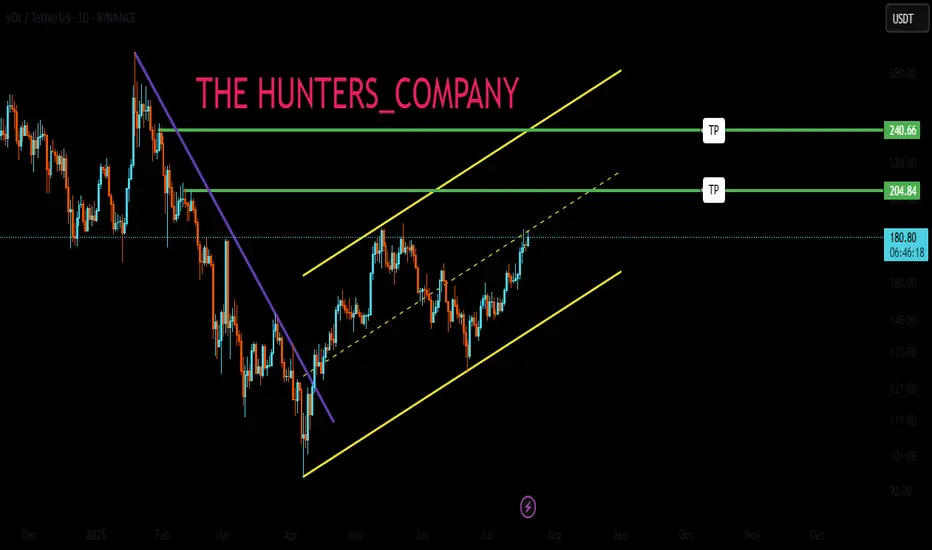
SOL : I want to shop in these areas.Hello friends
Well friends, after a few hunts for the channel, the buyers finally broke the channel and the task was clear.
Now, with the price growth and correction we had in the areas identified as channel price pivots, I want to buy and move with it to the specified targets.
*Trade safely with us*
