SOUN Weekly Calls: Bullish Flow + Weekly RSI Edge → 16C
# 🔊 SOUN Weekly Options Setup (8/18 – 8/22)
📈 **Market Sentiment**
* **Call/Put Ratio**: 1.87 → strong bullish flow 🐂
* **Daily RSI**: 69.3 (falling) → watch for short-term exhaustion
* **Weekly RSI**: 72.7 (rising) → confirms bullish weekly momentum
* **Volume**: Stable vs last week → caution, not confirming strong breakout
* **VIX**: 14.84 → low volatility, ideal for options
---
## 🎯 Trade Setup (Naked Call)
* **Instrument**: SOUN
* **Direction**: CALL (LONG)
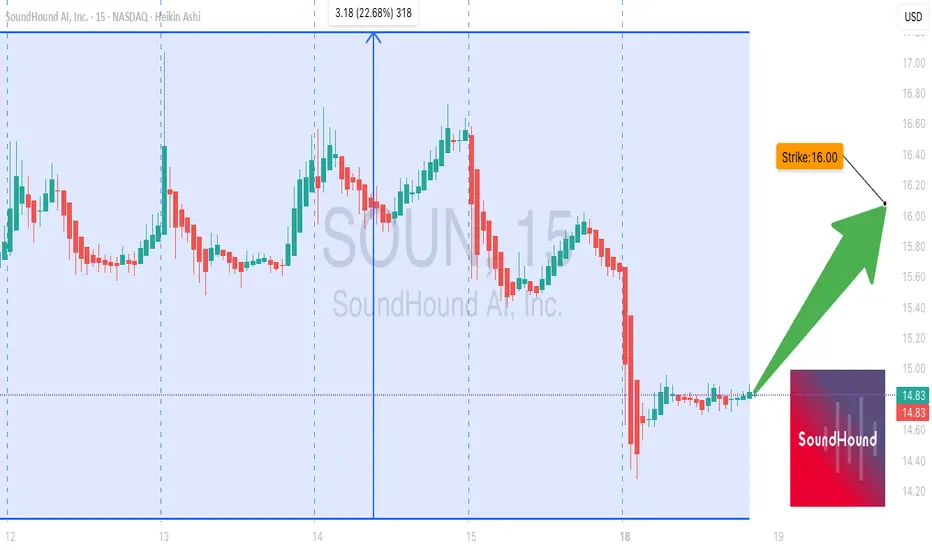
* **Strike**: \$16.00
* **Expiry**: 2025-08-22
* **Entry Price**: \$0.59
* **Profit Target**: \$0.90 – \$1.18 (\~50–100% gain)
* **Stop Loss**: \$0.30 (50%)
* **Size**: 1 contract
* **Confidence**: 65%
* **Entry Timing**: Market Open Monday
---
## 📈 Breakeven @ Expiry
👉 \$16.59 (Strike + Premium)
SOUN must **close > \$16.59 by 8/22** to profit at expiry.
Plan: exit early if momentum stalls due to falling daily RSI or weak volume.
---
## 🧠 Key Risks
* Stable volume → upside may stall
* Daily RSI falling → potential short-term pullback ⚠️
* Moderate gamma risk → monitor closely for early exits
---
# ⚡ SOUN 16C WEEKLY PLAY ⚡
🎯 In: \$0.59 → Out: \$0.90–\$1.18
🛑 Stop: \$0.30
📅 Exp: 8/22
📈 Bias: Moderate Weekly Bullish 🐂
---
📊 **TRADE DETAILS JSON**
```json
{
"instrument": "SOUN",
"direction": "call",
"strike": 16.0,
"expiry": "2025-08-22",
"confidence": 0.65,
"profit_target": 1.10,
"stop_loss": 0.30,
"size": 1,
"entry_price": 0.59,
"entry_timing": "open",
"signal_publish_time": "2025-08-18 09:03:41 UTC-04:00"
}
Sound
Shadow NoiseHere is cross-sectioned candlestick shadow and quantified amplitude of the shadow. The indicator marked with a horizontal ray identifies the "strength," or "intent," of the continuation tweezer pattern. Unfortunately, a trader should wait to put a bearish resistance under the tweezer support swing.

A trick to record video ideas in Tradingview great sound qualityIn this tutorial, I'll show you how to publish a video you've already made to TradingView with good sound quality.
You can also use this method to record sounds from other videos.
So you can easily make your video with software like OBS and publish it with good sound quality.
Also this method can be useful for those who have live stream or plan to create and record video ideas online on TradingView, when they want to play a video or an audio they have already prepared in good sound quality.
I hope the video was helpful and if you have any questions be sure to leave a comment so that I can help you.
Thank you!

BTC/USD: An amateur prediction/projection. (Jump ~June 14th)First post!
I'm a complete newb to trading & analysis, so please point out anything that looks stupid.
I've compared this pattern to multiple points in time and they nearly always have this oscillating zig-zag pattern before an uptrend. I looked at several points and traced them and I was suprised to find that where the projected lines of support & resistance cross is where the change in trend occurs - sometimes quite dramatically.
The zig-zag pattern looks to be a good source for support & resistance bands.
The head & shoulders pattern directly preceding the zig-zag appears to project a positive change in direction.
I've been looking at sound waveforms for over 30 years and notice that many patterns look like ASDR envelopes of sounds.
The oscillating zig-zag reminds me of a percussion cymbal, where it tapers down at a constant rate. It's after that waveform has calmed/smoothed-out do we see another strike and the price changes course again.
