SP500 Sell Trading Opportunity SpottedH1 - Strong bearish pressure.
No opposite signs.
Expecting the price to drop further from the marked resistance zones.
👉 If you enjoy this analysis, please Like, Follow, and Support the profile! Your engagement motivates us to share more quality setups.
Sp500analysis

SP500 - Looking To Sell Pullbacks In The Short TermH1 - Strong bearish move.
No opposite signs.
Expecting bearish continuation until the two strong resistance zones hold.
If you enjoy this idea, don’t forget to LIKE 👍, FOLLOW ✅, SHARE 🙌, and COMMENT ✍! Drop your thoughts and charts below to keep the discussion going. Your support helps keep this content free and reach more people! 🚀
--------------------------------------------------------------------------------------------------------

SP-500 Bearish Indications- Overall Market AnalysisDaily Time Frame- Rising Wedge is a bearish reversal pattern. If the Daily breaks out of this pattern at any point towards the downside we should see price reach the previous support levels around 6840.00.
4H Time Frame- Created Bearish Divergence on the Relative Strength Index indicator (RSI). Higher highs are being made in price but lower highs on indicator.
1H time Frame and down has a head and shoulders pattern. Currently sitting at right shoulder. This could be bearish indication for today market.

SP500 - Looking To Sell Pullbacks In The Short TermH1 - Strong bearish move.
No opposite signs.
Expecting bearish continuation until the two Fibonacci resistance zones hold.
If you enjoy this idea, don’t forget to LIKE 👍, FOLLOW ✅, SHARE 🙌, and COMMENT ✍! Drop your thoughts and charts below to keep the discussion going. Your support helps keep this content free and reach more people! 🚀
--------------------------------------------------------------------------------------------------------

S&P 500 Chart Analysis.S&P 500 Chart Analysis.
The S&P 500 index is still trading within a long-term ascending channel, indicating overall market strength.
The price is currently near the upper trendline, keeping the market in bullish territory.
The index recently found support near the 21-week moving average (21 MA), which is a strong dynamic support level.
If the price remains above the 21 MA, the index could move higher and attempt to make new highs.
If the price closes weakly below the 21 MA, it could retrace towards the middle or lower part of the channel.
The trend remains bullish, but some caution is advised at these elevated levels. As long as support holds, the bullish momentum is likely to continue.
⚠️ Exercise caution.

S&P vs CryptoThe S&P is completing its cycle, and after that it is expected to correct to the specified levels, followed by a correction in Bitcoin as well.
btc
BAT is correcting toward the specified levels after completing its flag pattern
Most other coins are also mimicking Bitcoin’s behavior
link

SPX - H4 - SELL SETUP - Supply Retest confirmedSPX has entered bear market territory last month and I expect a continuation to the downtrend from here onward. Based on many different macro indicators such as credit default swaps on big tech, macro regimes, sentiment and technical analysis. I see SPX falling off the clip from this precise supply zone

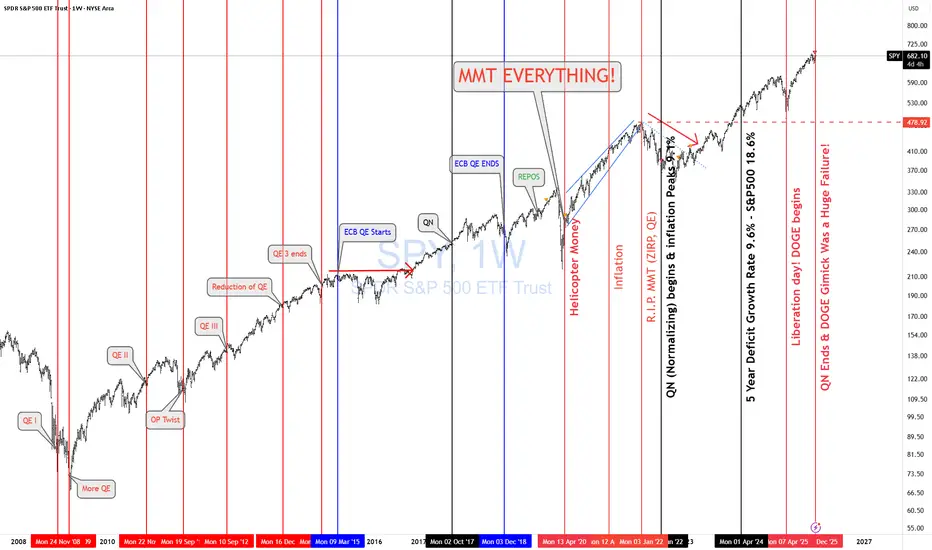
SPY & Macro HistoricalToday FED ended QN (Quantitative Normalizing NOT "T" = tightening. 1st, you normalize, then you tighten. Right??)
The Fed is continuing to let mortgage-backed securities roll off its balance sheet, while the U.S. Treasury increases T-bill issuance (cash-like instruments). That combination means more gov securities are hitting the market even as the Fed’s balance sheet stays roughly unchanged.
More Treasury supply + no Fed buying = higher yields and tighter liquidity. More MBS roll-off = higher mortgage rates and pressure on housing. Treasury bills soak up cash, while longer bonds suffer.
🔥 REALMACRO summary:
The Fed is doing this to:
Get out of the mortgage market.
Strengthen the Treasury bill market (the foundation of dollar liquidity).
Keep bank reserves “ample” without restarting QE.
This combo lets them tighten just enough to cool asset prices, without breaking the plumbing again like in 2019.
The success of this experiment will largely determine how long the Fed can avoid returning to QE. If liquidity tightens too far as the economy continues to weaken, they’ll be forced back into some form of balance sheet expansion sooner rather than later.
Lastly, let's check how right I was when I posted "MMT Everything."
As of April 2020, US debt was $ 24T. Today, it is $38T, representing a total increase of $14T in 5 years.
✅ CAGR ≈ 9.6% per year
✅ S&P 500 CAGR (Apr 2020 → Today): ~18.6% per year
Both are completely unsustainable growth rates.
I nailed that back in April 2020. Trump & MMT "print and play" will be the death of us! SIGH!
Lastly, the DOGE gimmick was a complete and total failure as expected. No reduction in deficit and no fraud found. Imagine that!
As I keep saying, " NEVER INVEST IN TOXIC PEOPLE! THEY WILL ALWAYS BURN YOU IN THE END!" It's not political it's a FACT!
THANK YOU for getting me to 5,000 followers! 🙏🔥
Let’s keep climbing.
If you enjoy the work:
👉 Drop a solid comment
Let’s push it to 6,000 and keep building a community grounded in truth, not hype.
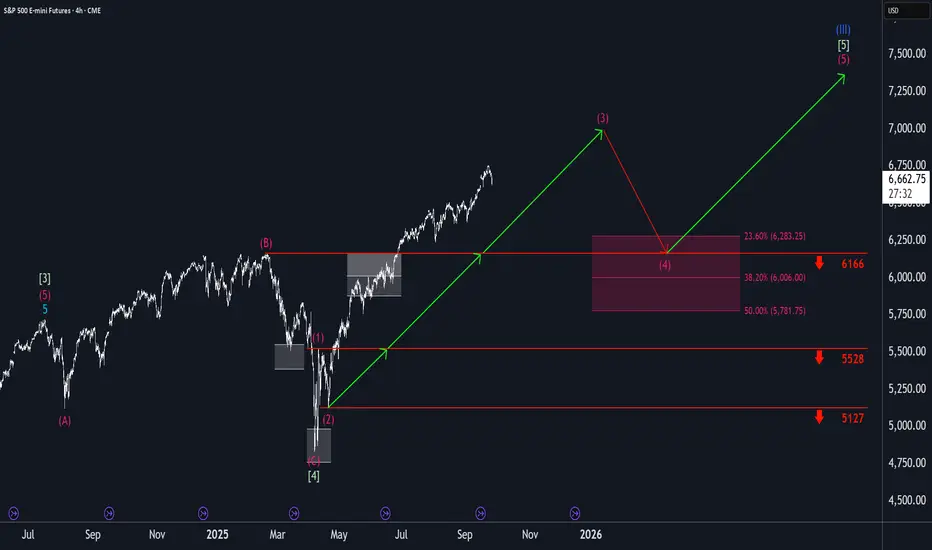
S&P500: Poised for Further Pullback The S&P 500 futures are currently trading just above support at 6,540 points, but are expected to see a temporary pullback within magenta wave (4). In our primary scenario, we anticipate the sell-off will extend into the green Long Target Zone between 6,163 and 5,912 points. From this area, we expect the start of wave (5), which would complete the magenta five-wave sequence and push the index higher—ideally above resistance at 6,952 points. This move would also mark the final high of the broader blue wave (III). However, if selling pressure intensifies and the Long Target Zone is breached, our alternative scenario will come into play (probability: 31%). In this case, blue wave alt.(III) would already be complete, and the index would enter a significantly deeper correction phase.

S&P500: Slightly higherS&P 500 futures edged slightly higher in yesterday’s session. The index appears to remain within the upward trajectory of magenta wave (5), which is expected to continue pushing higher. Once this wave reaches its peak, the larger blue wave (III) should also complete. Afterward, we anticipate a corrective phase in the form of magenta wave (A), which could put renewed pressure on the index. However, if prices reverse course and fall below the support level at 6,371, our alternative scenario will come into play. In that case, alternative wave alt.(4) would likely extend further downward, targeting a low within the corresponding alternative zone between 6,055 and 5,822 points (probability: 30%).

S&P500: Rebound S&P 500 futures managed to stage a modest rebound in yesterday’s session and are now showing renewed upward momentum. In our primary scenario, we expect magenta wave (5) to continue climbing and to ultimately mark a final high that completes the larger blue wave (III). Afterward, we anticipate a corrective phase via magenta wave (A), which should pull the index toward support at 6,371 points. However, if prices drop directly below the 6,371 points support, our alternative scenario will come into play. In that case, the alternative wave alt.(4) would likely extend further downward, finding its low within the magenta alternative Target Zone between 6,055 and 5,822 points.

S&P500: Rising?S&P 500 futures edged slightly lower in yesterday’s session but are expected to remain within the upward trajectory of magenta wave (5), which, under our primary scenario, is likely to continue moving higher. This advance would also complete the larger blue wave (III). Afterward, we anticipate a corrective phase in magenta wave (A), which should put renewed pressure on the index. At the same time, we are monitoring our alternative scenario, which suggests that magenta wave alt.(3) has not yet concluded. If prices drop below the support level at 6,371 points, this scenario will come into play. In that case, wave alt.(4) would likely extend further downward, reaching its low within the magenta alternative Target Zone between 6,055 and 5,822 points (probability: 30%).

Trump & The Eighth (8): The Millennium S&P500 Long Deal!For friends and Donald Trump the Magnificent (Trump).
Friends, based on analysis of data from the S&P 500 index, Trump's visible activity, and the Federal Reserve's aggressive interest rate cutting cycle - the conclusion is obvious. The US economy, and therefore the global economy, is transitioning from stagnation to recession. Consequently, the S&P 500 will first enter a correction, then experience a severe crash in 2026.
However, there exists an algorithm that can soften this collapse and save the global economy. This is the exact algorithm Trump intends to execute through a deal with Russia, achieved via a Russia-Ukraine ceasefire. This must become more than a temporary truce - it must be peace for generations to come.
To save millions of lives, to rescue the global economy and US markets, the Eighth (8) will come:
The Eighth (8) - the man who, through agreements with both Putin and Trump, will provide security guarantees and immunity for Putin, his inner circle, and their capital.
The Eighth (8) will sign a peace agreement with Zelenskyy based on a 50-year lease of territories along the current front lines. Using unfrozen Russian sovereign assets, he will restore both Russian and Ukrainian territories and pay all due compensations to victims' families.
The Eighth (8) will make a deal with Trump ensuring complete cooperation, mutual understanding, and prosperity for Russia, Ukraine, and the United States.
These three steps will enable comprehensive resolution of both regional and international issues, which in turn will sustain the global economy and US market indices.
Best regards,
VinterFrank (8)

S%P DROP AND GIVE ME 50....50K PLEASE LOLBias is BEARISH!
Hear me out tho lol!
First, we never predict; we estimate and wait! Price will tell us where it wants to go. Based on my estimate, we have big news this week that does not look very positive and could negatively affect American businesses and stocks, potentially leading to central sell pressure in the market. That, paired with no significant pullback on the D/HTF's, makes me estimate we should have nice sell ops.
4H Golden zone is around 6,809-50% and 6,801-.618%! (Great buy bounce area)
after that we have some IPP'S (important price points)
6,840 If passed and closed above we can see move to even HH's!
or
If we see a rejection to 6,801 price area we can see a dump taking out session IPP's and pushing to lower FVGs! (what I want lol)
so we are going to let the market play, while we wait....and GET PAID!!
GDluckThisWeek!

Market on Fire: S&P 500 & Nasdaq Rally Towards New HighsWe have a beautiful P-Shape volume profile formed at the top and we broke and closed above it.
The P-shape volume profile is bullish profile that is formed when large volumes are transacted at the highs meaning participants a willing to pay premium price . You can see the POC so close to the top of the VAH
I checked the CVD of the volume on a footprint chart and i see the volume has -ve Delta , which means alot of aggressive sellers transacted there trying to push the price down. Now that they are being squeezed slowly and start closing out their positions, it should fuel the uptrend. i entered the trade soon as we broke and closed above the value area.
Food for thought.. Who was willing to pay the high price to buy from the aggressive sellers?
DEFINITIONS
POC- point of control
VAH- Value area high
CVD- Cumulative Volume Delta
Target is the ExoFade area..Lets see how this trade goes

SP500 Bearish Outlook With Tight SLBearish Technical Reading
• The index is currently trading near 6,728 after a strong recovery rally.
• Nearest hypothetical major resistance: 7,125 (weekly supply + marked zone).
• Nearest key support: 6,150 – 6,170 (structural pivot, last defended level).
• Breakdown from this zone could trigger a deeper correction.
________________________________________
Bearish Trade Setup (Tighter Levels)
• Entry: Short around 6,700 – 6,750 (current resistance zone).
• Stop Loss: 7,150 (above weekly resistance to avoid fakeouts).
• Take Profit 1 (TP1): 6,150 – 6,170 (structural demand, first bearish magnet).
• Take Profit 2 (TP2): 4,820 – 4,850 (major demand, previous accumulation zone).
________________________________________
Logic Behind Levels
• Stop Loss 7,150 is placed above the marked resistance — if price breaks and holds above, bearish thesis weakens.
• TP1 at 6,150 matches the exact key support drawn on your chart — logical place to secure partials.
• TP2 at 4,820 aligns with historical strong demand and would only be targeted if shutdown-driven fear prolongs and selling accelerates.
________________________________________

S&P500: More Upside Likely Before PullbackThe North American Mass Index kicked off the new week with some momentum, extending its climb within the ongoing magenta wave (3). For now, we anticipate this upward trend could continue before reaching a new high. Afterward, we expect a pullback as part of the subsequent wave (4), likely bringing the index into the magenta long Target Zone between 6,283 and 5,781 points. In our view, this price range offers attractive opportunities for long positions, as wave (5) is expected to follow—potentially pushing the index significantly higher and completing the larger blue wave (III). To protect newly established long positions, a stop can be set 1% below the lower boundary of the Target Zone.

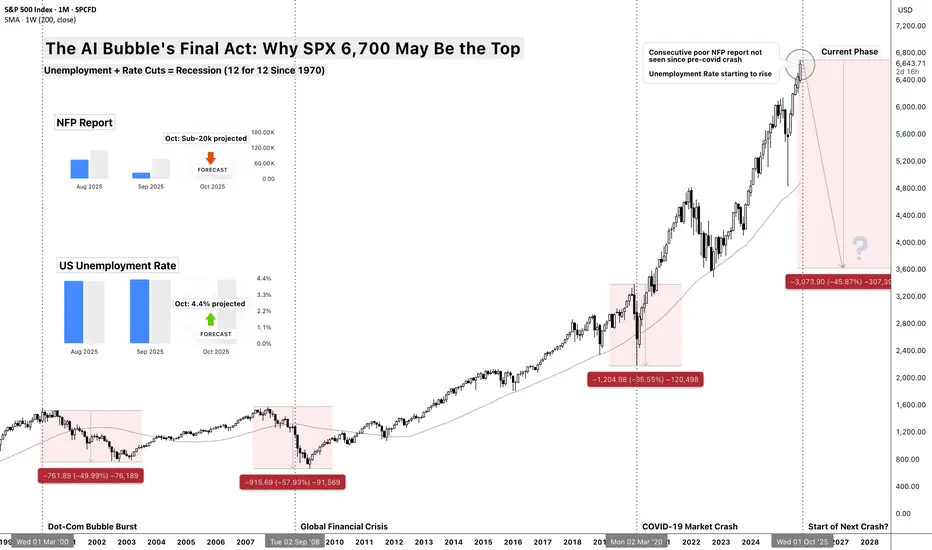
The AI Bubble's Final Act: Why $SP:SPX 6,700 May Be the TopThe AI Bubble's Final Act: Why SP:SPX 6,700 May Be the Top
Unemployment + Rate Cuts = Recession (12 for 12 Since 1970)
The Death Cross Pattern
There's a simple rule that's worked for 55 years: When the Fed cuts rates while unemployment is rising from cycle lows, recession follows within 12 months - every single time.
Think of it like a doctor taking your temperature while giving you painkillers. The medicine might make you feel better temporarily, but if the fever is rising, something serious is wrong underneath.
Current Status:
✅ Fed just cut rates ECONOMICS:USINTR (September 2025)
✅ Unemployment ECONOMICS:USUR rising from 3.4% cycle low
✅ TVC:SPX at all-time high ($6,700)
Historical Result: 12/12 times = recession + 35% average equity crash
The Precedent: Crisis Follows a Script
2000 Dot-Com Bubble:
Setup: TVC:SPX at ATH (1,550), ECONOMICS:USUR unemployment at 3.9%, ECONOMICS:USINTR Fed starts cutting
Crisis: Technology "revolution" story breaks down
Result: -49% crash over 2.5 years
Recovery: 7 years to new highs
2008 Financial Crisis:
Setup: CBOE:SPX at ATH (1,576), ECONOMICS:USUR unemployment at 4.4%, ECONOMICS:USINTR Fed starts cutting
Crisis: Housing/credit bubble bursts
Result: -57% crash over 1.5 years
Recovery: 5 years to new highs
2025 AI Bubble:
Setup: SPREADEX:SPX at ATH (6,700), ECONOMICS:USUR unemployment at 3.4%→4.2%, ECONOMICS:USINTR Fed starts cutting ✅
Crisis: AI productivity story meets employment reality
Projection: -35 to -45% crash over 18 months
Recovery: 3-5 years (faster due to tech infrastructure remaining)
The AI Employment Paradox
The Productivity Mirage
Wall Street celebrates AI boosting productivity, but here's the paradox:
productivity gains = job losses = reduced consumer spending = recession.
Think of it like a factory owner celebrating a new machine that replaces 100 workers. Great for margins, terrible for the local economy when those 100 families stop spending.
Jobs ECONOMICS:USNFP at Risk by Sector:
Customer Service: 2M jobs (chatbots replacing agents)
Software Development: 500K jobs (AI-assisted coding reducing teams)
Transportation: 3M jobs (autonomous vehicles accelerating)
Administrative: 4M jobs (AI handling routine tasks)
Content Creation: 1M jobs (AI writing, design, video)
Total Impact: 10+ million jobs facing displacement over next 2-3 years
Why This Time is Different?
Unlike previous automation waves that created new job categories, AI is targeting cognitive work directly. A factory worker could become a service worker, but what does a displaced knowledge worker become?
Valuation Extremes: 1929 Levels with 2025 Leverage
Current Valuation Metrics:
Shiller CAPE: 38+ (higher than 1929's 33)
Buffett Indicator: 195% (market cap/GDP, historical average 85%)
Price/Sales: 3.3x (vs 1.4x historical average)
Forward P/E: 23x (on optimistic AI earnings assumptions)
Valuations today exceed 1929 by most measures - but with far more leverage embedded in the system. If 1929 was a valuation bubble, 2025 is that bubble layered with derivatives, corporate debt, and passive flows.
The Leverage Layer:
Margin Debt: $1.023 trillion (record high)( as of July 2025, ycharts )
Corporate Debt/GDP: 85% (vs 45% in 2000)
Derivatives Exposure: $700 trillion notional ( as of June 2025, BIS semiannual data )
ETF/Passive Flows: $1.5 trillion annually (forced selling on reversals)
When liquidity stress hits, derivatives amplify shocks - notional exposure dwarfs underlying assets.
Think of today's market like a house of cards built on a trampoline. Even small bounces can bring the whole structure down.
Technical Breakdown: The Charts Don't Lie
Major Warning Signals:
Market breadth has deteriorated from 90% in Q4 2024 to ~60% today,
Defensives led earlier in the year,
TVC:VIX Volatility’s floor has shifted higher
Credit risk appetite (HYG/TLT) is stretched.
Together, these signal fragility beneath the index surface.
The Three-Stage Technical Collapse:
Stage 1 - The Warning (Now-Q4 2025):
Current Level: $6,700
Initial Support: $6,200 (previous resistance)
Character: Failed rallies, rotating leadership, "healthy correction" narrative
Target: 5,800-6,000 (-10 to -13%)
Stage 2 - The Cascade (Q4 2025-Q2 2026):
Breaking Point: Below 5,800 triggers algorithmic selling
Character: "Buy the dip" stops working, margin calls begin
Target: 4,800-5,200 (-25 to -30%)
Stage 3 - Capitulation (Q2-Q4 2026):
Final Flush: Panic selling, ETF redemptions
Character: "Markets will never recover" sentiment peaks
Target: 3,700-4,200 (-35 to -45%)
The Catalyst: When Reality Meets Hype
Q4 2025 Earnings Season - The Reckoning
Companies will face impossible questions:
"You spent $50B on AI - where's the revenue growth?"
"Productivity is up 20%, why are you laying off workers?"
"If AI is so transformative, why are margins declining?"
The Employment Data Domino Effect:
October/Nov NFP: First print above 250K unemployment claims
November Consumer Spending: Down 2%+ as job fears spread
December Holiday Sales: Weakest since 2008
January Layoff Announcements: Tech companies start "right-sizing"
Think of it like the moment in 2000 when investors finally asked: "How exactly does Pets.com make money?" or 2007 when they wondered: "What's actually in these mortgage bonds?"
Sector-by-Sector Breakdown
Technology (-50 to -70%)
AI hype stocks get destroyed first
Software companies face declining growth + competition
Semiconductor cycle turns negative
Biggest Losers: NVDA, MSFT, GOOGL
Consumer Discretionary (-40 to -55%)
Unemployment hits spending immediately
High-end retailers crushed first
Auto sales collapse with higher rates
Biggest Losers: TSLA, AMZN, NKE
Financials (-30 to -45%)
Credit losses surge as economy weakens
Interest margin compression
Commercial real estate exposure
Biggest Losers: Regional banks, non-bank lenders
Relative Outperformers (-15 to -25%)
Utilities, Healthcare, Consumer Staples
Companies with genuine AI cost savings
High-dividend yielders in low-rate environment
Key Dates and Catalysts
October 2025:
Jobs report (first warning?)
Q3 earnings disappointments
Fed meeting (dovish pivot?)
November 2025:
Election aftermath volatility
Black Friday sales data
Thanksgiving week low-volume crashes
December 2025:
Year-end tax selling
Institutional rebalancing
Holiday retail reality check
Q1 2026:
Layoff announcements surge
Earnings guidance slashed
Credit events begin
The Recovery Setup
Why This Crash Creates Opportunity:
Valuation Reset: P/E ratios back to historical norms
Weak Hands Flushed: Margin traders eliminated
Government Response: Fiscal + monetary stimulus
AI Infrastructure Remains: Real productivity gains continue post-bubble
Recovery Timeline:
Bottom: Q4 2026 around 3,700-4,200
Initial Rally: 30-50% bounce over 6 months
New Bull Market: Begins 2027 with stronger foundation
New Highs: 2029-2030 timeframe
Risk Management Rules
This Analysis Fails If:
Fed pivots to massive QE before crisis
Fiscal stimulus exceeds $2 trillion quickly
AI productivity gains offset job losses faster than projected
Geopolitical crisis overrides economic fundamentals
Probability Assessment:
60%: Correction to 4,800-5,500 range (25-30% decline)
25%: Major crash to 3,700-4,200 range (40-45% decline)
15%: Continued melt-up through 2026 (soft landing achieved)
Conclusion: The End of the Everything Era
At SPX 6,700 with unemployment rising and the Fed cutting rates, we're witnessing the final act of the 15-year "everything bubble."
The AI revolution is real, but like the Internet in 2000, revolutionary technology doesn't prevent financial gravity.
The bubble is ending exactly like the previous ones - with everyone believing "this time is different" right until it isn't.
Smart money is already rotating defensive. The question isn't whether a correction is coming - it's whether you'll be positioned for it.
S&P 500: Rally Stalls, but Further Upside LikelyMidweek, the S&P 500 struggled to find the momentum needed to extend its climb within the magenta wave (3). However, our primary outlook still calls for this wave to reach a somewhat higher high. Afterward, wave (4) of the same color is expected to take over, guiding the index into the magenta Target Zone between 6,283 and 5,781 points. In wave (5), another upward phase is anticipated, which should ultimately complete the broader uptrend of the blue wave (III) at an even higher price level.
S&P 500: Bullish! Buy It!In this video, we will analyze the following FX market for the week of Aug 25 - 29th:
S&P 500 (ES1!)
The S&P 500 ended the week with strong bullish momentum, closing above the previous 3 days. The structure is bullish on the HTFs, and there is not good reason to look for sells.
Buy the bullish price action.
No sells until there is a definitive bearish break of market structure!
Enjoy!
May profits be upon you.
Leave any questions or comments in the comment section.
I appreciate any feedback from my viewers!
Like and/or subscribe if you want more accurate analysis.
Thank you so much!
Disclaimer:
I do not provide personal investment advice and I am not a qualified licensed investment advisor.
All information found here, including any ideas, opinions, views, predictions, forecasts, commentaries, suggestions, expressed or implied herein, are for informational, entertainment or educational purposes only and should not be construed as personal investment advice. While the information provided is believed to be accurate, it may include errors or inaccuracies.
I will not and cannot be held liable for any actions you take as a result of anything you read here.
Conduct your own due diligence, or consult a licensed financial advisor or broker before making any and all investment decisions. Any investments, trades, speculations, or decisions made on the basis of any information found on this channel, expressed or implied herein, are committed at your own risk, financial or otherwise.

S&P 500 Eyes Breakout as Powell Signals Rate CutThe S&P 500 is once again approaching record territory, with momentum accelerating after Fed Chair Jerome Powell signaled a potential rate cut at Jackson Hole. Markets welcomed the dovish shift, boosting risk appetite and driving stocks higher.
Beyond Powell’s comments, several other factors are fueling the rally. Softer inflation readings have reinforced the case for easier policy, while labor market data shows a cooling trend without triggering recession fears. This “goldilocks” scenario continues to support equities.
Strong corporate earnings have also underpinned the move, particularly from the tech and consumer sectors, where margins remain resilient despite macro uncertainty. Capital inflows into equity ETFs highlight renewed investor confidence, while declining bond yields are making stocks relatively more attractive.
On the technical side, the S&P 500 is pushing toward the 6,500 level, its all-time high. A clean break above this barrier would confirm fresh upside momentum, potentially triggering further buying from trend-following funds.
While risks remain from geopolitics and trade tensions, the current mix of easing Fed expectations, solid earnings, and supportive technicals suggests the index could extend higher. A breakout above 6,500 may set the stage for another leg in the bull market.

8/20/25 SPX Trade Plan📊 Quantum's Trade Plan 📊
TVC:VIX - TVC:DXY - #10Y = Caution📈
⚪️ 6400 Pivot
🟢 If 6400 fails then short - 6390--6388--6375--6364
🔴If 6400 hold then long - 6409--6426--6440--6445
🔵 -Dex with sell walls at 6400 & 6450
🟠 Vanna neutral - 6405-6410 vanna flip
⚫️ Volume + Flow must support thesis

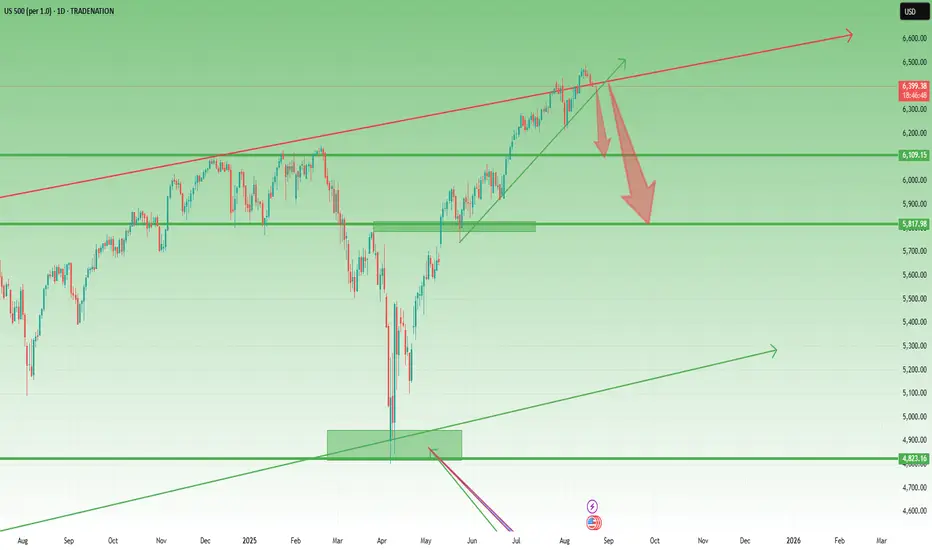
US500 – Has the Correction Started?1. What Happened Yesterday
Yesterday, US500 dropped around 1%, signaling that a meaningful correction could be starting. Unlike Nasdaq, which already broke under two key support levels, here the price is still above the trendline that began back at the end of May, when the index broke through the important 5800 resistance.
The rise since April has been huge and not fundamentally justified, making the index vulnerable to a reversal towards more sustainable levels.
________________________________________
2. Key Question
Has the correction really started, or will we first see another spike before the drop?
________________________________________
3. Why More Downside is Likely
• Trendline vulnerability: A break under 6380 could trigger acceleration to the downside.
• First bear target: 6100, the old ATH.
• Bigger picture: A move under 6000 remains likely, with 5800 as a longer-term destination.
• Risk/reward setup: Any spike higher should be seen as a selling opportunity. Around 6500 would be ideal to short.
________________________________________
4. Trading Plan
• Sell spikes, especially near 6500).
• Watch 6380 – break here could open the way towards 6100.
• Medium/long term bias: Bearish, with more room down than up.
________________________________________
5. Final Note 🚀
The market must confirm, but the strategy is clear: don’t chase the bounce, sell the strength and ride the correction.
Disclosure: I am part of TradeNation's Influencer program and receive a monthly fee for using their TradingView charts in my analyses and educational articles.