SPK/USDT — Price at Critical Support: Breakdown or Reversal?SPK/USDT on the daily timeframe (1D) remains in a clear downtrend (bearish trend) since the peak around 0.19 USDT. Price continues to form lower highs and lower lows, indicating strong seller dominance. Currently, price is trading near a major historical support zone, which may act as a key technical reaction area.
---
Pattern & Price Structure
Descending Channel / Modified Falling Wedge
Price is moving within a broad descending channel, characterized by:
Upper line: dynamic resistance (descending trendline)
Lower line: medium-term dynamic support
This structure represents a bearish continuation pattern, although a potential reversal could occur if price breaks above the upper trendline with strong confirmation and volume.
---
Key Levels
Support:
0.0220 – 0.0210 (current support / demand area)
0.0189 (historical low / extreme support)
Resistance:
0.0295
0.0320
0.0350
0.0455 (strong resistance / supply zone)
---
Bullish Scenario
Price holds above the 0.021 – 0.022 area and forms:
higher low
bullish engulfing / strong rejection candle
A valid breakout above the descending trendline
Upside targets:
0.0295
0.0320
0.0350
Extension: 0.0455
This scenario would indicate a relief rally or the early stage of a recovery phase.
---
Bearish Scenario
Price fails to hold above the 0.021 area
Strong daily candle close below support
Further downside potential toward:
0.0189
If broken, risk of bearish price discovery (new lows)
This scenario confirms bearish continuation with sustained seller control.
---
Conclusion
SPK/USDT remains in a medium-term bearish phase, but price is currently sitting at a critical decision zone. This area will determine whether the market experiences a technical rebound or continues its downward expansion. Clear breakout or breakdown confirmation is essential before taking any trading decision.
---
#SPKUSDT #SPK #CryptoAnalysis #TechnicalAnalysis #Altcoin #DescendingChannel #BearishTrend #BullishReversal #SupportResistance
Spkusd

SPK/USDT – Final Pressure Before a Major Breakout?The market is watching SPK/USDT closely as it approaches a make-or-break zone.
After months of steady decline under a well-defined downtrend line, price is now testing the critical demand zone at 0.034–0.030 — the same level that previously triggered a massive rally earlier this year.
The current structure hints at a potential shift in momentum, but failure to hold this area could invite a deeper sell-off.
---
Pattern & Technical Structure
SPK is shaping a descending wedge / descending triangle pattern — a classic formation that often precedes a trend reversal when sellers lose steam and buyers begin to accumulate around a key support area.
The 0.034–0.030 zone acts as a strong defensive wall.
If this zone holds and price breaks above the yellow downtrend line, it could signal the start of a medium-term bullish reversal.
However, a clean break below this level would confirm bearish continuation, likely driving price down toward the 0.0225 support zone.
---
🟢 Bullish Scenario
A daily candle close above the downtrend line confirms a momentum shift.
Breakout must be supported by increasing volume for validation.
Upside targets:
0.0465 → first key resistance
0.0565 → confirmation of a trend reversal
0.0885 → extended bullish target if sentiment strengthens
Watch for the formation of a higher low post-breakout — a reliable sign of a structural reversal.
---
🔴 Bearish Scenario
A daily close below 0.030 confirms bearish dominance.
Potential for accelerated drop toward 0.0225 (previous major low).
If breakdown occurs on high volume, it may signal the final phase of capitulation before a deeper accumulation phase.
---
💡 Market Outlook & Sentiment
SPK is standing at a major inflection point.
The 0.034–0.030 zone is not just a support range — it’s a battlefield between accumulation and continuation.
A breakout above the trendline would ignite a new chapter in SPK’s price structure, while a breakdown could extend its bearish cycle into year-end.
Smart traders will wait for daily candle + volume confirmation, not emotional reactions.
The next decisive move here could define the market direction for months ahead.
---
🎯 Key Technical Levels
Main Support: 0.034 – 0.030
Next Support: 0.0225
Immediate Resistance: 0.0465
Major Resistances: 0.0565 / 0.0885 / 0.1250
---
🧭 Market Perspective
Although SPK remains within a downtrend, the slowing bearish momentum near this demand zone might indicate early accumulation by smart money.
If a breakout occurs, expect a possible short squeeze rally toward 0.05–0.06 as short positions unwind above the descending trendline.
---
#SPK #SPKUSDT #CryptoAnalysis #Breakout #Downtrend #TechnicalAnalysis #PriceAction #AltcoinSetup #CryptoTrading #ReversalZone #SupportResistance

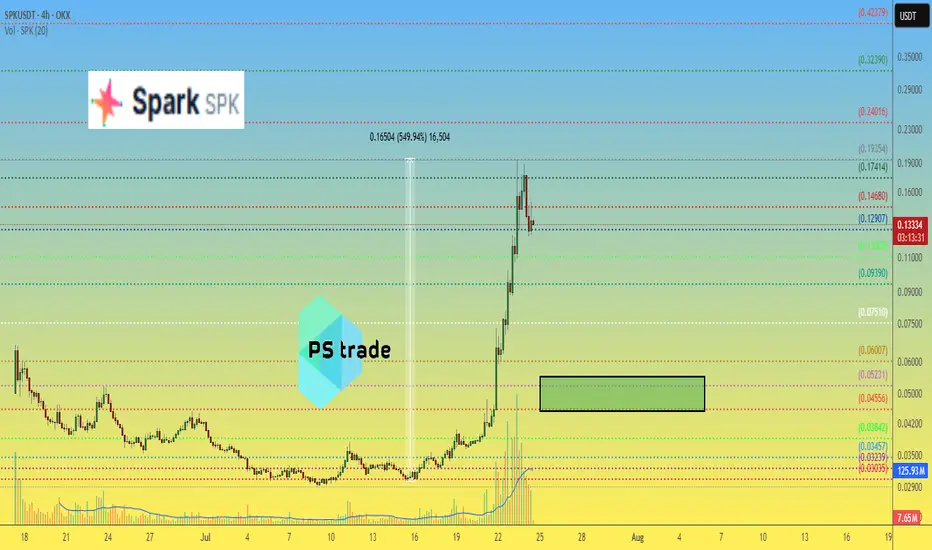
Spark SPK price analysisThis day has come and a new trend-narrative is emerging ?
Instead of memecoins on CRYPTOCAP:SOL , projects from the CRYPTOCAP:ETH ecosystem will now shooting ?)
The #SPK coin has made + 550% in less than 10 days
and the capitalization of the #Spark project is "only" $150 million.
We personally do not feel comfortable buying at the current price of OKX:SPKUSDT
At $0.045-0.055 it would be much more comfortable
But it's definitely worth watching, maybe this narrative will be the same "money" button in the future ?)
What do you think?
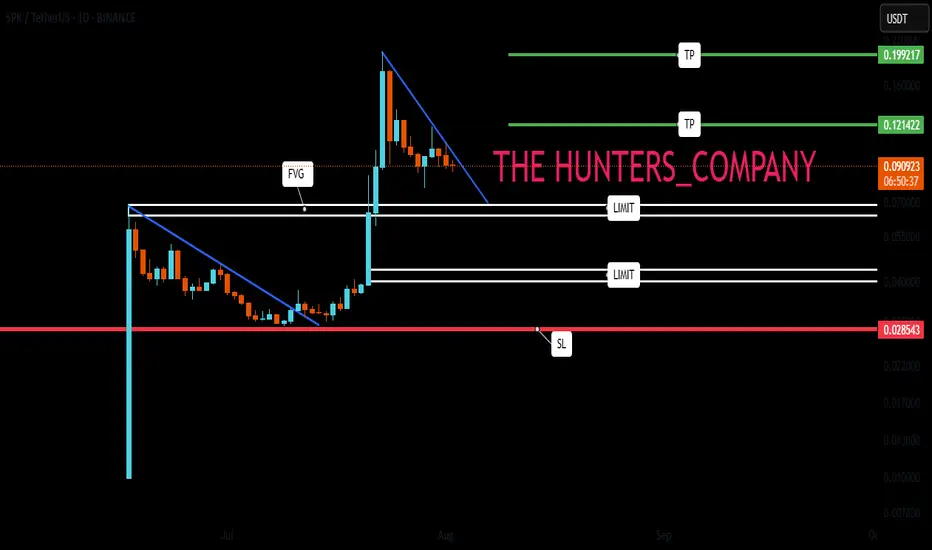
SPK : Does history repeat itself?Hello friends🙌
✅You see that once a pattern was formed and after the resistance was broken, we had a good growth.
✅Now the same pattern has formed again and the price is in the accumulation phase.
✅We have to see if history repeats itself and if the buyers support the price again or not.
✅We have obtained important support areas for you, so that if it falls, you can buy in steps and if the pattern breaks, you can buy in steps right here, of course with capital and risk management.
🔥Follow us for more signals🔥
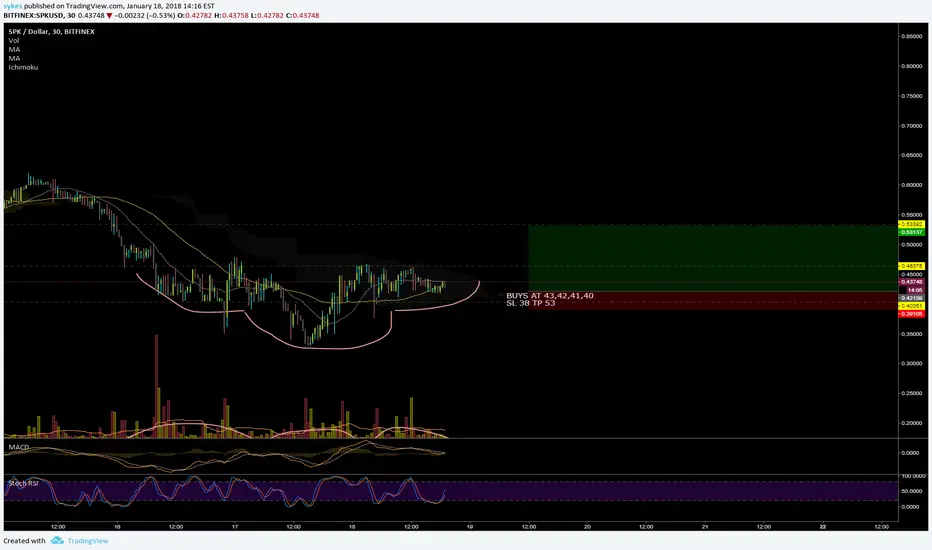
*Trade safely with us*
SPKUSD BAT pattern: Trade management updateBAT is doin its thing, B C leg has been reached and now we move stop to Break Even and watch as (fingers crossed) price continues to move higher to other price targets.