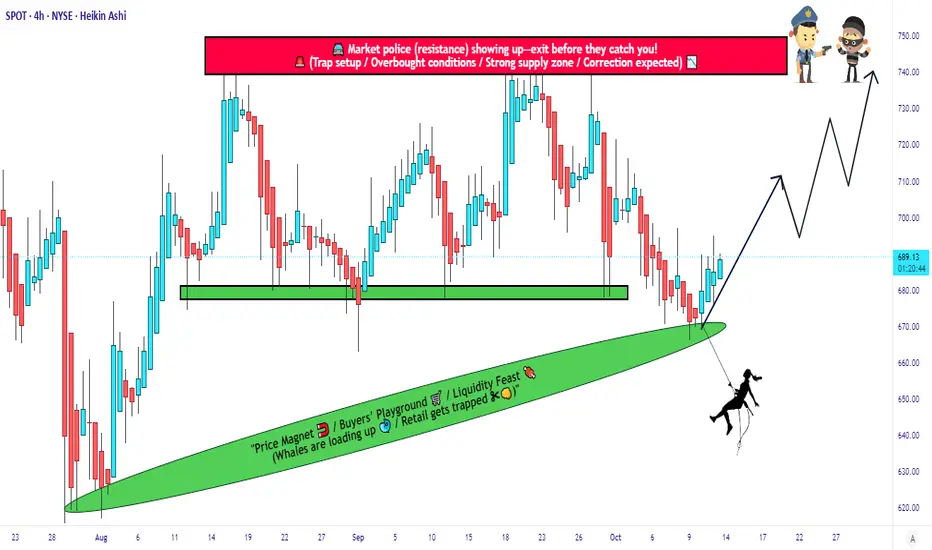
SPOT Price Action | Strong Support, Tight Stop, Open Target!🎧 SPOT | Thief Trader Profit Playbook 💰
“When Music Meets Money — Spotify’s Chart Is About to Drop Beats & Gains!” 🎵📈
🧭 Plan:
Bullish Bias — Thief-style layered accumulation for a smart entry!
We’re eyeing SPOT (Spotify Technology S.A.) for a potential swing/day trade move north.
🎯 Entry (Layering Strategy)
💎 The Thief Strategy uses multiple limit layers to build a strong position.
Here’s the sneak-in setup (choose your own comfort):
🧩 Buy Limit 1 → $670
🧩 Buy Limit 2 → $680
🧩 Buy Limit 3 → $690
(You can expand layers based on your risk appetite — remember, thieves adapt!) 😎
🛑 Stop-Loss (Thief’s Safe Escape)
This is the Thief SL @ $650
⚠️ Note: Dear Ladies & Gentlemen (Thief OG’s), this is not a fixed SL — trade smart, manage your own risk. You make money → you take money. 💼
🎯 Target Zone (Police Barricade 🚓)
Target: Around $740
The chart shows a strong resistance + overbought area + possible trap zone — that’s where the police barricade is! 🚧
Escape with profits before they catch your bags! 💨💰
⚠️ Note: Again, Thief OG’s — this is a flexible TP zone, not financial advice. Secure your profits when the opportunity sings! 🎤📊
🧩 Correlated Pairs to Watch ($)
Keep an eye on these correlated tickers for extra confirmation or sentiment cues:
NASDAQ:NFLX → Streaming sector momentum 🎬
NASDAQ:AAPL → Tech sentiment driver 🍏
NASDAQ:MSFT → Market leader correlation 🖥️
NASDAQ:META → Digital ad revenue influence 💬
NASDAQ:QQQ / AMEX:SPY → Index health check 💪
These tickers often dance together in the same rhythm — when the tech sector grooves, SPOT follows the beat! 🕺
⚙️ Technical Key Points:
Bullish structure holding above $650 zone support 🧱
Momentum strengthening after pullback retest 🎢
RSI mid-zone recovery — not yet overbought, potential room to run! 📈
Volume showing accumulation footprints 👣
✨ If you find value in my analysis, a 👍 and 🚀 boost is much appreciated — it helps me share more setups with the community!
⚠️ Disclaimer:
This is a Thief-style trading strategy, shared for educational & fun purposes only.
Trade responsibly. I’m not your financial advisor — I’m your chart burglar! 😜💼
#SPOT #Spotify #SwingTrade #DayTrade #StockMarket #ThiefTrader #LayeringStrategy #TechnicalAnalysis #BullishSetup #TradingView #EditorPick #ProfitPlaybook #SPY #QQQ #NASDAQ #StocksToWatch
Spotifysignals
Spotify stock falls more than 11% after earnings releaseSpotify's stock has shown significant price weakness and is now trading below $600 per share, shortly after a large bearish gap formed following the release of its quarterly results. The company reported earnings per share of €1.07, below expectations of €2.13 per share. Additionally, Spotify projected operating profit for Q2 at €539 million, under the market estimate of €557 million. The earnings miss and weak forward guidance have led to persistent bearish pressure, triggering strong selling momentum in the short term.
Uptrend Weakens:
Spotify has been in a consistent uptrend since around November 2022. However, in recent months, buying pressure has failed to push the price to new highs, with the stock now trading in a lateral range that signals a period of price consolidation. If the uptrend continues to stall, this neutral phase may extend in the short term.
ADX:
The ADX line has started to show early signs of neutrality, hovering around the 20 level. This indicates reduced volatility over the past 14 trading sessions. If ADX remains in this range, it suggests that price neutrality could persist.
RSI:
A similar condition is seen in the RSI, which has reached the neutral 50 zone—where bullish and bearish momentum are in balance. This reinforces the neutral sentiment and may support continued sideways movement in upcoming sessions.
Key Levels:
$640: The most recent high. A breakout above this level could signal a continuation of the long-term uptrend.
$540: Current support level, aligned with the 100-period simple moving average. Stability here may support ongoing consolidation.
$480: Major support at recent lows. A bearish move back to this level could trigger a fresh selling trend in the short term.
Written by Julian Pineda, CFA – Market Analyst

SPOTIFY to resume the uptrend and target $400.Spotify (SPOT) tested and held the 1D MA50 (blue trend-line) on Monday. This is the second progressive MA hold it makes after rebounding on the 1D MA100 (green trend-line) on July 18 2024.
The latter technically was a Higher Low on the nearly 2-year Channel Up pattern that has posted two cycles of Bullish Legs within that time span of around +160% each. The 1D RSI is posting a similar Bull Flag as in September - October 2023, so we might be in the same symmetry as that price action.
As you can see, that fractal rose to above the 1.5 Fibonacci extension following a 1D MA50 rebound, so if the current price action replicates it, we should see $400 by early November.
-------------------------------------------------------------------------------
** Please LIKE 👍, FOLLOW ✅, SHARE 🙌 and COMMENT ✍ if you enjoy this idea! Also share your ideas and charts in the comments section below! This is best way to keep it relevant, support us, keep the content here free and allow the idea to reach as many people as possible. **
-------------------------------------------------------------------------------
💸💸💸💸💸💸
👇 👇 👇 👇 👇 👇

SPOTIFY Buy opportunity on the 4H MA50.Spotify (SPOT) opened considerably higher yesterday but almost closed the 1D candle flat as it couldn't diverge more from the general bearish market sentiment. Clearly this opening jump indicates the stock bias to continue the bullish leg of the Channel Up that started on October 23, but a small pull-back along the majority of the market is probable, which can serve as a more comfortable buy entry for a rally to the end of the year.
Based on the 1D CCI, we may be in a similar situation as February's temporary top, which pulled back and only found support on the 4H MA50 (red trend-line). As a result we are looking for a new buy on the 4H MA50 in order to target the 0.786 Fibonacci level at 208.00.
-------------------------------------------------------------------------------
** Please LIKE 👍, FOLLOW ✅, SHARE 🙌 and COMMENT ✍ if you enjoy this idea! Also share your ideas and charts in the comments section below! This is best way to keep it relevant, support us, keep the content here free and allow the idea to reach as many people as possible. **
-------------------------------------------------------------------------------
💸💸💸💸💸💸
👇 👇 👇 👇 👇 👇
