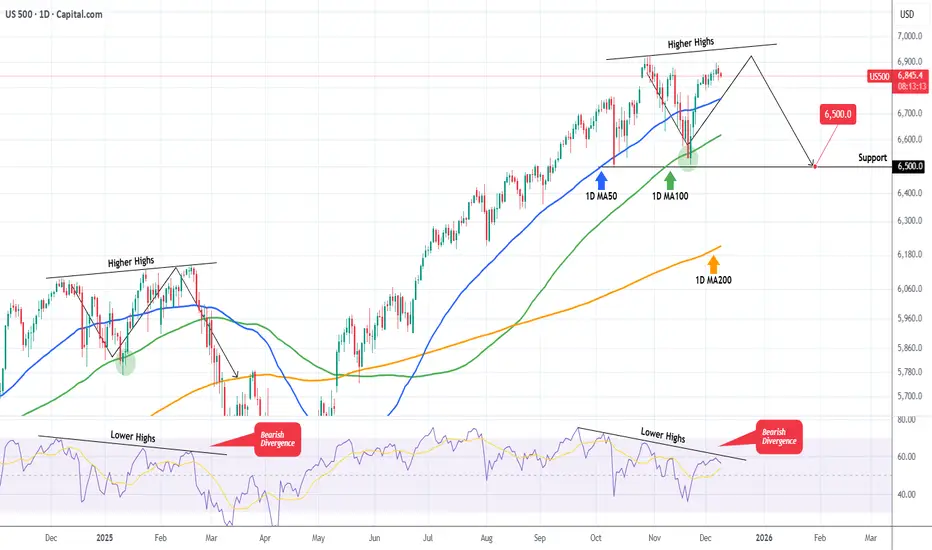
S&P500 The Bearish Divergence that may spoil the party.S&P500 (SPX) is extending a strong rally following the rebound on its 1D MA100 (green trend-line) almost 3 weeks ago. As we pointed out in a previous analysis, the price action of the past 2 months has been identical to the pattern after November 19 2024.
We are currently on the same 1D MA100 rebound towards the Higher Highs trend-line but the key development is that the 1D RSI on both fractals shows a huge Bearish Divergence, being on Lower Highs.
In February 2025 that led to the start of a strong correction in the stock markets. So as long as the 1D RSI Bearish Divergence holds, the S&P500 currently risks a technical correction towards at least the first Support level of 6500.
---
** Please LIKE 👍, FOLLOW ✅, SHARE 🙌 and COMMENT ✍ if you enjoy this idea! Also share your ideas and charts in the comments section below! This is best way to keep it relevant, support us, keep the content here free and allow the idea to reach as many people as possible. **
---
💸💸💸💸💸💸
👇 👇 👇 👇 👇 👇
Spxsignals
S&P500 Next stop.. 6925The S&P500 index (SPX) is about to complete the Right Shoulder of the Inverse Head and Shoulders (IH&S) pattern that took it from the bottom of the 1D MA100 (green trend-line) contact to having recovered the 0.786 Fibonacci level of the whole correction.
The next technical Target is of course the 6925 All Time High (ATH). Since however we are about to form a 4H MA50/100 Bullish Cross, a technical pull-back is expected as both previous such crosses since August 13, resulted into a short-term Top.
If the IH&S completes its technical expansion, then after this correction, a test of the 2.0 Fibonacci extension at 7200 is possible.
---
** Please LIKE 👍, FOLLOW ✅, SHARE 🙌 and COMMENT ✍ if you enjoy this idea! Also share your ideas and charts in the comments section below! This is best way to keep it relevant, support us, keep the content here free and allow the idea to reach as many people as possible. **
---
💸💸💸💸💸💸
👇 👇 👇 👇 👇 👇

S&P500 Final rally to 6925, then sell-off to 1D MA200?The S&P500 index (SPX) had a massive Friday rebound on its 1D MA100 (green trend-line) and yesterday touched again its 1D MA50 (blue trend-line), this time as a Resistance.
If it manages to break and close a 1D candle above it, we expect the current rebound to continue and evolve into the end-of-year rally and test at least the ATH Resistance at 6925.
The 1D RSI sequence suggests that we may be currently inside a same pattern as the December 2024 - January 2025 fractal, which after a 1D MA100 rebound it hit the ATH Resistance again and then got heavily rejected back to the 1D MA200 (orange trend-line) and beyond.
As a result, after the rally, our medium-term Target is 6300 (expected contact with the 1D MA200).
---
** Please LIKE 👍, FOLLOW ✅, SHARE 🙌 and COMMENT ✍ if you enjoy this idea! Also share your ideas and charts in the comments section below! This is best way to keep it relevant, support us, keep the content here free and allow the idea to reach as many people as possible. **
---
💸💸💸💸💸💸
👇 👇 👇 👇 👇 👇

S&P500 close to confirming the new Bear Cycle.The S&P500 index (SPX) broke below its 1D MA50 again yesterday (even closed the day below) and is showing clear signs of weakness at least for the short-term.
This can't be ignored as it may be transferred to the long-term time-frames where the market has been forming a Bearish Divergence on its 1W RSI since October 27. RSI Lower Highs against the market's Higher Highs.
This is similar to the November 15 2021 1W RSI Bearish Divergence, which led to one last quick rally and 1.5 month later the Bull Cycle topped and the 2022 inflation crisis Bear Cycle started.
The signal was given by a weekly closing below the 1D MA100 (red trend-line), which has been the market's natural Support in the past 5 months and also during every major Bullish Leg of the Bull Cycle.
As a result, if the index closes a 1W candle below its 1D MA100, we will call the start of a new Bear Cycle, potentially aiming for the 1W MA200 (orange trend-line), which is where the 2022 Bear Cycle bottomed after a -27.62% correction. Our Target Zone for the next long-term buying will be 5300 - 5000, assuming the top is already in. If not, the -27.62% decline will be re-adjusted to the new top.
---
** Please LIKE 👍, FOLLOW ✅, SHARE 🙌 and COMMENT ✍ if you enjoy this idea! Also share your ideas and charts in the comments section below! This is best way to keep it relevant, support us, keep the content here free and allow the idea to reach as many people as possible. **
---
💸💸💸💸💸💸
👇 👇 👇 👇 👇 👇

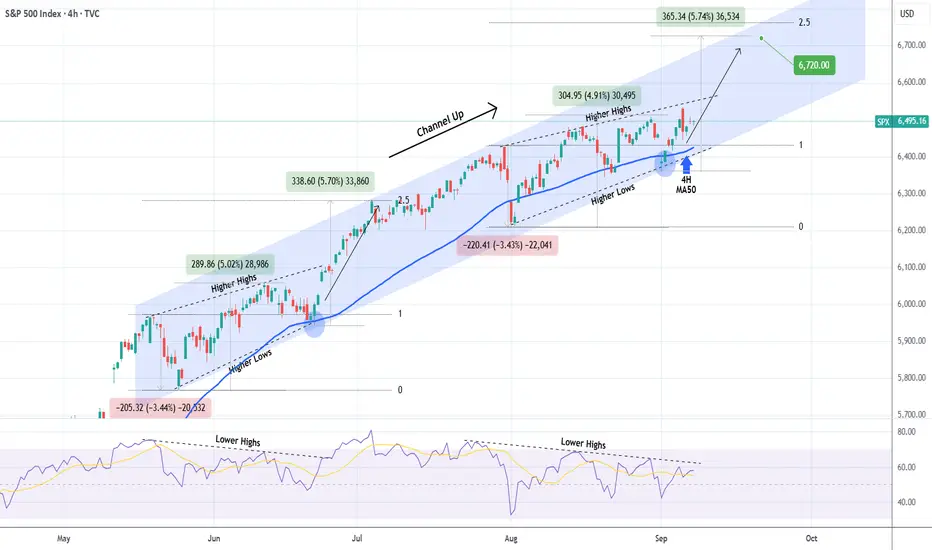
S&P500 New Bullish Leg confirmed targeting 7150.The S&P500 index (SPX) offered us, as we mentioned on our last analysis, an excellent buy opportunity last Friday as it hit its 1D MA50 (blue trend-line) and bounced.
Having broken and closed yesterday above its 4H MA50 (red trend-line), it has technically confirmed the new Bullish Leg of the 6-month Channel Up. Based on all previous ones, it should target the 2.5 Fibonacci extension at 7150, which remains our long-term Target for the end of the year.
Notice also how similar the 1D RSI patterns are of October and August. Steady rise is expected for November getting into December.
---
** Please LIKE 👍, FOLLOW ✅, SHARE 🙌 and COMMENT ✍ if you enjoy this idea! Also share your ideas and charts in the comments section below! This is best way to keep it relevant, support us, keep the content here free and allow the idea to reach as many people as possible. **
---
💸💸💸💸💸💸
👇 👇 👇 👇 👇 👇

S&P500 Is it approaching the end of this Cycle?The S&P500 index (SPX) has been trading within a Bullish Megaphone pattern since the October 2022 bottom of the Inflation Crisis. Since the July 2024 High, it also entered a shorter term Megaphone and those two patterns resemble the 2016 - 2019 Megaphones that emerged straight after the 2015 E.U. crisis and China's slowdown.
As you can see, the 1W RSI sequences among the two fractals are also very similar and the Cycles seem to be repeated with the 1W MA50 (blue trend-line) acting as the Support in times of aggressive uptrends, while the 1W MA200 (orange trend-line) acting as the Support of the Bear Cycles/ correction phases.
The former Megaphone peaked in early 2020 on its 1.618 Fibonacci extension. On the current pattern that Fib is at 7100 and may very well get hit by the end of this year. If it does, the probabilities of a strong technical correction towards the 1W MA200 and the bottom of the long-term Bullish Megaphone, rise dramatically. Especially if at the same time, the 1W RSI turns overbought well above the 70.00 barrier.
It is also worth noting that 1W RSI levels below 35.00 are a strong technical Buy Signal. Long-term investors may seek to use this as a complimentary indicator in case this sharp correction materializes.
So do you think SPX will start correcting if it hits that level by early next year?
-------------------------------------------------------------------------------
** Please LIKE 👍, FOLLOW ✅, SHARE 🙌 and COMMENT ✍ if you enjoy this idea! Also share your ideas and charts in the comments section below! This is best way to keep it relevant, support us, keep the content here free and allow the idea to reach as many people as possible. **
-------------------------------------------------------------------------------
💸💸💸💸💸💸
👇 👇 👇 👇 👇 👇

S&P500 Both short and long term bullish targets intact.The S&P500 index (SPX) continues to trade within its 5-month Channel Up and last Friday's pull-back to its 1D MA50 (red trend-line) again is another testament to it as it rebounded exactly on its bottom, making yet another Higher Low.
As we've shown on our previous analysis its short-term Target is the 1.382 Fibonacci extension at 6850. Ahead of a massive 1D MACD Bullish Cross however, we can see (after another short pull-back) the index extending much higher to its 2.5 Fibonacci extension (orange) at 7150 before a larger correction takes place.
-------------------------------------------------------------------------------
** Please LIKE 👍, FOLLOW ✅, SHARE 🙌 and COMMENT ✍ if you enjoy this idea! Also share your ideas and charts in the comments section below! This is best way to keep it relevant, support us, keep the content here free and allow the idea to reach as many people as possible. **
-------------------------------------------------------------------------------
💸💸💸💸💸💸
👇 👇 👇 👇 👇 👇

BUY SPX - S&P500- Amazing low risk high reward trade!Based on our deep analysis we can see that SPX - S&P500 will head to the upside. Great time to buy - it has broken major resistance levels + trends.

S&P500 Can the 1D MA50 save the day?The S&P500 index (SPX) has been trading within a 5-month Channel Up and last Friday's flash crash touched its bottom making a new Higher Low. At the same time, it hit its 1D MA50 (blue trend-line) for the first time May 01 2025.
As long as the market keeps closing the daily candles inside the Channel Up, we expect the new Bullish Leg to start and as the shortest ones did within the pattern, target at least the 1.382 Fibonacci extension level at 6850.
If a 1D candle closes below the Channel Up though, there are higher probabilities to see a stronger dip to the 1D MA100 (green trend-line) a 6400.
On a sidenote, the 1D RSI hit and rebounded on Friday on its Lower Lows trend-line, favoring at the moment a bullish continuation.
-------------------------------------------------------------------------------
** Please LIKE 👍, FOLLOW ✅, SHARE 🙌 and COMMENT ✍ if you enjoy this idea! Also share your ideas and charts in the comments section below! This is best way to keep it relevant, support us, keep the content here free and allow the idea to reach as many people as possible. **
-------------------------------------------------------------------------------
💸💸💸💸💸💸
👇 👇 👇 👇 👇 👇

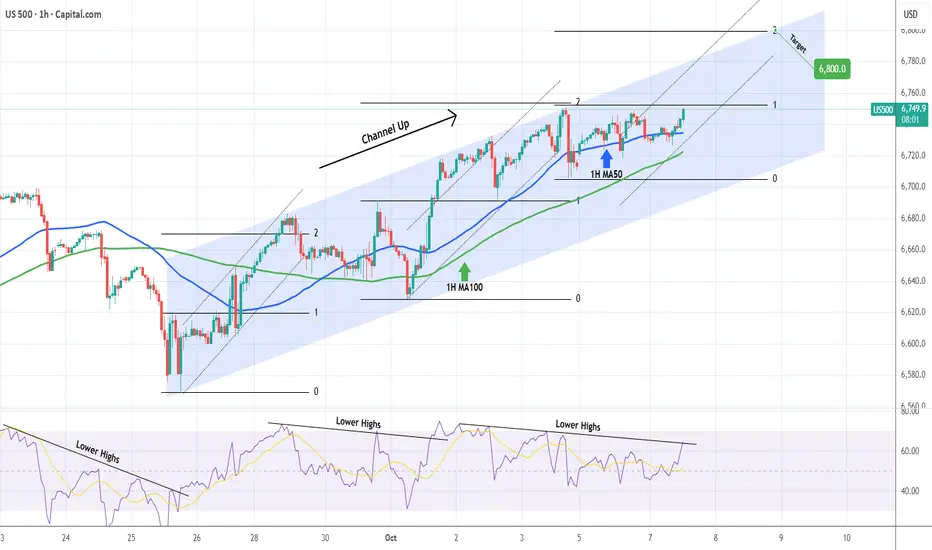
S&P500 Found the Support it needed for 6800.The S&P500 index (SPX) gave us an excellent bottom buy signal last week (September 30, see chart below), rebounding straight after and quickly hitting our 6720 Target:
This time we focus on a much shorter term Channel Up pattern that has emerged, which has just given us another buy signal as it is currently bouncing on its 1H MA50 (blue trend-line).
As long as the 1H MA100 (green trend-line) holds and the 1H RSI breaks above its Lower Highs trend-line, we expect the index to seek a new Higher High on the 2.0 Fibonacci extension at 6800.
-------------------------------------------------------------------------------
** Please LIKE 👍, FOLLOW ✅, SHARE 🙌 and COMMENT ✍ if you enjoy this idea! Also share your ideas and charts in the comments section below! This is best way to keep it relevant, support us, keep the content here free and allow the idea to reach as many people as possible. **
-------------------------------------------------------------------------------
💸💸💸💸💸💸
👇 👇 👇 👇 👇 👇
S&P500 Short-term Bull Flag formed.The S&P500 index (SPX) has been trading within a Channel Up since the July 31 High. The price is currently on its 4H MA50 (blue trend-line), forming a Bull Flag after a 4H MA100 (green trend-line) rebound last Thursday.
This is similar to the Bull Flags of August 25 and 05, which both ended with a rise to the 1.236 Fibonacci extension. Even the 4H RSI sequences among the 3 fractals are similar with their Lower Highs structures. The only difference is that the price bottomed this time on the 4H MA100 (as mentioned), instead of the 4H MA200 (orange trend-line) of the previous 3 times.
As a result, if this Bull Flag holds, we expect a quick rally to 6720 (just under Fib 1.236).
-------------------------------------------------------------------------------
** Please LIKE 👍, FOLLOW ✅, SHARE 🙌 and COMMENT ✍ if you enjoy this idea! Also share your ideas and charts in the comments section below! This is best way to keep it relevant, support us, keep the content here free and allow the idea to reach as many people as possible. **
-------------------------------------------------------------------------------
💸💸💸💸💸💸
👇 👇 👇 👇 👇 👇

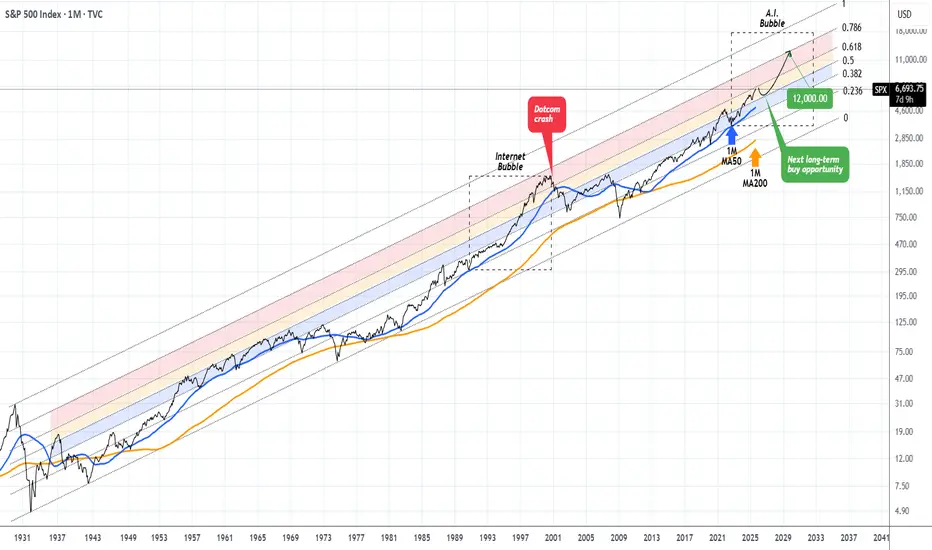
S&P500 approaching a Resistance that was last tested in 1998 !!This isn't the first time we present you this chart, in fact from time to time (usually on a quarterly basis) we like to bring this forward with some adjustments in order to help us maintain a long-term perspective.
And that technically shows the S&P500 index (SPX) trading within a century long Fibonacci Channel Up (since the 2029 Great Depression) with clear Bull and Bear Cycles. We will not get into much details on those, as they've been analyzed extensively in previous publications but we will point out that currently we remain inside a multi-year Bull Cycle.
In fact, since the November 2022 market bottom, we believe we've entered the A.I. Bubble, which is in our opinion (perhaps a more aggressive) version of the Internet Bubble of the 1990s. Again this has been analyzed extensively before.
Right now the index is approaching the top of the 0.5 - 0.618 Fib Zone (orange range). The one above (0.618 - 0.786 Fib, red Zone), was first entered in February 1998 and exited for good at the start of the Dotcom crash in February 2001. Since then, the market never even touched it (almost 25 years).
We believe that a marginal test and break inside this 'ghost zone' could be attempting by late 2025 - Q1 2026 and then a strong correction back near the 1M MA50 (blue trend-line) will present the next long-term buy opportunity that could fuel the A.I. Bubble until it finally bursts within 2030 - 2032.
Until then, a 12000 Target on SPX isn't at all an unrealistic one, in our opinion.
-------------------------------------------------------------------------------
** Please LIKE 👍, FOLLOW ✅, SHARE 🙌 and COMMENT ✍ if you enjoy this idea! Also share your ideas and charts in the comments section below! This is best way to keep it relevant, support us, keep the content here free and allow the idea to reach as many people as possible. **
-------------------------------------------------------------------------------
💸💸💸💸💸💸
👇 👇 👇 👇 👇 👇
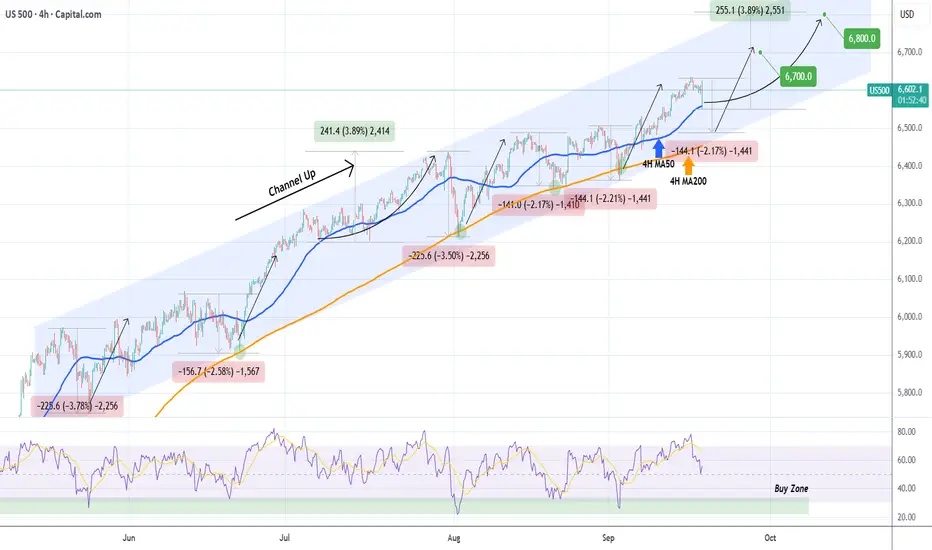
S&P500 Risks drop to the 4H MA200 if MA50 fails.The S&P500 index (SPX) is experiencing a strong intra-day correction that just hit its 4H MA50 (blue trend-line) for the first time since September 05. As long as this holds, we expect a gradual rise, targeting 6800 (representing a +3.89% increase similar to July's).
A 1D candle closing below the 4H MA50 however, has historically paved the way to more selling within the 4-month Channel Up, that touched the 4H MA200 (orange trend-line) before rebounding. If that candle closing takes place, we will close the 4H MA50 buy on minimum loss and buy on the 4H MA200, targeting 6700 (sharp rebound similar to all 4H MA200 bounces).
Keep also an eye on the 4H RSI Buy Zone. It has given the 5 most optimal buy entries during these 4 months. Note also that the 4H MA200 has been holding as Support since the April 25 break-out.
-------------------------------------------------------------------------------
** Please LIKE 👍, FOLLOW ✅, SHARE 🙌 and COMMENT ✍ if you enjoy this idea! Also share your ideas and charts in the comments section below! This is best way to keep it relevant, support us, keep the content here free and allow the idea to reach as many people as possible. **
-------------------------------------------------------------------------------
💸💸💸💸💸💸
👇 👇 👇 👇 👇 👇
S&P500 Rising Wedge break-out imminent.Last week's (September 02, see chart below) buy signal on the S&P500 index (SPX) hit our 6530 Target, as the price reversed on its 4H MA200, which as we mentioned was the market's medium-term Support:
Right now the index is supported by its 4H MA50 (blue trend-line) and is attempting to break above the top (Higher Highs trend-line) of a Rising Wedge similar to the one at the start of the 4-month Channel Up.
As you can see the symmetry between the two patterns is very high and the June break-out led to a +5.70% rise on the 2.5 Fibonacci extension before the next consolidation. A potential +5.70% rise from he recent 4H MA50 Low would now be at 6720 and that is our short-term Target.
-------------------------------------------------------------------------------
** Please LIKE 👍, FOLLOW ✅, SHARE 🙌 and COMMENT ✍ if you enjoy this idea! Also share your ideas and charts in the comments section below! This is best way to keep it relevant, support us, keep the content here free and allow the idea to reach as many people as possible. **
-------------------------------------------------------------------------------
💸💸💸💸💸💸
👇 👇 👇 👇 👇 👇
S&P500 Strong buy signal if the 4H MA200 holds.The S&P500 index (SPX) has been pulling back since the August 28 All Time High (ATH) and is headed for a 4H MA200 (orange trend-line) test.
This is a major short-term buy point as since April 25, every contact with this trend-line (6 so far) resulted into a new rally/ Bullish Leg.
The last two in particular rose as high as the 1.236 Fibonacci extension. So as long as the 4H MA200 holds, that gives us a 6530 short-term Target.
-------------------------------------------------------------------------------
** Please LIKE 👍, FOLLOW ✅, SHARE 🙌 and COMMENT ✍ if you enjoy this idea! Also share your ideas and charts in the comments section below! This is best way to keep it relevant, support us, keep the content here free and allow the idea to reach as many people as possible. **
-------------------------------------------------------------------------------
💸💸💸💸💸💸
👇 👇 👇 👇 👇 👇

S&P500 3-month Channel Up still valid. Buy.The S&P500 index (SPX) kept its 3-month Channel Up intact last week despite a short-term correction as the price stopped exactly on its bottom (Higher Lows trend-line) and following Chair Powell's remarks on rate cut possibilities, it rebounded aggressively.
Given also that the 1D MA50 (blue trend-line) has been its long-term Support since May 01, the stage is set for the pattern's new Bullish Leg. With the last one being +8.80%, we expect the index to hit at least 6750 next.
-------------------------------------------------------------------------------
** Please LIKE 👍, FOLLOW ✅, SHARE 🙌 and COMMENT ✍ if you enjoy this idea! Also share your ideas and charts in the comments section below! This is best way to keep it relevant, support us, keep the content here free and allow the idea to reach as many people as possible. **
-------------------------------------------------------------------------------
Disclosure: I am part of Trade Nation's Influencer program and receive a monthly fee for using their TradingView charts in my analysis.
💸💸💸💸💸💸
👇 👇 👇 👇 👇 👇

S&P500 Can the 4H MA50 save the day again?The S&P500 index (SPX) is on a short-term pull-back following the new All Time High (ATH) on August 15 of the 3-month Channel Up. It is just above the 4H MA50 (blue trend-line), which has been the most common level of Support throughout this pattern, before the 4H MA200 (orange trend-line), which formed its last Higher Low.
As a result, as long as it holds, it is more likely to see a continuation of the Bullish Leg that started on the 4H MA200 bounce (August 01). The previous Bullish Leg peaked on a +8.80% rise, so that gives us a medium-term Target of 6750.
-------------------------------------------------------------------------------
** Please LIKE 👍, FOLLOW ✅, SHARE 🙌 and COMMENT ✍ if you enjoy this idea! Also share your ideas and charts in the comments section below! This is best way to keep it relevant, support us, keep the content here free and allow the idea to reach as many people as possible. **
-------------------------------------------------------------------------------
Disclosure: I am part of Trade Nation's Influencer program and receive a monthly fee for using their TradingView charts in my analysis.
💸💸💸💸💸💸
👇 👇 👇 👇 👇 👇

SPX Weak Bearish Bias → 6440P Caution Trade
# 🏦 SPX Weekly Options Analysis – 8/18
📉 **Market Context**
* Mixed signals across metrics → weak bearish bias
* Price below VWAP → potential short-term downside
* Volume insufficient → low conviction
* Call/Put ratio neutral → no strong directional bias
---
## 🎯 Trade Setup (Cautious Put)
* **Instrument**: SPX
* **Direction**: PUT (SHORT)
* **Strike**: 6440
* **Expiry**: 2025-08-18
* **Entry Price**: \$0.60
* **Profit Target**: \$1.20
* **Stop Loss**: \$0.30
* **Size**: 1 contract
* **Confidence**: 60%
* **Entry Timing**: Market Close
---
## 📈 Breakeven @ Expiry
👉 6439.40 (Strike – Premium)
SPX must **close < 6439.40 by market close** to profit at expiry.
---
## 🧠 Key Risks
* Mixed signals → potential whipsaw ⚡
* Market structure unclear → downside not guaranteed
* Theta decay risk → short-term option, fast time decay
---
# ⚡ SPX 6440P SHORT PLAY ⚡
🎯 In: \$0.60 → Out: \$1.20
🛑 Stop: \$0.30
📅 Exp: 8/18
📈 Bias: Weak Bearish, trade cautiously 🐻
---
📊 **TRADE DETAILS JSON**
```json
{
"instrument": "SPX",
"direction": "put",
"strike": 6440.0,
"expiry": "2025-08-18",
"confidence": 0.60,
"profit_target": 1.20,
"stop_loss": 0.30,
"size": 1,
"entry_price": 0.60,
"entry_timing": "close",
"signal_publish_time": "2025-08-18 15:02:25 UTC-04:00"
}

S&P500 Channel Up going straight to 6670.The S&P500 index (SPX) has been trading within a 3-month Channel Up since the May 12 candle. All of this time, it has been supported by the 1D MA50 (blue trend-line) and as long as it holds, the new Bullish Leg is expected.
The last two rose by +7.06%, and ahead of a new 1D MACD Bullish Cross, that gives us a medium-term Target of 6670.
-------------------------------------------------------------------------------
** Please LIKE 👍, FOLLOW ✅, SHARE 🙌 and COMMENT ✍ if you enjoy this idea! Also share your ideas and charts in the comments section below! This is best way to keep it relevant, support us, keep the content here free and allow the idea to reach as many people as possible. **
-------------------------------------------------------------------------------
Disclosure: I am part of Trade Nation's Influencer program and receive a monthly fee for using their TradingView charts in my analysis.
💸💸💸💸💸💸
👇 👇 👇 👇 👇 👇

S&P500 (CASH500) SHORT - Double top H6Risk/reward = 3.7
Entry price = 6432.6
Stop loss price = 6 454.1
Take profit level 1 (50%) = 6367.7
Take profit level 2 (50%) = 6332.6
Still need confirmation from some variables before entering the trade
S&P500 (CASH500) SHORT - head and shoulders 30minRisk/reward = 4.1
Entry price = 6378
Stop loss price = 6385.9
Take profit level 1 (50%) = 6349.2
Take profit level 2 (50%) = 6337.2
Still waiting on confirmation of a few variables at close of this 30min candle at 17.00

S&P500 This is why every CORRECTION is a GIFT.The S&P500 index (SPX) has been steadily rising since the April bottom to new All Time Highs (ATH). On the grand 100 year scale, the February - March tariff fueled correction, has been nothing significant. The last true technical correction has been the 2022 Inflation Crisis because it touched, and instantly rebounded on, the 1M MA50 (blue trend-line).
This is not the first time we bring forward our multi-decade perspective on stock and in particular this chart. But it serves well, keeping us into the meaningful long-term outlook of the market. This suggests that since the Great Depression and the first signs of recovery after the 1935 - 1941 Bear Cycle, the market has entered a multi-decade Channel Up, which is divided into long-term aggressive expansion periods (Bull Cycles) and shorter term depressions (Bear Cycles).
During a Bull Cycle, every test of the 1M MA50 is a instant cyclical buy opportunity and in fact that isn't presented very often. During a Bear Cycle, the market makes an initial aggressive correction below the 1M MA50, turns increasingly volatile for 5-7 years, trading sideways within the Channel Up with its second peak resulting into a 2nd correction that eventually breaks below the 1M MA200 (orange trend-line).
That is what we call a 'generational buy opportunity' as in the past 80 years, it has only been taken place 2 times.
Right now (again this is not something we mention for the first time), the market is at the start of the A.I. Bubble, with incredibly strong similarities with the Internet Bubble of the 1990s.
In fact, relative to the Internet Bubble, it appears that we are on a stage similar to 1993 - 1994, before the market turned parabolic to the eventual Dotcom Bust of 2000.
As a result, from a technical perspective, every 'small' correction such as the one we had this year, is a blessing in disguise (buy opportunity). As the index grew by 5 times during the Internet Bubble (300 to 1500), it is also very possible to see it approach this feat going from roughly 3500 (late 2022) to 14000 (by late 2032) and touch the top of the multi-decade Channel Up.
Are you willing to miss out on this generational wealth creation opportunity?
-------------------------------------------------------------------------------
** Please LIKE 👍, FOLLOW ✅, SHARE 🙌 and COMMENT ✍ if you enjoy this idea! Also share your ideas and charts in the comments section below! This is best way to keep it relevant, support us, keep the content here free and allow the idea to reach as many people as possible. **
-------------------------------------------------------------------------------
💸💸💸💸💸💸
👇 👇 👇 👇 👇 👇

S&P 500 (CASH 500) SHORT - Double top H8Risk/reward = 4.1
Entry price = 6343.3
Stop loss price = 6365.3
Take profit level 1 (50%) = 6268.1
Take profit level 2 (50%) = 6232.1
Still waiting on some variables on checklist to be confirmed before I enter the trade.
