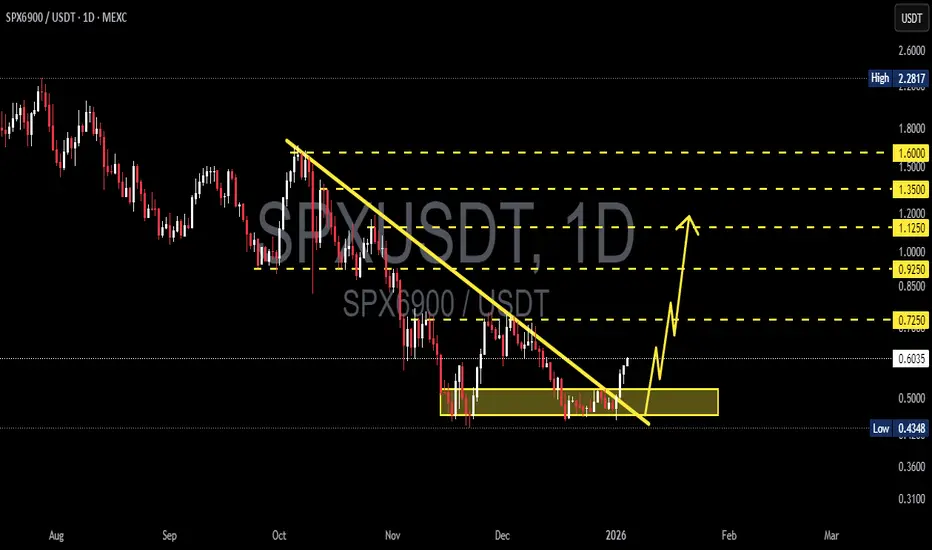
SPX/USDT - Reversal Signal After Descending Trendline PressureSPX6900 has been moving in a clear downtrend structure, characterized by consistent Lower Highs (LH) and Lower Lows (LL). The descending trendline has been acting as strong dynamic resistance since the price peaked around the 1.6 USDT area.
Currently, price has reached a major demand zone (support area) around 0.45 – 0.55 USDT, highlighted by the yellow box on the chart. This zone has historically triggered strong buying reactions.
Most importantly, recent candles show a bullish reaction and an attempt to break above the descending trendline, signaling potential momentum exhaustion on the bearish side.
---
📐 Pattern Explanation
1. Descending Trendline (Bearish Market Structure)
Price has been trading below the descending trendline for an extended period.
Every bullish attempt was rejected at the trendline, confirming seller dominance.
2. Strong Demand / Accumulation Zone
The 0.45 – 0.55 USDT area acts as a key support level.
Multiple rejections from this zone indicate accumulation by buyers.
3. Early Trendline Break Attempt
Price is attempting to break the descending trendline.
A daily close above the trendline is required for valid confirmation of a trend shift.
---
📈 Bullish Scenario
If price:
Closes above the descending trendline
Holds above the 0.55 – 0.60 USDT support area
Then bullish continuation becomes likely, with upside targets:
🎯 Bullish Targets (Resistance Levels):
0.725 USDT
0.925 USDT
1.00 – 1.125 USDT
1.35 USDT
1.50 – 1.60 USDT (major resistance zone)
📌 This scenario will be strengthened by increasing volume and the formation of Higher Lows (HL).
---
📉 Bearish Scenario
The bearish scenario remains valid if:
Price fails to hold above 0.55 USDT
Strong rejection occurs at the descending trendline
⚠️ Downside risks:
Retest of the 0.45 USDT support
Breakdown below demand may push price toward 0.40 – 0.36 USDT
📌 A clean breakdown below the demand zone would invalidate the reversal scenario and confirm bearish continuation.
---
🧠 Key Takeaway
SPX6900 is currently trading at a critical decision zone:
Major demand area
Descending trendline breakout attempt
Price is deciding between: 👉 A bullish reversal and trend change
or
👉 Continuation of the broader bearish trend
Daily candle confirmation is crucial.
---
#SPX6900 #SPX6900USDT #CryptoTechnicalAnalysis #AltcoinAnalysis #DailyChart #TrendlineBreak #DescendingTrend #DemandZone #SupportResistance #BullishScenario #BearishScenario #PriceAction #CryptoTrading
Spxusdsignals
SPX/USDT – Breakout WatchSPX is currently testing a major horizontal resistance zone around 1.34–1.36, after a consistent series of higher lows forming an ascending triangle.
Trade Setup:
Entry (after breakout and retest): 1.34–1.36
Targets:
First target: 1.475
Second target: 1.567
Final target: 1.701
Stop Loss: Below 1.29
Structure: Ascending triangle showing compression and bullish pressure
RSI: Trending up, signaling possible continuation
This setup requires patience — the ideal long entry is after a breakout with successful retest. Rushing in early can be risky.
Do your own research. Not financial advice.

SPX did everything as per the plan, Where to now?I posted this chart just last week as part of my Major short setup going back weeks. Link to previous post in the description, please go through that setup to get the context.
This is going to be a short post, since everything is going as per the plan we just have to wait and watch, Price back to where I expect either a break below or bounce to continue higher.
So as per the plan If it's going to bounce now, I have highlighted two 30 mins demand zones. where I expect a bounce. Those two zones are also confluent with 0.786 and 0.886 fibs of the retracements.
Apart from this chart it pretty is self-explanatory.
Boost this post and leave me comment for any questions on this I'd be happy to explain.

S&P500 Low target achieved. Time to rise now.On last week's analysis on S&P500, we called for a pull-back targeting 4400:
The target has now been hit and as the price hit both the 1D MA50 (red trend-line) and the 4H MA200 (orange trend-line), the conditions started to be fulfilled for a rise again. The fractal that helped me identify the incoming correction to 4400 was the one in November 2021, which also pulled-back after a Head and Shoulders formed the top. The only parameter that has been left unrealized is contact with the 0.5 Fibonacci retracement level. However we can argue that 4390 is as close to 4372 it can get.
The RSI patterns of the two fractals continue to be identical. Once the 4H MA50 (blue trend-line), which on December 06 2021 was the confirmation for the rise, breaks, we expect a test of the 4750 Resistance (1).
--------------------------------------------------------------------------------------------------------
Please like, subscribe and share your ideas and charts with the community!
--------------------------------------------------------------------------------------------------------

S&P500 Critical do-or-die test of the 4H MA200-1DMA50 ResistanceThe S&P500 index just made an important move today, by closing (even marginally) a 4H candle above the 4H MA200 (orange trend-line), for the first time since January 13 (practically the start of the correction).
So far it appears that it is following the fractal pattern I suggested at the start of the month with high precision:
As you see, the only barriers left based on this comparison are the Lower Highs trend-line since the All Time High (ATH) and the 1D MA50 (which on today's analysis is illustrated in red). Technically we can say that the ultimate Resistance Zone is the area within the 4H MA200 and the 1D MA50. A candle close above it, should push the index towards the 0.618 Fibonacci (4545) and the February Resistance (4595), which had two rejections on February 02 and 09. Similarly a break above that zone should set in motion a full recovery towards the ATH.
On the other hand, if the price gets rejected within the 4H MA200 - 1D MA50 Resistance Zone, it should pull-back initially to the 4H MA50 (blue trend-line). A break/ close below that trend-line targets the 4140 - 4107 Support Zone made of the two recent lows. The scenario of a break even below those lows, has SPX going for the Lower Lows trend-line and then (after possibly a re-test of the 4H MA50 as Resistance) the -0.236 Fibonacci extension. But I will make an update in such case.
--------------------------------------------------------------------------------------------------------
** Please support this idea with your likes and comments, it is the best way to keep it relevant and support me. **
--------------------------------------------------------------------------------------------------------

SPXUSD#SPXUSD Sell Trade setup now price on supply zone best trade for short term selling. Multiple time frame analysis.
Thank you..

S&P500 Is it getting ahead of itself?The index has been trading within a Channel Up since the November 2020 elections. The barometer has always been the 1D MA50 (blue trend-line) mostly, where the majority of buy accumulation has been taking place. The Ichimoku Cloud is second. What we see now is the price trading very close to the Higher Highs trend-line and although it can break the 4,400 - 4,420 zone and trade just under the Higher Highs trend-line for a long period of time (like Nov 2020 - Jan 2021 and April 2021 - May 2021), it is best to stay focused and use the long-term perspective as a guide. The RSI offers a good viewpoint as well, especially in terms of the consolidation near the Higher Highs, but it also has a clear 1 year Buy Zone and that is within 43.000 - 35.000.
** Please support this idea with your likes and comments, it is the best way to keep it relevant and support me. **
--------------------------------------------------------------------------------------------------------
!! Donations via TradingView coins also help me a great deal at posting more free trading content and signals here !!
🎉 👍 Shout-out to TradingShot's 💰 top TradingView Coin donor 💰 this week ==> Ether2020
--------------------------------------------------------------------------------------------------------

RSI bullish divergencePattern: Fibonacci Channel on 4H.
Signal: Buy as the price made a bottoming Lower Lows sequence similar to that of January 29.
Target: 4020 - 4050 (the zone around the 1.382 Fibonacci extension).
** Please support this idea with your likes and comments, it is the best way to keep it relevant and support me. **
--------------------------------------------------------------------------------------------------------
!! Donations via TradingView coins also help me a great deal at posting more free trading content and signals here !!
🎉 👍 Shout-out to TradingShot's 💰 top TradingView Coin donor 💰 this week ==> alanmasters
--------------------------------------------------------------------------------------------------------
