SPY Bullish Breakout: Flag Setup Aims for 700–715SPY remains in a strong 1D uptrend, printing higher highs and higher lows from June through November. Price continues to respect the 20-day MA as dynamic support, with a clean demand zone near $671.72. Overhead, the recent all-time high at $689.76 aligns with the upper boundary of a developing bull flag (upper trendline ≈ $688). Structure is bullish; momentum stays positive while volatility cools after October’s expansion.
Primary path: a daily close above $689.76/$690 confirms the flag breakout and likely drives a continuation toward the psychological $700 handle first, then the $710–$715 extension as participation broadens. Alternatively, a constructive pullback into $671–$675 offers a dip-buy zone so long as the 20-day MA holds. If $671.72 fails decisively, watch the 60-day MA around $658.57 as the next support area.
Triggers and risk: Break-and-hold above $690 or a strong rebound from $671 activates longs; scale out near $700 with room for $710–$715 if momentum persists. Invalidation for breakout entries sits below the recent consolidation lows around $678; for dip buys, a break under the prior swing low near $668 negates the immediate bullish thesis. A daily close below $671 would be an early bearish warning. This is a study, not financial advice. Manage risk and invalidations
SPDR S&P 500 ETF (SPY)

LLY LOOKS BULLISH OCT 31 2025I have LLY from lower levels of 870ish which was trade 2. Trade 1 was initiated at 637. Now again it looks ready to go to 890
I am long since $815 yesterday.
Trade as per your risk management and its a current price trade so SLs would be huge. But I can understand what price is trying to do here.
LLY should breakout

ES (SPX, SPY) Analysis, Key Zones, Setups for Fri (Oct 31st)Kill-zones (ET): NY AM 09:30–11:00; manage 12:00–13:00; NY PM 13:30–16:00.
Event (Fri): 9:45 ET Chicago PMI (unaffected by shutdown).
Upside continuation (LONG):
6,910 flips to support with a 15m close above → 5m pullback holds → 1m HL entry.
SL: 15m trigger-wick ±0.25–0.50.
TP1 6,928; TP2 6,945–6,955; TP3 6,980–7,000.
Quick-reclaim bounce at 6,889–6,888: sweep and instant reclaim → ride to 6,898 → 6,904–6,910.
Pop-and-fail shorts (SHORT):
Reject 6,904–6,910 then 15m closes back under 6,904 → 5m LH entry.
SL: 15m wick.
TP1 6,898; TP2 6,889; TP3 6,879.
Clean breakdown of 6,889 with a 15m close ≤6,887 → 5m LH entry.
TP1 6,879; TP2 6,865; TP3 6,845.
Management & risk
Viability gate: only take a trade if TP1 ≥ 2.0R using the 15m-wick stop.
At TP1: close 70%, set the 30% runner to BE; runner aims TP2→TP3.
Max two attempts per level per session.
Day 59 — Trading Only S&P Futures | +$142 & Netflix Split Recap & Trades
Day 59 — started off strong shorting 6930 resistance right out the gate.
Those early plays hit perfectly, and I built up about +$300 in profit.
Later, I got a little greedy — took a risky end-of-day setup, got stopped out right before a recovery, and ended up finishing at +$142.
Could’ve been a bigger day, but I’ll take a green close any time I stick to the plan.
Lesson & Mindset
Sometimes the best win is walking away with discipline intact.
Once you’re up early, your focus should shift from “how much can I make” to “how well can I protect it.”
That mindset compounds long-term consistency.
News & Levels
Big market story today — Netflix just announced a 10-for-1 stock split.
Tomorrow’s levels: Above 6920 bullish, below 6875 bearish.

Silver bull will try to throw you off, but long term healthyA pause that could refresh might be warranted in silver and gold.
I am still optimistic for precious metals long term.
Silver is still undervalued based on historical metrics and money supply.
I worry about the rise in metals and what it implies for the broad stock market indices.

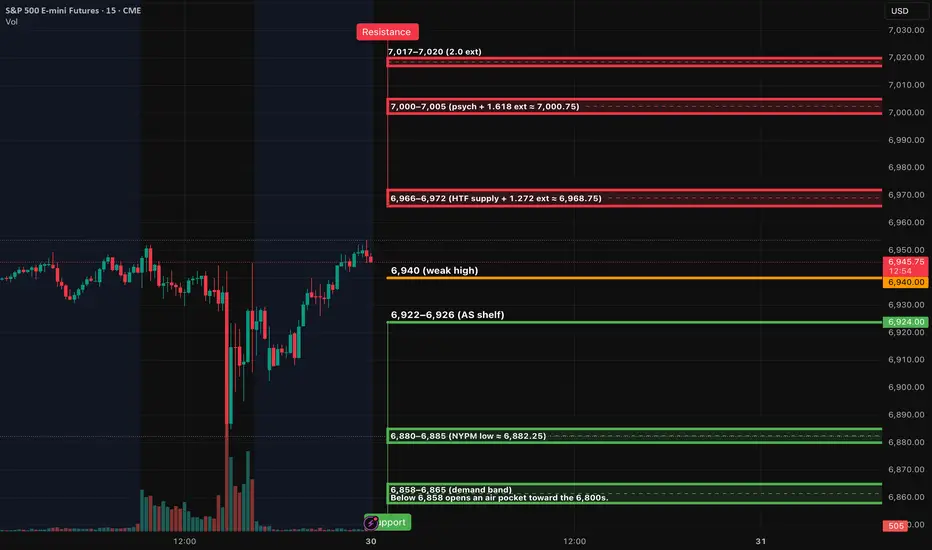
ES (SPX, SPY) Analysis, Key Zones, Setups for Thur (Oct 30th)Bias: Neutral → mild-bullish while 6,922 holds; momentum unlocks only on acceptance above the 6,966–6,972 pocket.
Setups — Rejection Fade (short): Tag 6,966–6,972 and print a 15m rejection close back inside, then a 5m re-close lower with a lower high, then take the 1m first-pullback fail. Stop = 15m wick high +0.25–0.50. TP1 = 6,940. TP2 = 6,922. Runner aims 6,885.
Setups — Acceptance Continuation (long): 15m full-body close above 6,972, 5m pullback holds and re-closes, then 1m higher-low entry. Stop = 6,966 wick. TP1 = 7,000. TP2 = 7,017. Stretch into low 7,040s if momentum persists.
Setups— Quick-Reclaim Bounce (long): Flush into 6,922–6,926 that instantly reclaims on 15m, 5m re-close confirms, then 1m higher-low entry. Stop = 6,916. TP1 = 6,940. TP2 = 6,966–6,972.
Setups — Breakdown Continuation (short): 15m body through 6,922 that holds below on a 5m retest. Stop = 6,929–6,932. TP1 = 6,900. TP2 = 6,885. Stretch 6,858 if pressure accelerates.
Management: only take a setup if TP1 is at least 2.0R using the 15m-wick stop. At TP1, close 70% and set the 30% runner to break-even; runner targets the next opposing major level. No trailing before TP2. Maximum two attempts per level per session.
Invalidation: Bull idea is invalid below 6,916 (loss of the AS shelf). Bear idea is invalid once there is 15m acceptance and hold above 6,972 with 5m higher-low structure.
Notes: Expect headline sensitivity. If we rip into 6,966–6,972 without a 15m close above, favor the fade. If we grind above and hold, ride acceptance toward 7,000 then 7,017.
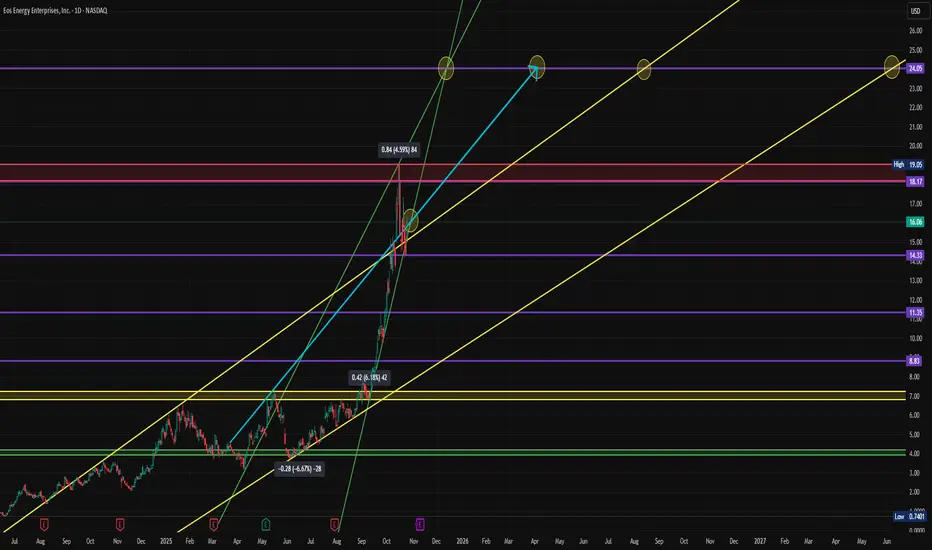
$EOSE - Next Move Above $18 or Pullback Reload to $14?NASDAQ:EOSE (Eos Energy Enterprises) has been a quiet outperformer this year — rising from $0.42 lows to a recent high near $18.17 (+4,000% YTD).
After a massive rally, price is now consolidating above $14.33 support while eyeing resistance near $19.05 and the next projection zone at $24.05 based on trend channel extensions (see chart).
🧩 Technical Breakdown
📈 Primary uptrend intact — higher highs / higher lows since May 2025.
🟡 Support: $14.33 (major structural level), $11.35 secondary, $8.83 extended.
🔵 Resistance: $18.17 then $19.05 (high confluence).
🎯 Upside targets: $24.05 and $26 via Fib 1:1 extension.
⚠️ Risk zone: Break below $14.00 could invite a pullback toward the 11–9 region before the next leg up.
📊 Fundamental Context
Recent catalysts keep bulls interested despite volatility:
Guggenheim raised its price target from $10 to $20 (maintaining a Buy rating).
$24 million economic development package awarded by Pennsylvania & Allegheny County for U.S. manufacturing expansion.
Multi-year partnership with Unico to launch ultra-compact power conversion products for domestic LDES systems.
📉 Counter-Sentiment Data (From Schwab QORE Analytics)
Schwab currently rates EOSE as F (Strongly Underperform) with High volatility — a classic contrarian setup that often precedes sharp re-ratings once earnings stabilize (next report expected week of Nov 4).
Momentum metrics show +41.4% over 4 weeks and +209.9% over 26 weeks — this is not a quiet chart.
💡 My Plan
Looking for entries around $14.33 support with a tight stop below $14.00. If stopped out, I’ll wait for accumulation in the $11–9 zone for a lower-risk swing position into Q4/Q1 ’26.
Above $19 opens the door to $24+ in the coming months if the manufacturing story keeps momentum.
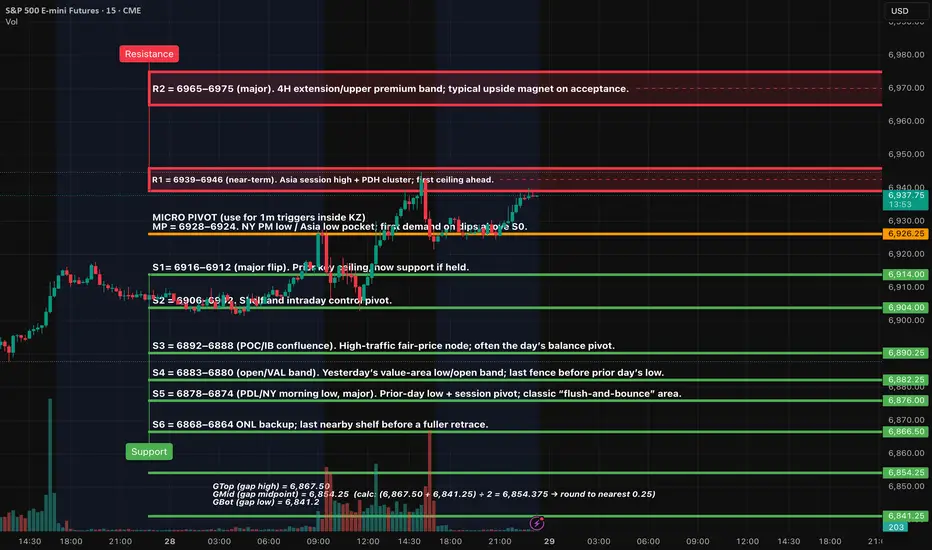
ES (SPX, SPY) Analysis, Key Levels, Setups for Wed (Oct 29)As we look at the current market conditions, the price is hovering just below the 6939-6946 resistance level. We should anticipate a test of this ceiling soon. A solid acceptance above 6946 on the 15-minute chart would likely trigger a movement towards the 6965-6975 range, which we can expect to see during the afternoon session in NY.
In terms of our range path, if we see rejection in the 6939-6946 zone, we will need to monitor for rotations between 6939, 6928, and 6916. A clean break beyond any of these levels will help establish our direction moving forward.
On the downside, a decisive 15-minute close below the 6916-6912 area could lead us back to the 6900-6896 levels. If that support fails, we could see a drop to 6892-6888, and then down to 6883-6880. Persistent acceptance below our S5 level would promote a further decline towards 6868-6864 and potentially trigger the gap references.
Lastly, I want to highlight that we should expect a compression-to-expansion behavior in the market. Thus, the first acceptance beyond R1 or below S0 will likely dictate the market's direction for the day.
Level-KZ Protocol (15/5/1). Execute inside London 02:00–05:00 (opt), NY AM 09:30–11:00, NY PM 13:30–16:00.
Working levels: R2 6965–6975; R1 6939–6946; MP 6928–6924; S0 6916–6912; S2 6900–6896; S3 6892–6888; S4 6883–6880; S5 6878–6874.
SETUP 1 — Acceptance-Continuation LONG (through R1)
Trigger: 15m close ≥ 6946, then 5m pullback holds above 6940 and re-closes; 1m HL entry.
Entry: 6942–6946 on the reclaim/HL.
SL: Hard SL below the 15m pullback wick (typically 6937–6939) ±0.25–0.50.
TP1: 6965–6975 (R2).
TP2: Leave runner only if momentum persists beyond R2 during NY PM.
Invalidation: 15m close back under 6939 with a 5m LH.
SETUP 2 — Rejection-Fade SHORT (at R1)
Trigger: Sweep into 6939–6946 that fails → 15m close back inside; 5m LH + 1m first pullback failure.
Entry: 6937–6943 on the fail.
SL: 6948–6950.
TP1: 6928–6924 (MP).
TP2: 6916–6912 (S0).
Stretch: 6900–6896 (S2) if acceptance forms below S0.
Invalidation: 15m acceptance ≥ 6946.
SETUP 3 — Quick-Reclaim Bounce LONG (MP)
Trigger: Fast flush into 6928–6924 that instantly reclaims on 1m and prints a 5m re-close.
Entry: 6926–6929 on the reclaim.
SL: 6923.25–6923.75.
TP1: 6939–6946 (R1).
TP2: 6965–6975 (R2) only after 15m acceptance through R1.
Invalidation: 15m close back below 6924.
SETUP 4 — Quick-Reclaim Bounce LONG (S0 flip)
Trigger: Sweep/flush into 6916–6912, immediate reclaim → 5m re-close.
Entry: 6917–6920 on strength back above 6916.
SL: 6911.50–6912.00.
TP1: 6928–6924 (MP).
TP2: 6939–6946 (R1).
Invalidation: 15m body-through below 6912.
SETUP 5 — Back-Inside Failure SHORT (under S2)
Trigger: 15m body close < 6896, then 5m retest of 6900–6896 holds from below.
Entry: 6898–6900 on the fail.
SL: 6903.00–6903.50.
TP1: 6892–6888 (S3).
TP2: 6883–6880 (S4).
Stretch: 6878–6874 (S5) — expect bounce attempts.
Invalidation: 15m reclaim ≥ 6900 with 5m re-close.
US Equities have this week left... only this week to be (divergently) bullish.
5 Nov or thereabouts should break down for three weeks.
26 Nov should expect a bounce, Santa rally into the 2026 New Year. 2026 looks terrible really...
Short sharp and sweet.
Take care!

SPX - The Road to 6900 Begins “History never repeats itself. Man always does.”
A deep look into SPX History exposes the path of a market cycle and tells us the truth on where markets are headed.
Percentages don't lie.
See you guys at 6900!

Natural Gas - Did You Profit?Today natural gas saw some downside pressure.
We closed our KOLD long - which was our short trade on Nat Gas, netting over 8% gain.
Being nimble in the Nat gas market is key, as its a very choppy asset and gains can be lost very quickly.
Breaking below the 7 day MA needs to be watched closely as it does leave room for more downside.
Inventories lately have been lack luster and need to show some positivity before price start to gravity to the weekly trend.

$FLY Firefly Stock Position Update and AnalysisOverview of Recent Positioning in Firefly ( NASDAQ:FLY )
On October 6th, I initiated a position in Firefly stock, purchasing a quarter-size allocation following the company's announcement of a deal to acquire SciTec, a firm specializing in military technology solutions. This acquisition was highlighted by Firefly CEO Jason Kim, who stated, "The acquisition of SciTec enhances our ability to support a growing number of defense missions and provides us with a significant operational advantage. SciTec's mission-proven software and big data processing capabilities provide warfighters with rapid, accurate information to enable informed decisions."
Stock Performance and Position Adjustment
After the acquisition news, Firefly's shares climbed 6.3% on Monday, October 6th closing at $29.09, with my entry price at $28.75. The stock continued to show strength, rallying again on October 8th. In response to this price action, I increased my stake by adding another quarter-size position, bringing my total investment to a half-size allocation.
Technical Analysis and Trading Plan
Since increasing my position, Firefly stock has traded sideways, which I interpret as a base-building phase. In today’s premarket trading, the price has moved just above what appears to be a key area of resistance, marked by a blue horizontal line on the 65-minute chart. Looking ahead, there is another potential resistance level at the previous high’s AVWAP (Anchored Volume Weighted Average Price).
I have set an alert on the AVWAP level. If the stock price breaks above this point, I plan to increase my allocation to a full-size position.
Trading Principles
As always, I encourage readers to analyze this idea independently and adhere to their personal trading rules. Please remember that any investment involves risk, and it is essential to make informed decisions with your own capital.

$TMUS Earnings and Technical AnalysisUndercut and Reverse Pattern Observed in TMUS
On October 23rd, T-Mobile US (TMUS) released its earnings report, surpassing analyst expectations. Despite the positive results, the stock initially experienced a sell-off and closed down approximately 3.3%. The overall downward movement exceeded 5%, with trading on October 24th pushing the stock below its June lows. However, the following day saw a positive shift, as the stock closed higher and rallied past the previous June low. This price action meets the criteria for an Undercut and Rally formation.
Trading Strategy and Position Management
After observing these developments, I waited until today to confirm a potential follow-through day. When the stock rallied above yesterday’s high, I initiated a new position at half of my typical size, setting a stop-loss just below the most recent low to manage risk. Despite this move, TMUS remains under all of its key moving averages. It is currently attempting to reclaim the 5-day moving average (DMA). The next targets for the stock would be the 10-day and then the 20-day moving averages. Should TMUS successfully move above the 20 DMA, I plan to consider adding to my position.
Q3 2025 Earnings Performance
On Thursday, October 23, 2025, at 6:58 AM ET, T-Mobile US reported earnings of $2.59 per share for the third quarter ended September 2025, with revenue totaling $21.96 billion. These results exceeded consensus estimates of $2.42 per share in earnings and $21.73 billion in revenue. The Earnings Whisper number was $2.56 per share, indicating that TMUS beat expectations by 1.17%. Additionally, revenue increased by 8.90% compared to the same period last year.
Disclaimer
Readers are strongly encouraged to conduct their own analysis and to adhere to their personal trading rules. Investing in the stock market always carries risk, and it is essential to make informed decisions with your own capital.

S&P 500 looks Bearish Correction But Fed is Coming...SPX500 – Technical & Fundamental Overview
The index remains under bullish momentum, but a short-term correction toward 6838 from the pivot line at 6889 is possible before the next directional move.
Technical Outlook:
A 1H close below 6839 would confirm a bearish reversal, targeting 6769 as the next support.
However, a 1H close above 6889 would reinforce the bullish trend, paving the way toward 6941 and 6991 — with potential for a momentum-driven continuation if sentiment stays positive.
Pivot Line: 6889
Support Levels: 6840 · 6800 · 6769
Resistance Levels: 6940 · 6991
Fundamental Context:
Traders are positioning cautiously ahead of this week’s Trump–Xi trade talks, which could shape near-term market sentiment. Optimism over a potential U.S.–China tariff framework and expectations that the Federal Reserve may cut rates again are supporting risk appetite.
However, with indices at record highs and AI-related stocks heavily concentrated, any disappointment in the trade outcome or earnings results could spark a sharper downside reaction.
In short, bullish while above 6889, but watch for volatility driven by trade headlines and Fed signals in the coming sessions.

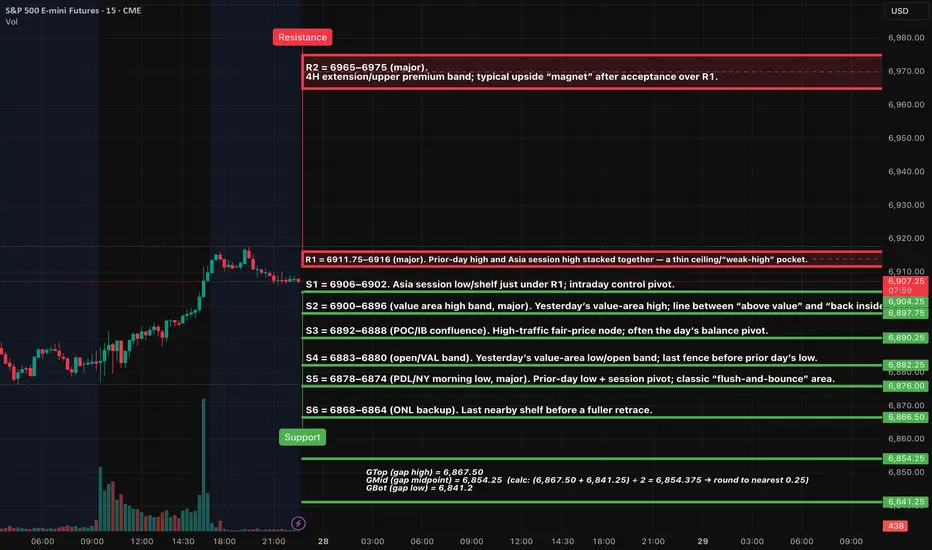
ES (SPX, SPY) Analysis, Key Levels, Setups for Tue (Oct 28th)ES Context:
The trend is upward on the higher time frame, approaching a "weak-high" area just above the previous day's high (PDH). With FOMC Day-1 and consumer confidence news approaching, I expect the Asia and London sessions to trade within a range around or below the PDH, with a risk of a sweep and retest before any potential extension. The bias is slightly bullish as long as we remain above yesterday’s value area. The invalidation point is a 15-minute close below the previous day's low (PDL).
Setup 1 — Long above R1 (acceptance continuation)
Trigger: 15m full-body close ≥ 6912, then 5m pullback holds/re-closes above 6912.
Entry: 6913–6915
Stop: 6905
TP1: 6924–6930
TP2: 6965–6975
Cancel: if retest fails to hold above 6912.
Setup 2 — Short at R1 (rejection fade)
Trigger: Probe ≥ 6912 fails; 15m closes back below 6909; 5m LH re-close.
Entry: 6907–6910
Stop: 6917
TP1: 6900–6896
TP2: 6883–6880
Runner: 6878 → 6867.50 if momentum continues.
Setup 3 — Long from GMid (partial gap-fill reclaim )
Trigger: Wick into 6852–6855, then 5m reclaim ≥ 6856.
Entry: 6856–6858
Stop: 6848
TP1: 6867.50 (GTop)
TP2: 6900–6906
Setup 4 — Long from GBot (full gap-fill reversal)
Trigger: Fast tag of 6841–6842, then 5m reclaim ≥ 6846.
Entry: 6846–6848 on retest hold
Stop: 6836
TP1: 6854.25 (GMid)
TP2: 6867.50 (GTop)
Cancel: 15m body closes back below 6841.
Execution rules
Trade inside kill-zones only (London 02:00–05:00 ET; NY AM 09:30–11:00; NY PM 13:30–16:00).
Take a setup only if TP1 ≥ 2.0R versus the stated stop.
At TP1 close 70% and set 30% runner to BE; no trailing before TP2.
Catalysts for Tue, Oct 28 (all times ET; all listed items expected to proceed despite the shutdown)
09:00 — S&P CoreLogic Case-Shiller Home Price Indices (private release).
10:00 — Conference Board Consumer Confidence (private release).
All day — FOMC Meeting (Day-1) begins; Day-2 statement/PC tomorrow.
13:00 — U.S. Treasury auctions (notes/bills as scheduled).
FYI tomorrow (Wed): 10:30 — EIA Weekly Petroleum Status (on schedule).
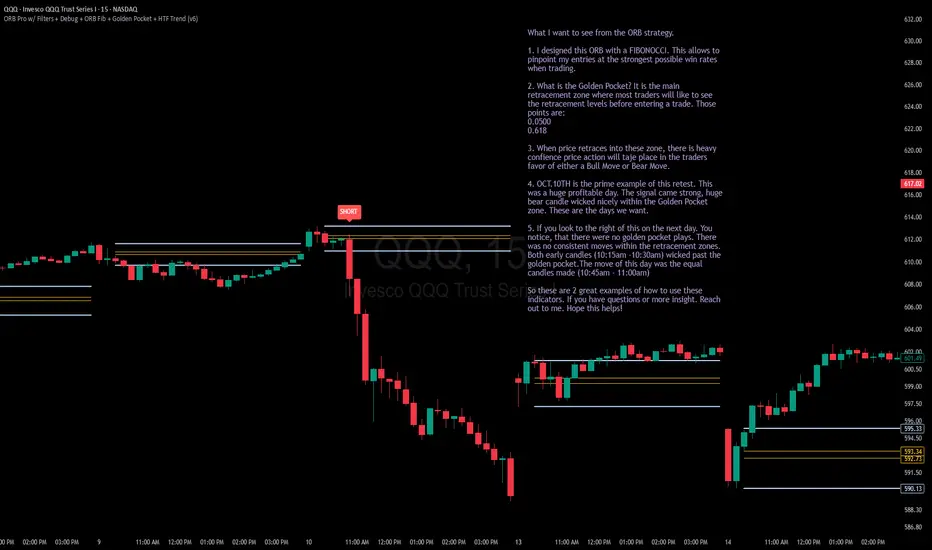
RECAP TODAY. USING THE SIGNALS AND TOOLS Fellow traders - followers,
I have some today to recap on the day.
Now I will say this. Today went the way they said it would go UP! All the overnight new, the morning media and the tech headlines all made today a profitable day for the bulls! I will also say this: it is a scary situation, because we have no resistance levels up here, so where does all this up trend movement stop? What do we know or where to put our stop losses?
In building these indicators, I'm learning a few things. I'm learning more about myself and about what to look for exactly. There will be days where I will lose. Just like Friday: -$280! The price action was just not as consistent and friendly like it was today.
Let me break down today:
1. I attached the 5min chart to show you what the " Golden Pocket " of my indicator resembles.
A confirmation of price action and direction.
It reacted perfectly. 10:15am Bear candle - 10:20am Bull Doji inside pocket - 10:30am Engulfing Bull candle with a long signal! You couldn't ask for a better set up to the upside to make your money!
2. The 15min time frame was a little more of a bulky solid read. Bull candles with wicks.
The 10:15am candle carried the long signal with it. The wick within that candle was our 5min candles playing out.
Weather you waited for the 15min plays or you entered in the 5mins. You won.
3. So, with all this, there is another indicator I play. That is my 0dte Context bundle. How this works in our favor is that in this specific situation you want to make sure your trends are moving where they need to go. The EMA, SMA and VWAP lines all had same up direction. The Green EMA/SMA Cloud all indicated up is where it's going.
You have the tools to assist in decisions. If you need more help with reading these indicators. Let me know. I'm always down to help out.
Patient is still key. Confirmations are still key. Remember that when trading. Do not get antsy and enter in trades that are not strong or that will not check all your entry boxes.
Thank you again for the follows and the support. I hope these are helpful.
God Bless,
Trades with B!

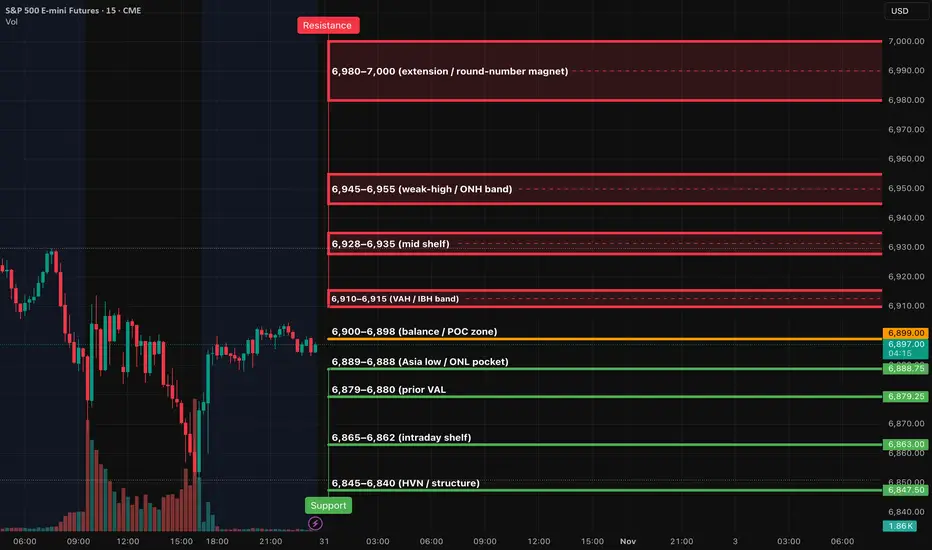
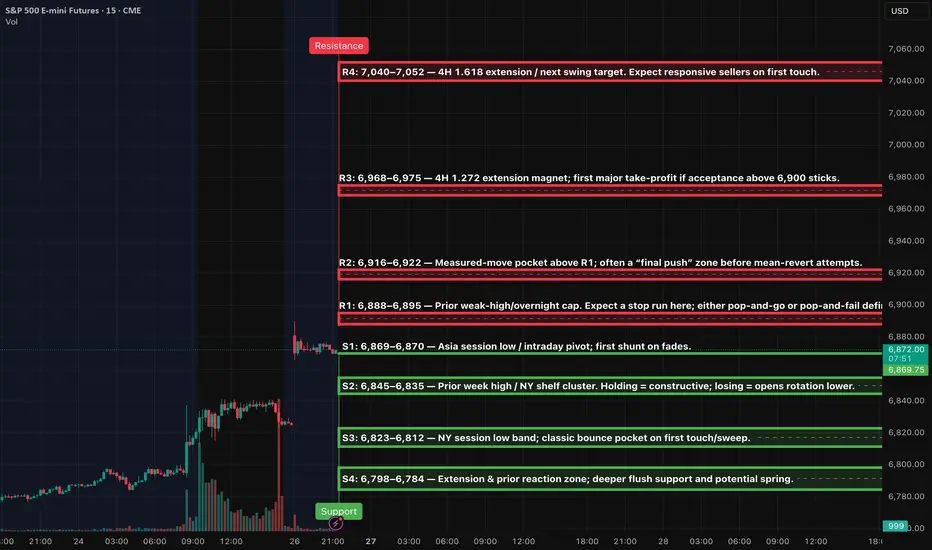
ES (SPX, SPY) - Week-Ahead Analysis, Levels Oct 27th - 31stBig picture (D/4H/1H )
Price is pressing a thin ceiling at 6,875–6,895. With ES at ATHs, the next upside extension targets sit at 6,968 → 7,044 → 7,128 on 4H. HTF trend is up, but intraday is stretched and vulnerable to a sweep-and-revert before any fresh leg.
Setups (Level-KZ Protocol 15/5/1)
1) Rejection Fade at R1 (Tier-1 A++):
Look for a sweep above 6,888–6,895, then a 15m close back inside the band → 5m re-close under ~6,885 → take the first 1m pullback that stalls below.
Entry: 6,886–6,892 on the retest from beneath
SL: above the sweep wick (15m anchor)
TP1: 6,845–6,835 (S2); TP2: 6,823–6,812 (S3); TP3: 6,798–6,784 (S4)
Viability check: TP1 ≥ ~2R vs 15m-wick SL. At TP1 close 70%, set 30% runner to BE; no trailing before TP2.
2) Acceptance Continuation above R1 (Tier-1 A++):
If 15m full-body closes ≥6,895, treat that as acceptance. 5m pullback holds 6,892–6,895 → buy the 1m HL.
Entry: 6,893–6,898 hold
SL: below 6,885 (15m wick anchor)
TP1: 6,968–6,975 (R3); TP2: 7,040–7,052 (R4)
Invalidation: 15m body back below 6,885.
3) Quick-Reclaim Bounce at S2 (Tier-2 A+):
Fast flush into 6,845–6,835, tag/sweep, then immediate 1m reclaim with a 5m re-close back above ~6,840.
Entry: on the reclaim/pullback that holds 6,838–6,842
SL: under 6,832 (15m wick)
TP1: 6,888–6,895 (R1); TP2: 6,916–6,922 (R2)
4) Exhaustion Flush Bounce at S4 (Tier-3 A):
If selling extends to 6,798–6,784 with momentum divergence/absorption, buy the first 1m reclaim that converts 6,792–6,796 into a floor.
SL: under 6,780 (15m wick)
TP1: 6,823–6,812 (S3); TP2: 6,845–6,835 (S2); optional TP3 6,888–6,895 (R1)
Week-ahead catalysts to watch (plan risk around these)
• Tue: Conference Board Consumer Confidence 10:00 ET.
• Wed (AMC): MSFT earnings.
• Thu 08:30 ET: US Q3 GDP (Advance); Thu (AMC): AAPL and AMZN earnings.
• Fri 08:30 ET: Personal Income & Outlays (incl. PCE); Fri 09:45 ET: Chicago PMI.
Expect headline-driven jolts around 08:30 ET Thu/Fri and at the big tech calls after the bell.
SPY and QQQ Macro outlook for 27 to 31 Oct 2025Macro map for 27 to 31 Oct 2025
Concentration of policy and inflation prints means policy expectations and real yields will drive the United States dollar, global equities, bitcoin, and gold. The hinge events are Wednesday FOMC, Thursday US GDP advance and German data, Friday US Core PCE and Chicago PMI. Secondary drivers are BoJ policy guidance and ECB tone, plus BoC.
Watch list
Real ten year yield and the DXY dollar index after FOMC and PCE
EUR front end versus USD front end after ECB and FOMC
VIX around the FOMC window and into PCE
US liquidity windows around 14:00 Eastern on Wednesday and 08:30 Eastern on Thursday and Friday
SPY and QQQ outlook for next week
Set up
US equities enter a policy and growth triad. Wednesday brings the FOMC decision and press conference. Thursday brings the first look at Q3 growth. Friday brings the price index that the Fed emphasizes. The path for real yields and the earnings tone are the first order drivers. Valuation sensitivity is higher in QQQ due to the weight of long duration cash flows. SPY has more cyclicals and defensives and therefore reacts more to growth beats or misses.
Baseline view
A patient Fed message combined with growth that is solid but not hot and inflation that continues to ease supports a grind higher. The market prefers falling real yields with inflation in check. A hawkish shift in the balance of risks, or a hot inflation print that lifts terminal pricing, pressures multiples and skews returns lower. If messages conflict, expect a whipsaw week with heavy rotation.
Scenarios and probabilities
Relief grind higher with QQQ leadership. Probability thirty eight. Triggers are a patient tone on Wednesday, a growth print that shows resilience without overheating, and Core PCE that validates disinflation. Breadth improves and volatility stays contained.
Air pocket lower. Probability thirty two. Triggers are a firmer Core PCE or a hawkish shift in the statement language that pushes real yields up. Valuation compression hits QQQ first and deepest. SPY holds better if staples and energy carry.
Two way chop with wide intraday bars. Probability thirty. Triggers are mixed messages across events and sectors. Expect quick moves around 14:00 Eastern on Wednesday and 08:30 Eastern on Thursday and Friday with mean reversion later in the day.
Key confirms
Watch the ten year real yield and the curve. A drop in real yields with stable breakevens favors a risk appetite day. A jump in real yields with a firm dollar and tight financial conditions favors de‑risking. Also watch VIX and the put call ratio into Wednesday afternoon to gauge dealer positioning.
Risk notes
Large cap earnings that land between FOMC and PCE can add idiosyncratic gaps. Respect prior week high and low as regime markers. If the market opens outside that range and fails to re enter on a retest, trend day odds increase.

S&P 500 (ES1!): Bullish! Wait For Valid Buy Setups!Welcome back to the Weekly Forex Forecast for the week of Oct. 27 - 31st.
In this video, we will analyze the following FX market: S&P 500 (ES1!)
The S&P500 closed last week at ATHs. I expect more of the same next week.
Look for valid dip buying opportunities, my friends.
If the market disrespects the +OB, then buys become invalidated.
Enjoy!
May profits be upon you.
Leave any questions or comments in the comment section.
I appreciate any feedback from my viewers!
Like and/or subscribe if you want more accurate analysis.
Thank you so much!
Disclaimer:
I do not provide personal investment advice and I am not a qualified licensed investment advisor.
All information found here, including any ideas, opinions, views, predictions, forecasts, commentaries, suggestions, expressed or implied herein, are for informational, entertainment or educational purposes only and should not be construed as personal investment advice. While the information provided is believed to be accurate, it may include errors or inaccuracies.
I will not and cannot be held liable for any actions you take as a result of anything you read here.
Conduct your own due diligence, or consult a licensed financial advisor or broker before making any and all investment decisions. Any investments, trades, speculations, or decisions made on the basis of any information found on this channel, expressed or implied herein, are committed at your own risk, financial or otherwise.

SPY: Bears Will Push
Looking at the chart of SPY right now we are seeing some interesting price action on the lower timeframes. Thus a local move down seems to be quite likely.
Disclosure: I am part of Trade Nation's Influencer program and receive a monthly fee for using their TradingView charts in my analysis.
❤️ Please, support our work with like & comment! ❤️

Stock Market Forecast | TSLA NVDA AAPL AMZN META MSFTStock Market Forecast | CME_MINI:NQ1! CME_MINI:ES1! SP:SPX NASDAQ:NDX
Mag 7 | TSLA NVDA AAPL AMZN META MSFT GOOGL

Some notes to reflect on. A little how to for the indicatorHey everyone,
Hope you guys & gals are doing well using these indicators. I'm publishing a chart that I wrote some notes for. Notes are offering some insight on what look for when using this indicator. If you have any questions, let me know. I am planning to get videos up soon when I get some extra free time.
Thank you again for the support!
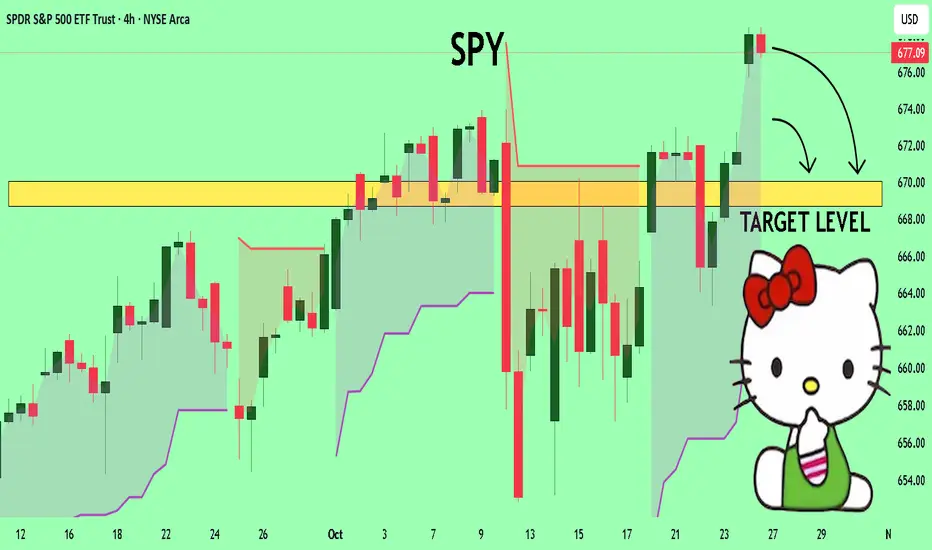
SPY The Target Is DOWN! SELL!
My dear friends,
SPY looks like it will make a good move, and here are the details:
The market is trading on 677.09 pivot level.
Bias - Bearish
Technical Indicators: Supper Trend generates a clear short signal while Pivot Point HL is currently determining the overall Bearish trend of the market.
Goal - 670.03
About Used Indicators:
Pivot points are a great way to identify areas of support and resistance, but they work best when combined with other kinds of technical analysis
Disclosure: I am part of Trade Nation's Influencer program and receive a monthly fee for using their TradingView charts in my analysis.
———————————
WISH YOU ALL LUCK