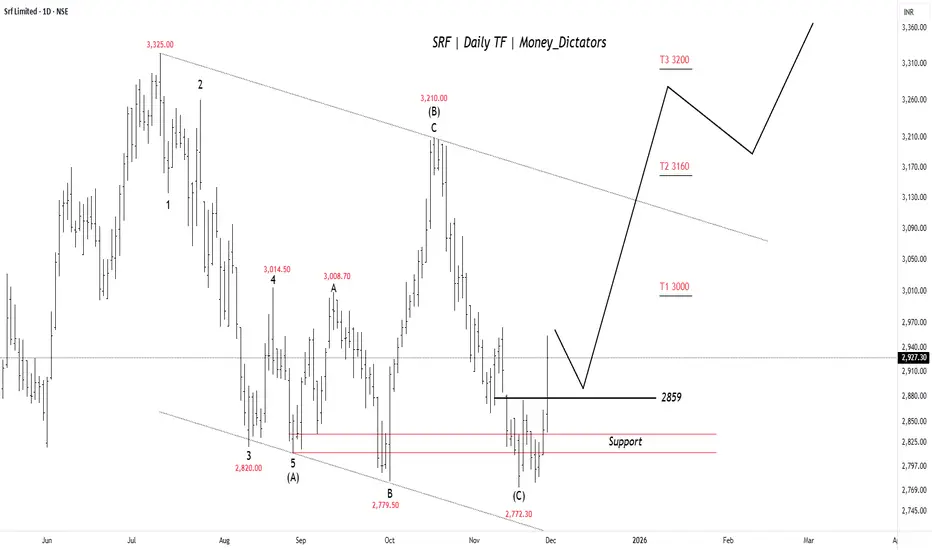
SRF on the Edge of a Sharp BreakoutSRF seems to have finished its ABC correction near the 2770–2800 support zone, and the price has bounced back above 2859 , which now acts as a short-term trigger. If the stock stays above this level, it can move toward 3000 first, then 3160 , and possibly 3200 . The chart shows buyers gradually taking control again after the correction, but the outlook stays positive only as long as price holds above the support region.
Stay Tuned!
@Money_Dictators
Srfanalysis
Bearish Rising Wedge on SRF LtdThe 1-hour chart for SRF Ltd (NSE) indicates a bearish rising wedge pattern. The price is moving within an upward sloping channel, suggesting a potential reversal to the downside.
Current Price: 2,351.45 INR
Resistance Level: 2,419.30 INR
Support Level: 2,292.30 INR
The pattern suggests a weakening bullish momentum. A break below the support level of 2,292.30 INR could trigger a bearish move.

SRF can Surf upwards after consolidation. SRF Ltd. engages in the manufacturing of chemical-based industrial intermediates. It operates through the following segments: Technical Textiles Business, Chemicals Business, Packaging Film Business etc. The Chemicals Business segment comprises of refrigerant gases, industrial chemicals, specialty chemicals, fluoro chemicals & allied products and its research and development.
SRF Ltd. CMP is 2529.15. The positive aspects of the company are Company with Low Debt, Company with Zero Promoter Pledge, MFs increased their shareholding last quarter and Book Value per share Improving for last 2 years. The Negative aspects of the company are High Valuation (P.E. = 61), De-growth in Revenue and Profit, Inefficient use of capital to generate profits and Inefficient use of shareholder funds.
Entry can be taken after closing above 2529 Targets in the stock will be 2579, 2656 and 2693. The long-term target in the stock will be 2756 and 2855. Stop loss in the stock should be maintained at Closing below 2427 or 2285 depending on your risk taking ability.
The above information is provided for educational purpose, analysis and paper trading only. Please don't treat this as a buy or sell recommendation for the stock. We do not guarantee any success in highly volatile market or otherwise. Stock market investment is subject to market risks which include global and regional risks. We will not be responsible for any Profit or loss that may occur due to any financial decision taken based on any data provided in this message.

Buy SRF 2412 avg @ 1880 sl below 1700 TGT 3720/4340/5650SRF is in consolidation after split and is showing indecision with good fundamentals . The stock can be followed with mentioned levels in the video as it has given brekout above the resitance channel

SRF LTD target 2637.70The company is second largest company in chemical sector in Bharat. It trades between a range of 2155 and 2637 and has completed the range 4 time in past 1 and a half years. It will again touch th same level of 2637.7 because of increasing profits and increasing CWIP.

SRFFlag and Pole Breakout, All key levels are mentioned in chart
Disclaimer
I am not sebi registered analyst
My studies are Educational purpose only
Please consult with your Financial advisor before trading or investing
