SSVUSDT UPDATE#SSV
UPDATE
SSV Technical Setup
Pattern: Falling Wedge Pattern
Current Price:
Target Price:
Target % Gain: 60.00%
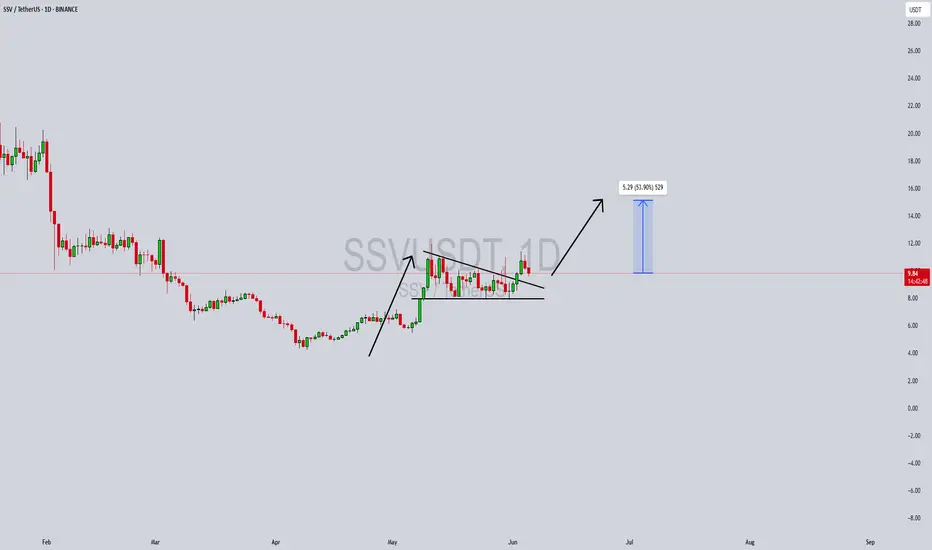
Technical Analysis: SSV is breaking out of a falling wedge pattern on the 1D chart, signaling a potential bullish reversal after a prolonged corrective phase. Price action is beginning to push above the descending resistance trendline, suggesting increasing buyer strength and a possible momentum shift. If the breakout is sustained, continuation toward higher resistance zones becomes likely as volume supports the move.
Time Frame: 1D
Risk Management Tip: Always use proper risk management.
SSV
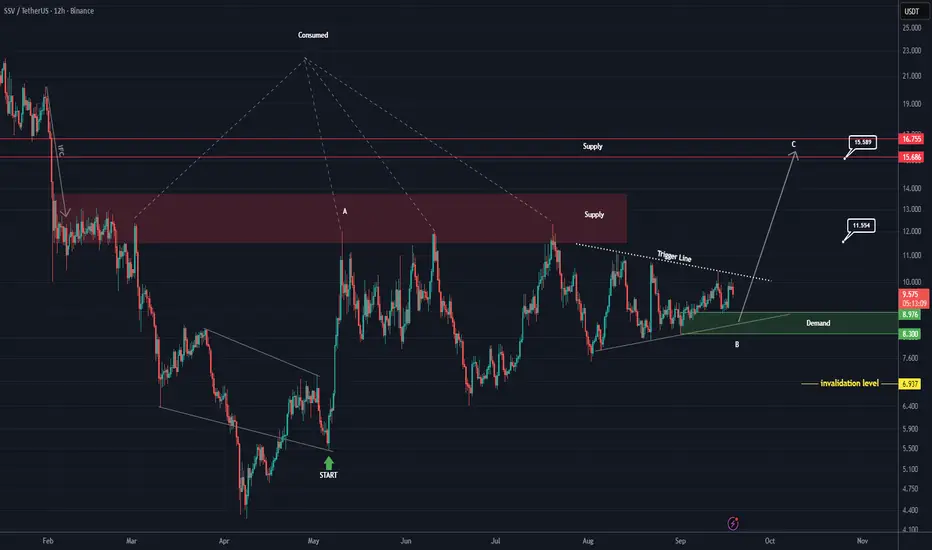
SSV Looks Bullish (12H)A supply zone has been highlighted on the chart. This supply has been consumed many times, yet no lower low has been formed. Also, from the point where we marked it on the chart, a bullish move started. After this bullish move, the price is currently forming a range. It seems that the initial move is wave A of the new pattern, and the ranging move is wave B.
As long as the green zone holds, the price can move toward the targets. Once the trigger line is broken, we will have further confirmations.
A daily candle closing below the invalidation level will invalidate this analysis.
For risk management, please don't forget stop loss and capital management
When we reach the first target, save some profit and then change the stop to entry
Comment if you have any questions
Thank You
SSV (SPOT)BINANCE:SSVUSDT
#SSV/ USDT
Entry range (8.60- 9.19)
SL 4H close below8.35
T1 11.90
T2 15.00
_______________________________________________________
Golden Advices.
********************
* collect the coin slowly in the entry range.
* Please calculate your losses before the entry.
* Do not enter any trade you find it not suitable for you.
* No FOMO - No Rush , it is a long journey.

SSVUSDT Forming a Bullish PennantSSVUSDT is currently forming a bullish pennant pattern, which is typically a continuation formation that appears after a strong upward impulse. The pair recently experienced a significant breakout to the upside, followed by a consolidation phase forming a symmetrical triangle or pennant structure. With good volume maintaining support and bulls defending key levels, this setup is signaling that a strong breakout could be imminent.
SSV Network (SSV) plays a vital role in the Ethereum ecosystem by enabling decentralized staking infrastructure. As Ethereum’s staking market continues to grow, projects like SSV are drawing significant interest from investors due to their utility and real-world staking applications. With more ETH validators looking for secure and decentralized staking solutions, SSV is well-positioned for organic growth in the coming months.
The technicals support the bullish bias, with the chart projecting a potential 40% to 50% gain once price breaks out from the current consolidation zone. The bullish momentum building over the last few weeks, combined with strong investor sentiment and healthy volume, adds confidence to this projection. The breakout target aligns with prior resistance zones, making this a high-conviction setup for swing traders.
This pattern, in conjunction with the underlying fundamental strength of the SSV protocol, presents a compelling opportunity for traders watching altcoins with real utility. A successful breakout could attract more retail and institutional attention, especially as staking continues to trend in the broader crypto narrative.
✅ Show your support by hitting the like button and
✅ Leaving a comment below! (What is You opinion about this Coin)
Your feedback and engagement keep me inspired to share more insightful market analysis with you!
Trading opportunity for SSVUSDTBased on technical factors there is a Sell position in :
📊 SSVUSDT
🔴 Sell Now
🪫Stop loss 8.37
🔋Target 6.85
📏 R/R 2
💸RISK : 1%
We hope it is profitable for you ❤️
Please support our activity with your likes👍 and comments📝

Trading opportunity for SSVUSDTBased on technical factors there is a Buy position in :
📊 SSVUSDT
🔵 Buy Now
🪫Stop loss 11.90
🔋Target 15.10
📏 R/R 1,6
💸RISK : 1%
We hope it is profitable for you ❤️
Please support our activity with your likes👍 and comments📝

Trading opportunity for SSVUSDTBased on technical factors there is a Buy position in :
📊 SSVUSDT
🔵 Buy Now
🪫Stop loss 21.50
🔋Target 26.70
📏 R/R 1.2
💸RISK : 1%
We hope it is profitable for you ❤️
Please support our activity with your likes👍 and comments📝

SSVUSDT Nears Channel Breakout: Bullish Move Ahead!SSVUSDT Technical analysis update
SSVUSDT has been trading within a channel for the past 115 days. The price is now moving toward the channel's resistance, signaling a potential breakout. Currently, the price is trading above the 100 EMA on the daily chart, with high volume observed in recent days. Once the channel breakout is confirmed, a strong bullish move can be expected in SSV.

SSV target 354h time frame
-
Entry: $21
TP: $35.37
SL: $16.6
RR: 3.27
-
(1) Slowly climbing with the uptrend
(2) Got support twice at fib projection 0.382, also made a SL hunting ($19.82)
(3) Target for fib projection is $35.37, overlap with structural resistance
(4) Stop loss once going below $16.6

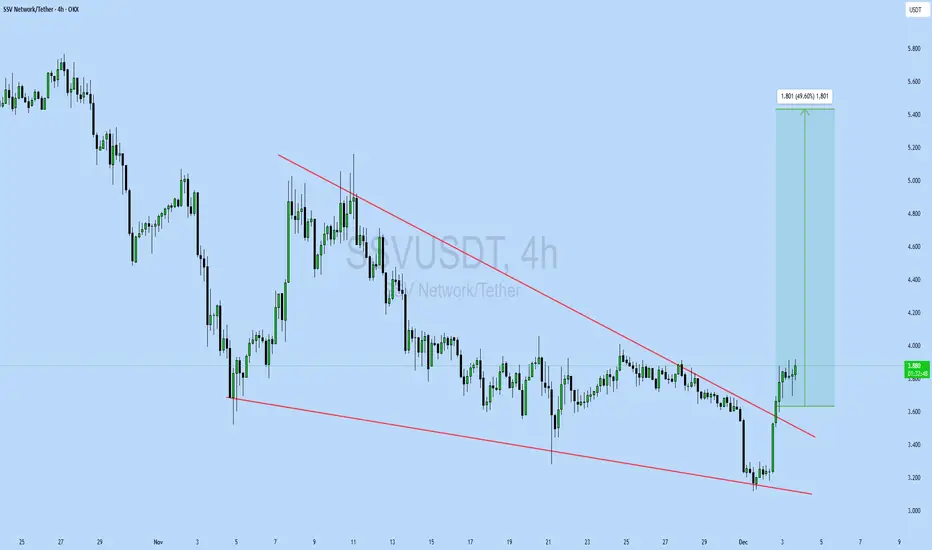
SSV looks bullish (4H)It looks like we had a big ABC (zigzag) now that wave C which had 5 waves is over.
SSV can move towards the specified targets on the chart while maintaining the green range.
Closing a daily candle below the invalidation level will violate the analysis.
For risk management, please don't forget stop loss and capital management
When we reach the first target, save some profit and then change the stop to entry
Comment if you have any questions
Thank You

SSV target 26.54h time frame
-
Entry: $19.05
TP: $26.5
SL: $16.6
RR: 3.04
-
(1) Potential double bottom, expected time to reach $19.05 is Sep/E
(2) Maintain uptrend since $16.71
(3) Supports are overlapped from uptrend line and Fib retracement 0.382
(4) Need to break out the long-term downtrend since $66
(5) Stop loss once going below $16.6

Potential for the price to riseThe $37.5 to $36 support range for SSV is noteworthy for monitoring as it may indicate significant market changes. If market conditions align, there is potential for the price to rise to the $40 and $42 resistance ranges.

SSVUSDT Corrective Wave 4 CompletedOn the daily timeframe SSV is showing that the corrective wave 4 is likely to be completely. The price has found strong support at 88.6% Fibonacci level, which has been respected multiple times.
Overall, I'd expect at least 1 more wave to the upside, completing the 5-Wave upside move. If/when our upside target will be reached, a 107% profit will be fixed!
Not to mention a superb 1:12 risk/reward setup.
Hope you enjoy it!

Drop and breakout scenarioThe overall trend is ranging with significant fluctuations. There is a descending trendline that buyers are trying hard to break out of.
The scenario involves a potential drop to gain more strength and then move towards breaking the trendline. If it breaks and completes a pullback, it could see significant upward movement. Keep an eye on it.

SSV looks bearishFrom where we placed the red arrow on the chart, it looks like the bullish SSV wave has ended and is now entering a correction phase.
The correction pattern looks like a diametric as we are now in the middle of wave E.
We will look for sell/short positions in the red box.
The targets are marked on the chart.
Closing a daily candle above the invalidation level will violate the analysis.
For risk management, please don't forget stop loss and capital management
When we reach the first target, save some profit and then change the stop to entry
Comment if you have any questions
Thank You

SSV MARKET ANALYSISSSV has broken long term descending triangle with good volume and is expected to move up from current price. If price slightly plummets then it will be good buying opportunity.
Buy Range 44-48
Stop 42
target 52, 56, 60, 64

SSV target 69 in perp4h time frame
-
SSV is retesting the robust uptrend line with a precipitous drop from $55. Usually need more consolidation or accumulation to reverse after a quick dip like this. However, SSV has been increasing on this upward slope since $11, that makes this uptrend pivotal, so the timing is an entry for left-hand side traders to gain perfect risk to reward ratio. Moreover, next entry will be around $25~$28 once current plan got liquidated, and you can have more detail about 1st amd 2nd entry on chart from my previous analysis of SSV spot.
-
TP: $69
SL: $32

SSV/BTC - SSV Network: Super Trend◳◱ On the $SSV/ CRYPTOCAP:BTC chart, the Super Trend pattern suggests a pause in volatility, potentially gearing up for a breakout. Traders might observe resistance around 0.0006587 | 0.0006934 | 0.0007804 and support near 0.0005717 | 0.0005194 | 0.0004324. Entering trades at 0.00083 could be strategic, aiming for the next resistance level.
◰◲ General info :
▣ Name: SSV Network
▣ Rank: 156
▣ Exchanges: Binance, Gateio
▣ Category/Sector: N/A
▣ Overview: SSV Network (presently on testnet) is a Distributed Validator Technology (DVT) project for Ethereum validators under development by Blox with grant funding distributed to supporting teams from the SSV treasury. Stakers either create or supply an existing validator private key that is then split into key shares. Next, the key shares are encrypted with the public keys of SSV Network operators and published to the SSV smart contract. Using the smart contract as a data availability layer, operators can download and decrypt key shares, and a user can reassign its key shares to different network operators.
The network is comprised of a custom built validator client that holds and signs with the key shares it decrypts from the SSV smart contract. In the future, the team intends to move the key shares into a connected remote signer after decryption.
◰◲ Technical Metrics :
▣ Mrkt Price: 0.00083 ₿
▣ 24HVol: 19.965 ₿
▣ 24H Chng: 15.006%
▣ 7-Days Chng: 30.36%
▣ 1-Month Chng: -9.76%
▣ 3-Months Chng: 66.10%
◲◰ Pivot Points - Levels :
◥ Resistance: 0.0006587 | 0.0006934 | 0.0007804
◢ Support: 0.0005717 | 0.0005194 | 0.0004324
◱◳ Indicators recommendation :
▣ Oscillators: SELL
▣ Moving Averages: STRONG_BUY
◰◲ Technical Indicators Summary : BUY
◲◰ Sharpe Ratios :
▣ Last 30D: -1.02
▣ Last 90D: 2.05
▣ Last 1-Y: 1.05
▣ Last 3-Y: 1.65
◲◰ Volatility :
▣ Last 30D: 1.33
▣ Last 90D: 1.28
▣ Last 1-Y: 1.06
▣ Last 3-Y: 1.27
◳◰ Market Sentiment Index :
▣ News sentiment score is N/A
▣ Twitter sentiment score is 0.60 - Bullish
▣ Reddit sentiment score is 0.72 - Bullish
▣ In-depth SSVBTC technical analysis on Tradingview TA page
▣ What do you think of this analysis? Share your insights and let's discuss in the comments below. Your like, follow and support would be greatly appreciated!
◲ Disclaimer
Please note that the information and publications provided are for informational purposes only and should not be construed as financial, investment, trading, or any other type of advice or recommendation. We encourage you to conduct your own research and consult with a qualified professional before making any financial decisions. The use of the information provided is solely at your own risk.
▣ Welcome to the home of charting big: TradingView
Benefit from a ton of financial analysis features, instruments and data. Have a look around, and if you do choose to go with an upgraded plan, you'll get up to $30.
Discover it here - affiliate link -

SSV ANALYSIS (12H)SSV seems to have formed a large and bullish symmetrical which is now in wave i of this symmetrical.
By maintaining the green range, it can move towards the two specified targets.
The targets are clear on the chart.
Closing a daily candle below the invalidation level will violate the analysis
For risk management, please don't forget stop loss and capital management
When we reach the first target, save some profit and then change the stop to entry
Comment if you have any questions
Thank You

Alikze »» SSV | Corrective wave 4 scenarioIn the daily and weekly time, it has been moving in a medium-term ascending channel, which has encountered a corrective structure after meeting the daily resistance.
💎 According to the type of correction behavior and structure that can be seen in the daily chart, a three-wave correction has been done up to the specified area.
💎 In the first scenario, according to the correction structure, we should probably witness another correction wave, which can be flat until the green box area or until 61.8 fibo of this continuous correction.
💎 The second scenario: But if this modification touches the neck line or the Invalidation LVL area, the second scenario can replace it.
If the behavior and structure of the post changes, it will be updated.
»»»«««»»»«««»»»«««
Please support this idea with a LIKE and COMMENT if you find it useful and Click "Follow" on our profile if you'd like these trade ideas delivered straight to your email in the future.
Thanks for your continued support.
Sincerely.❤️
»»»«««»»»«««»»»«««

SSV/USDT its possible back testing before break the pattern!💎 Paradisers, the recent market dynamics surrounding #SSV have been noteworthy.
💎Currently, SSV is grappling with the descending resistance area, awaiting a daily candle close above this pattern to confirm a successful breakout. However, if SSV fails to achieve this, there's potential for a retest of the support zone between $41 and $38.
💎 In the support area, there's a possibility of price bouncing and attempting another breakout above the descending resistance.
💎 Adding to the bullish sentiment, the MACD indicator has displayed a golden cross, signaling a potential bullish reversal. If this momentum persists, SSV could break out of the pattern and continue its upward trajectory toward our target resistance area.
💎 Conversely, if SSV fails to bounce off the support area and instead breaks below it, there's a chance of revisiting the demand area around $28 to establish new momentum. Historically, SSV has shown resilience by bouncing from this zone.
💎 The bullish scenario would be invalidated if SSV fails to bounce from the demand area and closes a candle below it. In such a scenario, the price could confirm a continuation of bearish movement, possibly leading to further downward movement.
MyCryptoParadise
iFeel the success🌴

SSV target $2504h time frame
-
SSV has been going on an uptrend since Oct 23', this climbing way is very healthy, accompanying with high volume as every pump. Also, SSV made a stop hunting to liquidate leverage on bull side. However, SSV did create a top structure after hitting $63.85, and there is a target at $24 if SSV continues to correct based on the Fibonacci projection. $24 is definitely a sweet level to buy because not only hit 200% fib, but also go into the first support zone. I also provide the 2nd sweet zone to accumulate more spot if SSV keeps correction. When it comes to bull target, we need to know that SSV is the potential leader in DVT sector, which could push its mc up to 20 billion or even higher, so I predict SSV would reach $250 at least in bull market.
-
Bull target: $250~$280

ssvIt is in a resistance zone
If we have good market conditions and money strength, we enter at the green point and continue until the red or blue targets
