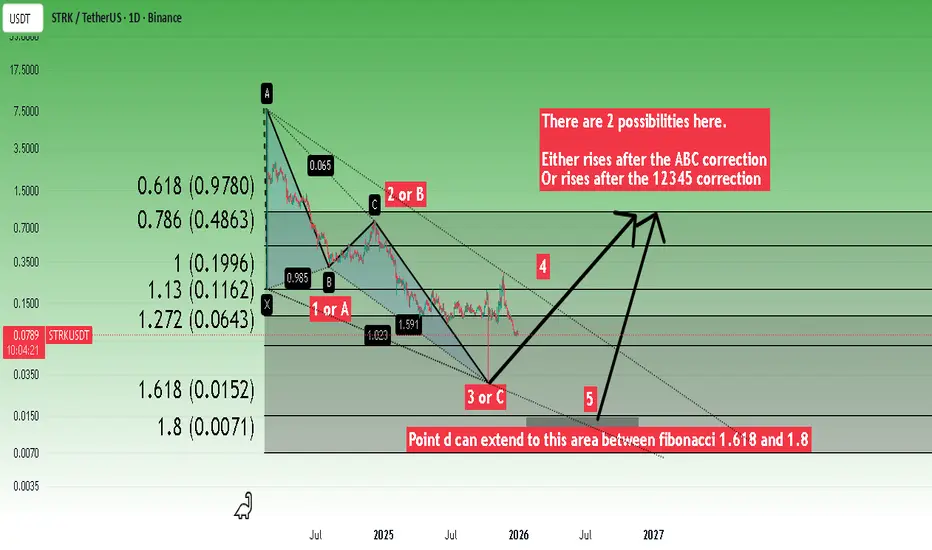
Bullish Harmonic Deep Crab PatternOne of the projects whose technology I like.
I tried to draw two possible scenarios for educational purposes.
* The purpose of my graphic drawings is purely educational.
* What i write here is not an investment advice. Please do your own research before investing in any asset.
* Never take my personal opinions as investment advice, you may lose your money.
Starknet
STRK Price Analysis: What Comes Next After a 70% Drop?* STRK has erased nearly all of its recent rally after a sharp 70% monthly drawdown.
* The STRK charts show early stabilization near support, but the broader downtrend remains intact.
* On-chain data hints at slowing sell pressure, though conviction from buyers is still limited.
When you zoom out and look at Starknet’s recent price action, it’s clear the market isn’t in full panic anymore, even after such a brutal selloff.
The STRK price didn’t just drift lower; it dropped nearly 70% in a short span. But what’s happened since feels more like the market catching its breath than continuing to unravel.
Lately, the STRK price has been hovering around the $0.085–$0.09 zone, an area that lines up with earlier consolidation before the last rally.
After slicing through multiple support levels during the unwind, this is the first spot where selling pressure has noticeably slowed. Dips into this range are getting absorbed faster, suggesting sellers are losing urgency even if buyers aren’t stepping in aggressively yet.
On-chain data helps put that into context. While STRK’s market cap clearly fell during the selloff, the pace of capital leaving the ecosystem has eased. Money isn’t rushing out the door anymore, which often signals a shift from outright distribution to a digestion phase.
Network activity supports that view. Active addresses and transaction counts dropped during the worst of the selloff but have since started to stabilize. They aren’t surging, but they’re also not collapsing, which usually means users are sticking around while price works through a reset rather than abandoning the network.
The biggest obstacle remains overhead. On lower time frames, the STRK price is still capped by a descending trendline that has rejected every bounce since the breakdown. Each recovery attempt has stalled quickly, showing buyers are cautious and conviction remains limited.
What’s next for Starknet?
If STRK can hold the $0.085–$0.09 base and eventually reclaim that trendline, the chart would start to look healthier. A move back toward the $0.11–$0.12 area would feel like real progress, not just another reflex bounce.
If that doesn’t happen, the downside is easier to map. A clean break below support would put lower levels back into focus, especially if broader market sentiment turns risk-off again. CoinCodex’s one-month STRK price target near $0.06451 reflects that risk.
For now, STRK is firmly in wait-and-see mode. The damage has already been done, but the chart still needs proof that selling is truly finished.
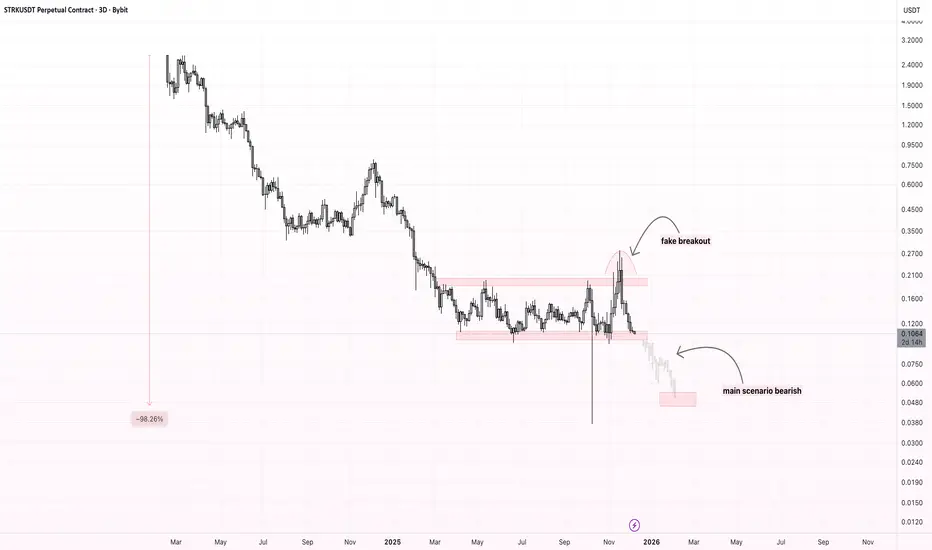
STRK – Horizontal Accumulation, Fake Breakout & Bearish OutlookPrice has spent a long time moving inside a horizontal accumulation range. Recently, the market attempted a breakout to the upside, but the move failed and quickly returned back inside the range — a classic fake breakout / deviation above resistance.
The failed breakout shifts the market structure toward weakness. As long as price stays below the upper boundary of the range, the main scenario remains bearish.
I expect continuation to the downside, with the next liquidity zones and potential targets located in the $0.055–$0.045 area.
A reclaim of the range high would invalidate the idea, but for now momentum favors sellers.
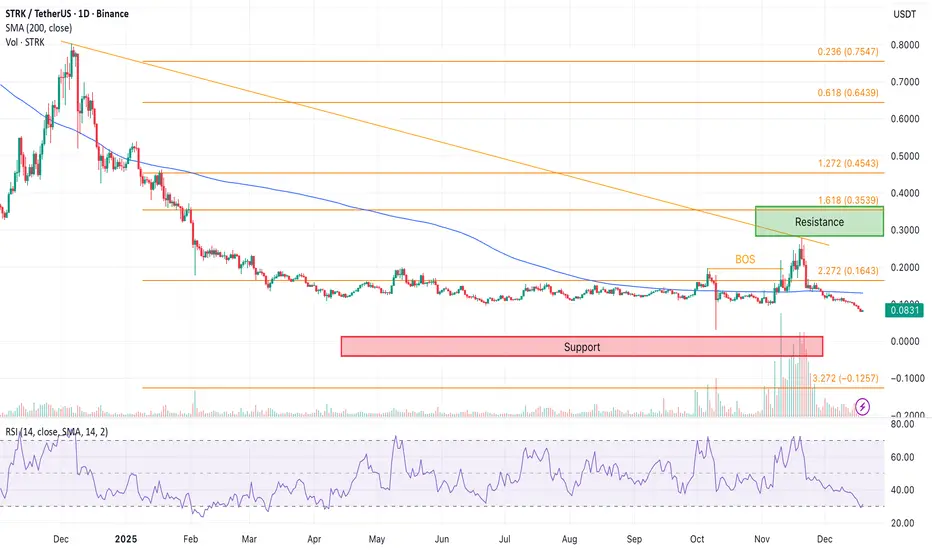
$STRK price — Testing the end of a long-term downtrendAfter months of pressure since early 2024, #STRK is attempting a breakout.
The next two daily candle closes for OKX:STRKUSDT will be crucial for confirming direction.
Above $0.17 — potential confirmation of reversal and continuation higher.
Below $0.17 — likely a stop-loss hunt before retesting support near $0.07.
The market structure still looks fragile, so confirmation is key before entering long positions.
💭 Could this finally be the turning point for #Starknet , or another trap for hopeful buyers?
______________
◆ Follow us ❤️ for daily crypto insights & updates!
🚀 Don’t miss out on important market mov es
🧠 DYOR | This is not financial advice, just thinking out loud.

STARKNET went to zero (relatively speaking) But eyes $110/10 Was a Harrowing experience for many altcoin enthusiasts.
Which many are still dealing with the aftermath of psychologically and financially.
Those have been some of the best conditions that bring about the best returns in altcoins going forward.
When they have been beaten down to virtually zero
and when there is no one left to sell and only the strongest of hands remain.
Starknet is a good example of a coin that has reclaimed back all that damaging price action and is on the verge of a breakout.
There are many other #ALTS you could pick that have similar charts #DYOR
Starknet is just an example not saying this will be a fast horse or even remotely closest to being one of the fastest horses.
But the chart piqued my interest.
Share anything that peaks yours in the comments...
And I will be sure to have a look at it for you.
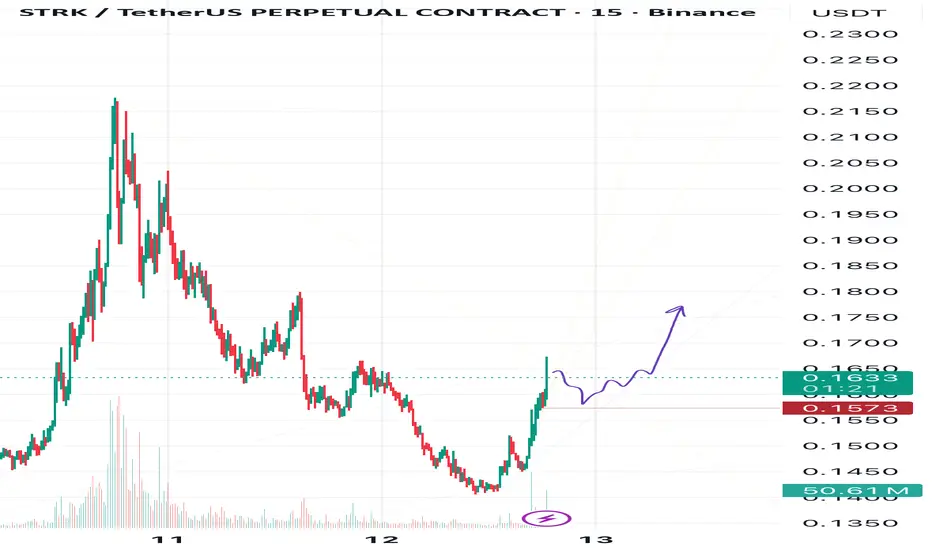
STRKUSDT.P - November 15, 2025STRKUSDT.P is consolidating below a key 0.1840–0.1860 resistance zone, with price showing hesitation and potential for either a breakout toward the 0.1980 profit level or a breakdown toward the 0.1388 support zone.
A decisive close above 0.1860 would confirm bullish continuation, while failure to hold the 0.1650 support trigger could open a sharper move toward 0.1400.
Risk Assessment: Moderate — Structure shows balanced risk with clear breakout and breakdown triggers; traders may consider adjusting stops near 0.1760 once price tests the upper resistance to reduce exposure.

STRK About to Spark🧨STRK looks like it’s getting ready to take off.
🐂If the bullish pressure continues, we could see a strong move to the upside.
However, as always, I’ll stay cautious and watch how the price reacts near key resistance zones.
Targets:
🎯1 0.17,
🎯2— 0.176,
🎯3 — 0.182,
🚀and my global target remains at 0.20.
❌The invalidation zone for this plan is set at 0.1573.
⚠️This is not financial advice — just my personal view on the chart.
Trade safe, manage your risk, and stay tuned for what’s next! 🚀
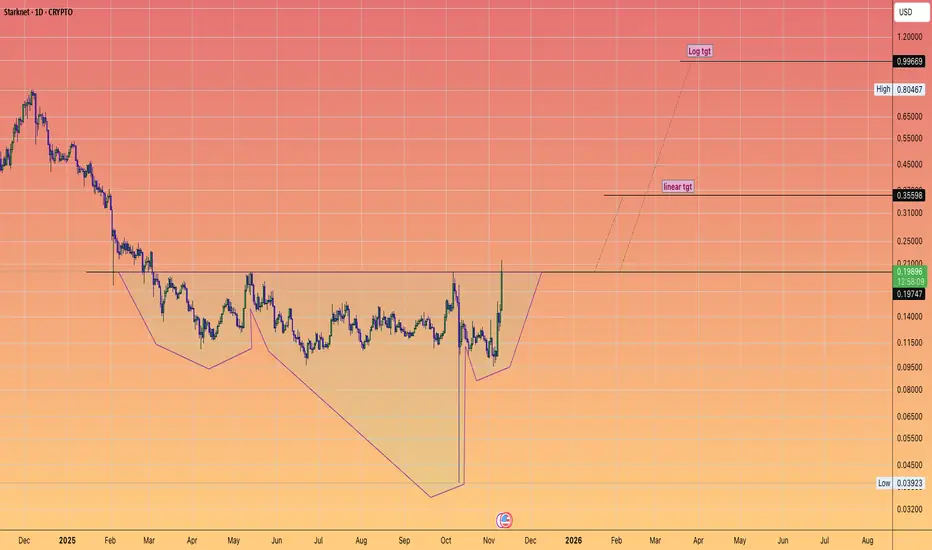
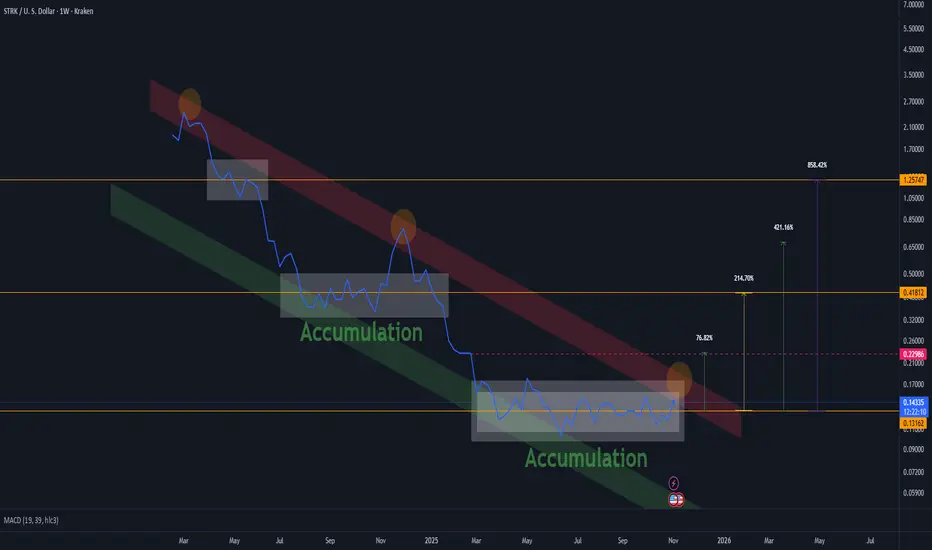
STRK STARKNET - 1W CHARTThere isn’t much to explain here — accumulation → pump → distribution.
Once the descending channel is broken and price moves above it, the potential targets are shown on the chart.
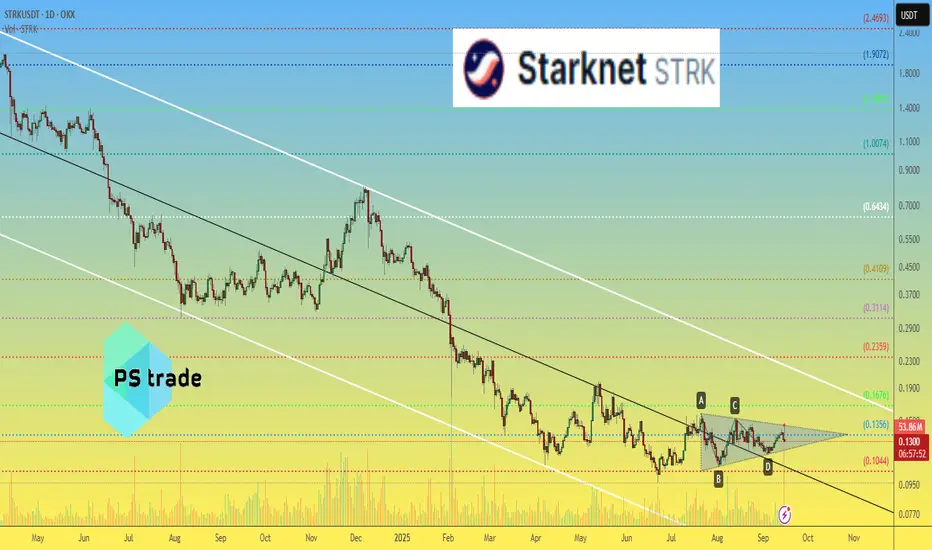
StarkNet STRK price analysisWe have to admit, the “disappointment” price of #STRK is now stuck in consolidation — but this looks like it’s heating up for a breakout 📈
Today we even saw an attempt to push higher, but it got stopped right at the upper edge of the triangle ⛔️
Let’s make it interactive: looking at this chart, what’s your scenario for OKX:STRKUSDT 👇
▫️ Drop to $0.10 ?
▫️ Pump to $0.20 ?
▫️ Or maybe even $0.40–0.50 ?
🔥 If we see good engagement around #Starknet, we’ll share our own forecast for the move of this asset… which we don’t even care about that much 😅
❓ So, which direction do you personally expect for #STRK? Comment below 👇
______________
◆ Follow us ❤️ for daily crypto insights & updates!
🚀 Don’t miss out on important market moves
🧠 DYOR | This is not financial advice, just thinking out loud.
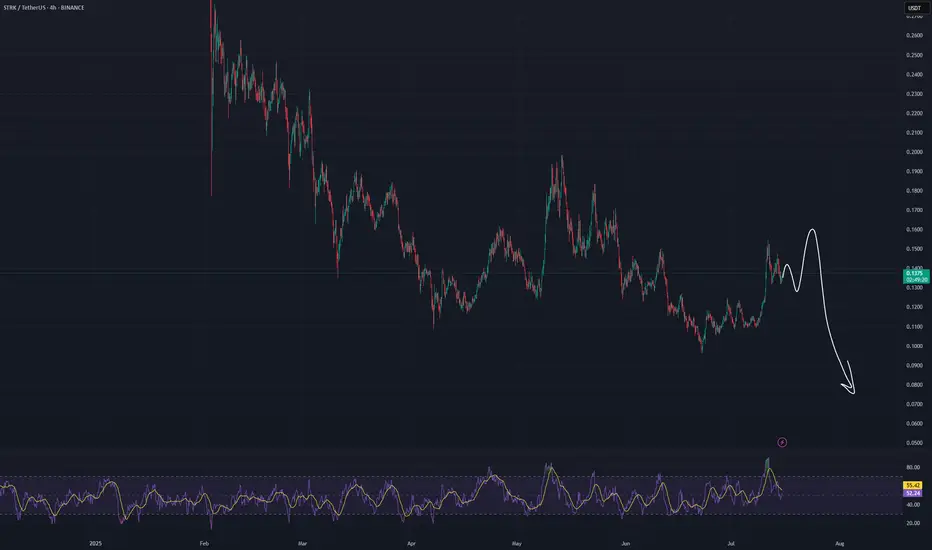
#STRK/USDT - SHORTI expect a decrease in the asset within a month.
(Not an investment recommendation).
Is Starknet STRK Really Scam? Hello, Skyrexians!
I want to make an update on BINANCE:STRKUSDT because price dropped that much recently and now everyone is telling that this coin is total scam. To be honest I have some doubts that this crypto can bring significant gains in this cycle, but solid bounce can be seen.
Here we have 4 days time frame to estimate the Elliott waves cycle correctly. We can see all 5 waves, divergence with the Awesome Oscillator, but I have the huge concern - it was the downward global impulse. What does it mean? It means that the next wave will be corrective. 0.61 Fibonacci is the max target at $1.7. This is more than 10x. I cannot believe that this coin can set ATH because I totally disappointed in it. My last purchase wave at $0.13 and average price $0.41. Now this is the worst my investment in this cycle.
Best regards,
Ivan Skyrexio
___________________________________________________________
Please, boost this article and subscribe our page if you like analysis!

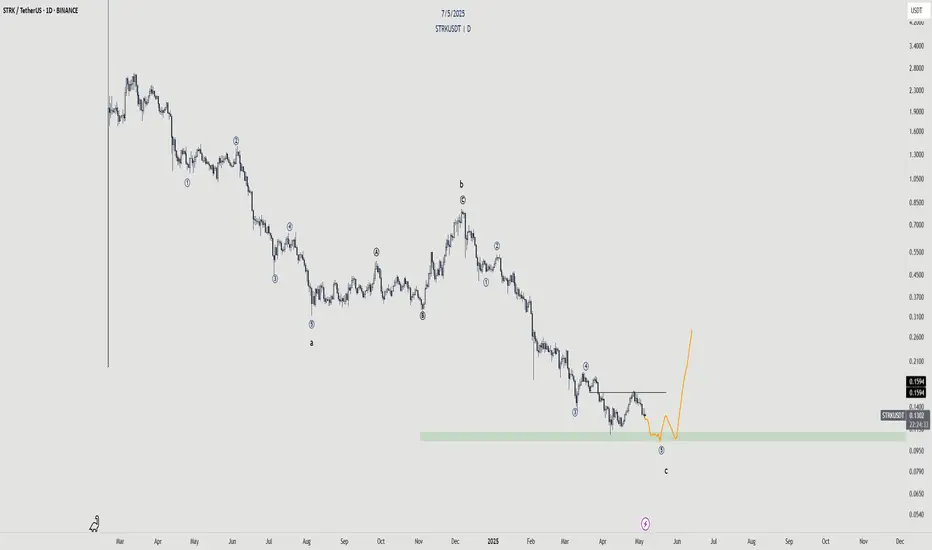
Starknet - Incoming Reversal?Starknet has been on a consistent downtrend. Its about time we finish this wave structure where we will see an impulse finish of Wave c.
Looking for the 5th wave to finish to sweep the low. However, the pullback seems very deep in that micro structure so its also likely we don't get that sweep. As long as we close below that wick from the green box and we can consider 5th wave to be done.
Skyrexio | Starknet STRK Is Inside The Dead Zone AgainHello, Skyrexians!
Today we want to update our old analysis on $BINANCE:STRKUSDT. Unfortunately we were wrong about its potential growth and this crypto dived inside the dead zone again. For sure, it makes holders nervous. I (Ivan) personally have Starknet in my portfolio for 6% of deposit. This is the worst performed asset in my portfolio in this cycle. My entry point at $0.75 and it's painful now to see the price $0.38. I have not bad entry point, there are a lot of people who bought it above $1 or even $2. That's why it's important to understand is it worth to hold STRK? Any chance to revive from dead zone or not?
Let's take a look at the 3D time frame. We can see two green dots on Bullish/Bearish Reversal Bar Indicator next to the bottom. Current dot still has not been confirmed, be careful!
The fact that current signal is about to happen at the potential wave's 5 bottom gives us some confidence that reversal to the upside can come this time.
Best regards,
Skyrexio Team
___________________________________________________________
Please, boost this article and subscribe our page if you like analysis!

Starknet STRK price analysisThe #STRK price is approaching the critical point of $0.40
From there, it will either start to grow to at least $1.1 or to update the lows.
#Starknet has been very generous with airdrops, just like #ARB before, and a lot of “Homunculus loxodontus” are sitting and waiting for manna from heaven when their “free” coins turn into millions)
⁉️ And there are not many people who want to pump up OKX:STRKUSDT price...
So, given our unbiased position, since we don't have these coins in our portfolio, we'll make our choice now: “watching” rather than ‘buy’.
_____________________
Did you like our analysis? Leave a comment, like, and follow to get more

Stark , A cool layer 2Stark is interesting, my first L2 to bring on chart this cycle , tech is good and l’m in love with ZK technology so not gonna talk about it a lot and the research is on your shoulders, Vitalik loves it as well and according to him zk is the end game .
As i expect Ethereum start its upward move soon it would be wise to put some L2 in my basket , start with strk and will decide if i add another later.
Stay safe fam

#STRK 1D. Risky Trade Setup with High Targets! 11/25/24We’ve broken out of the range with a strong upward impulse—exactly as forecasted. What’s next? Either a minor pullback to support or a continuation upward from current levels. To put it plainly and concisely: the nearest target, which we will 100% reach, is $0.6582.
Will we see #STRK hit $1 this cycle? Absolutely, yes. That’s my call, and I’m saying it right now. Lock this in your mind, and in time, we’ll check if my expectations were correct. Could we see #STRK at $0.8767 as early as next month? It’s entirely possible.
Key factors supporting this move: we’re closing the week bullish, with solid volumes, and above the upper boundary of the range. Ideal setup, in my view!
This is worth a shot, though it’s high-risk. Check the stop.
Setup:
Entry: $0.5800 - $0.5400
Targets: $0.6513, $0.8759, $1.1000, $1.3597
Stop-Loss: $0.3928
On spot: no stops.
DYOR.

Starknet STRK Is Escaping The Dead Zone!Hello, Skyrexians!
Today we are going to introduce for you the analysis of the most hated altcoin of 2024. We are talking about BINANCE:STRKUSDT . You have many reasons to not like this crypto because since it's listing it's is only going down, showed almost the biggest drawdown of all crypto market. Several months ago Starknet has reached the dead zone and we told in this article that it will finally go up. We made a mistake with timing, but it looks like we finally were right with the potential price move.
Let's take a look at the 2 days time frame. We can count listing pump as the wave 1 after that price is forming wave 2 in shape of zigzag ABC. We marked only subwaves inside wave C inside wave 2 to not overwhelm the chart. Awesome Oscillator shows the minimum value in wave 3. After that it crossed zero line and pulled back below zero again but formed the bullish divergence between wave 3 and 5. You can tell, that wave 5 is shorter than wave 3, but it can be the case. We can see the wave 5 finish on the AO.
Also want you to pay attention on our new indicator Fractal Trend Detector which demonstrated the strong bear market with the red zones, acted as a resistance in wave 2 and 4. As always, alerts from this indicator are automatically replicated on my accounts. You can find the information in our article on TradingView . Recently this indicator turned green indicating the start of the uptrend. The invalidation price now is located at $0.43.
As a result, STRK has a great chance to escape this dead zone and reach unbelievable targets. If wave 2 has been really finished, currently price is printing wave 3. It means that there is a high probability of reaching the Fibonacci 1.61 and 2.61 targets at $12 and $20.
Best regards,
Skyrexio Team
___________________________________________________________
Please, boost this article and subscribe our page if you like analysis!

STRKUSDT - Targeting a 200% Gain PotentialSTRK/USDT has been in a prolonged downtrend, but the recent price action shows early signs of potential accumulation. We’re now at a level where buyers may start stepping in, creating a base for a possible reversal. This setup suggests that STRK could be positioning itself for a significant upward move.
Why This Trade?
Historical Support: After a lengthy decline, the price has found a potential support zone where selling pressure has lessened, hinting at an accumulation phase.
Volume Dynamics: Volume spikes during recent consolidations suggest interest from buyers at this level, which could lead to a breakout if the trend shifts.
Risk-to-Reward: With a clearly defined entry point and manageable stop level, this setup offers a high reward-to-risk ratio, targeting a possible 200% gain on a bullish continuation.
As always, patience and discipline are key. The market may take time to unfold, but if the reversal is confirmed, this could be an excellent opportunity to ride the trend.
dYOR
Hedonist

STRK. Speculative investment. $0.38 ---> $3+They dump the price at the beginning to handle sell pressure. In the green zone (low), the strategic market makers will buy again and use cheap tokens + small selling pressure for a global pump.
I don’t know where to sell, because markets are not static, team plans are not static, nothing is static. But I believe that $3+ is the minimal target in a successful case.
This theory works only if you researched & found a special format of token unlocks after the project launch (not team & core unlocks).
~$3 means ~$10 billion market cap on the highest price at that moment.

STRKUSDT Price Making Higher HighsSTRKUSDT technical analysis update
STRK's price is making higher highs and has formed an ascending channel on the 4H chart. The price has broken the ascending channel's resistance line with high volume. We can expect a small retest before the price continues upward.
STRK price potential to reach $1.00 in few weeks.

STARKNET long setup - BINANCE:STRKUSDT
COINBASE:STRKUSD
Hello Traders
💥Long position on STARKNET
SL1 ---> Low-risk status: 3x-4x Leverage
SL2 ---> Mid-risk status: 5x-8x Leverage
👾The setup is active but expect the uncertain phase as well.
➡️Entry Area:
Yellow zone
⚡️TP:
0.402
0.405
0.410
0.413
0.419
🔴SL:
0.382
🧐The Alternate scenario:
If the price stabilizes below the trigger zone, the setup will be cancelled.

Starknet STRK price and upcoming unlock coinsOn 15/09, $64 million of STRK will be distributed, which is +3.6% of the coins in circulation.
Given that the price of OKX:STRKUSDT is currently hovering near its lows, and we are waiting for positive macroeconomic decisions ahead, it is unlikely that these coins will be sold on the market now.
Targets for the #Starknet price look more attractive:
- medium-term - $0.60
- long-term - $1.20-1.30
_____________________
Did you like our analysis? Leave a comment, like, and follow to get more

Has #Starknet started an uptrend?IDX:STRK 1D chart;
#Starknet, which started a downtrend with the level it lost on April 12, will give the second major signal for an uptrend if it can close today above the $0.43 level.
It gave its first signal with the positive mismatch it showed on the RSI side in the past days.
Although the price continues its horizontal progress, the rise in the RSI side stands out.
In the short term, $1.4 can be considered as the target zone. Because it will make a move to clear the liquidity at this level at the first opportunity.
The big green candle on the side shows its weekly performance.
If it closes below the +OB level of $0.337, we will talk about new levels.
