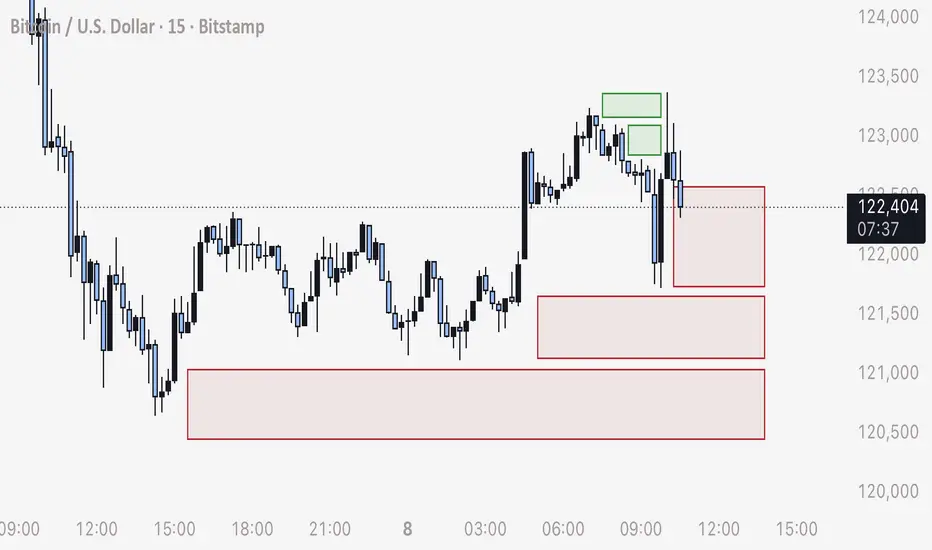
Stop Loss Killers Completed – Bullish Expansion Ahead?After three consecutive Stop-Loss Killers (SLK1, SLK2, SLK3), the market appears to have flushed out remaining buyers and collected liquidity below key lows. This structure often signals the end of a manipulation phase and the beginning of a potential bullish expansion.
With the FOMC rate-cut announcement expected this evening, the market now has both structural and fundamental conditions for an upside move. If the sweep was indeed the final liquidity grab, a rally toward the upper target zone may follow next.
Stophunt

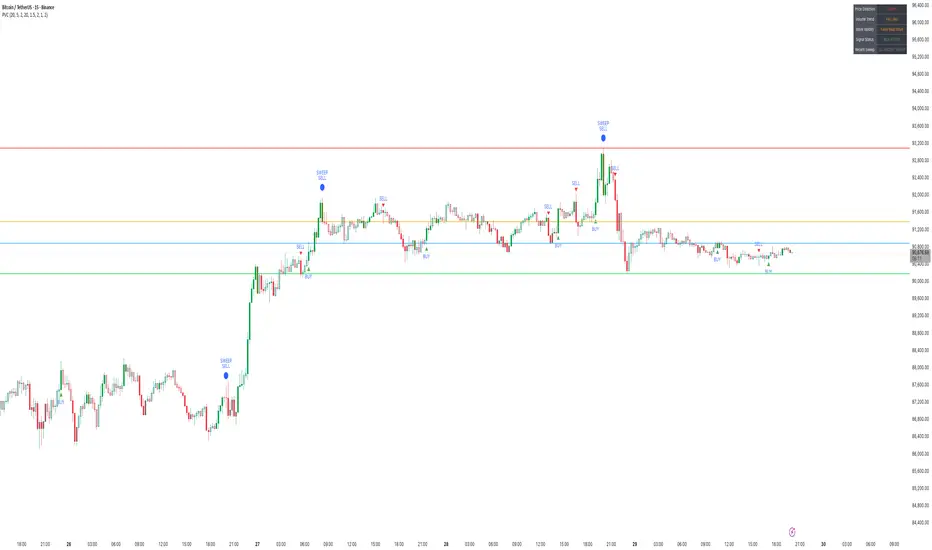
HOW TO USE "Price Volume Correlation (PVC) IndicatorPVC Indicator – Sideways Market, Weak Bullish Volume & Liquidity Sweeps at Range High
📌 Market Context (BTCUSDT – 15m)
Bitcoin continues to trade in a well-defined sideways range, with price oscillating between the previous day’s High, Low, Close, and VWAP levels.
What stands out is that most short-term moves — especially bullish attempts — lack meaningful volume confirmation. On the PVC indicator, this shows up as gray candles, which indicate no correlation between price direction and volume participation.
This lack of price-volume alignment is typical of a range-bound market, where price fluctuates but institutional participation remains muted.
⸻
1️⃣ Multi-Day OHLC Levels Acting as Strong Support & Resistance
The Multi-Day OHLC module plotted on the chart is playing a major role in revealing why the market has been stuck in a range:
• Previous Day High (PDH) → Strong Resistance
Price repeatedly tapped and rejected from PDH, showing liquidity hunts and seller absorption, especially during the large top-side sweep.
• Previous Day Low (PDL) → Reliable Support
The market bounced multiple times from the PDL region, confirming buyers defending the lower boundary of this range — but without strong volume, which prevents any sustained rally.
• Previous Day Close & VWAP → Mid-Range Magnet
These acted as mean reversion points:
• Price frequently returned to Daily Close/VWAP
• PVC candles stayed gray
• No volume expansion occurred
This behavior confirms that the market is rotating inside a fair value zone, not trending.
Conclusion from OHLC Levels:
The repeated interaction with these levels — without breakout volume — indicates classic sideways behavior, where price respects previous day key levels and rotates between them without a directional follow-through.
⸻
2️⃣ Liquidity Sweep at the Top – Clear Stop-Hunt & Reversal
A clean bearish liquidity sweep formed at the top of the range:
• Price spiked above PDH
• Collected stop-losses
• Closed back inside the range
• PVC turned red with strong volume alignment
This confirms the sweep was real, and sellers stepped in exactly at a major resistance level.
⸻
3️⃣ Weak Bullish Volume → No Momentum Follow-Through
Across the last 24 hours:
• Very few green PVC candles (True Bull Moves)
• Majority of candles remain neutral/gray
• BUY signals trigger but lack follow-through because volume does not expand
This indicates no aggressive demand — price moves up occasionally, but without participation.
⸻
4️⃣ Bearish Moves Have Volume Support
Interestingly, PVC shows:
• Red candles where volume rises during declines
• SELL signals aligning with volume spikes
• Bearish sweeps occurring at key resistance
This means sellers are more active than buyers, even though the overall structure is sideways.
⸻
🎯 Summary
• Market: Sideways / Range-bound
• OHLC Behavior: Daily High–Low–Close acting as clean support & resistance
• Top Sweep: Strong rejection from PDH with volume confirmation
• Volume Trend: Weak on bullish moves, stronger on declines
• PVC Reading: Mostly gray → no real correlation → low conviction environment
• Bias: Neutral to slightly bearish until PVC prints green confirmation (Price Up + Volume Up)
PVC helps to clearly distinguish between fake rotations and true momentum, while the OHLC levels provide a structural map of where liquidity sits.
This analysis is for educational and informational purposes only. Not financial advice.
BTC - How Low Can We Drop? DXY is just about to finish a bearish retest of a breakdown of a major multi-year bearish ascending channel, this indicated a true bull run spanning 3-7 years.
How manipulated is the crypto market? If it is to a large degree, we will likely see a “flash crash” to as low as 7,500
Personally I feel this is coming, as I’ve been indicating in my posts the last months.
Be prepared for this possibility.
- DD

When Crypto Actually MovesCrypto trades around the clock, but the market doesn’t behave the same way at every hour. Volume, liquidity, and volatility cluster around predictable windows, and those windows shape how setups form and how price reacts. When you understand these shifts, you stop taking trades randomly and start aligning execution with the moments when the market truly moves.
Why Sessions Matter
Even though crypto never sleeps, human traders and institutional desks still operate in cycles. Liquidity providers adjust during business hours. Market makers re-balance at session opens. Macro news is released on a fixed schedule. These patterns create recurring volatility signatures.
Ignoring sessions means you treat every candle as equal. Understanding sessions means you add a layer of context that improves timing, risk control, and win rate.
Asia Session (00:00–06:00 UTC)
The Asia window tends to be slower and more range-bound.
Characteristics include:
– Moderate liquidity
– Clean consolidations
– Accumulation before Europe
– Fewer impulsive moves unless driven by news from Asia-Pacific regions
This period often sets the initial range of the day. Liquidity begins to cluster above highs and below lows, creating the conditions for later sweeps.
Europe Session (07:00–12:00 UTC)
Liquidity expands significantly as London opens. You often see the first engineered move of the day.
Key behaviors:
– Early sweeps of the Asia range
– Strong breakouts from overnight compression
– Directional push before New York volatility
This session frequently defines the directional bias into US hours. It’s a prime window for structured setups because market participation rises sharply.
US Session (13:00–20:00 UTC)
This is the most active window. The highest liquidity and most decisive moves occur here.
Typical features:
– Strong continuation or full reversal of the London move
– Reaction to economic news
– Trend acceleration during peak overlap hours
This is where major breakouts, deep liquidity hunts, and high-powered moves happen. If you trade momentum or breakout strategies, this session offers the cleanest conditions.
Weekend Behavior
Weekends operate on thin liquidity. Order books are lighter, market makers are less active, and volatility behaves differently.
Common outcomes:
– Sharp wicks that violate structure
– Sudden spikes without follow-through
– False breakouts with immediate reversals
Weekend moves often distort technicals. They can be useful for narrative-driven positions but carry higher risk for intraday traders.
How to Integrate Sessions Into Your Trading
Use sessions to filter when you participate and when you avoid noise.
Practical adjustments:
– Execute momentum setups during Europe or US hours.
– Treat Asia session as a range-building phase suitable for scouting zones.
– Avoid taking aggressive positions during weekend chop.
– Use session opens as key decision points for liquidity grabs.
When you layer session timing on top of structure, you refine entries and eliminate trades that lack the environment for follow-through.
The Strategic Advantage of Session Awareness
Session timing gives you clarity. You start anticipating where liquidity is likely to be engineered, where volume will enter, and when the market is likely to trend or stall.
This transforms your approach.
Instead of reacting to candles, you plan around expected volatility cycles.
Instead of forcing trades, you wait for session transitions that historically produce reliable movement.

Liquidity Basics: Equal Highs/Lows, Inefficiencies & POIsPrice doesn’t move randomly, it is always attracted towards liquidity.
Every wick, breakout, and fake-out tells a story of orders being filled.
If you can read where those orders are hiding, you stop trading noise and start trading intention.
Equal Highs & Lows — The Obvious Targets
Retail traders love to mark equal highs and lows as “strong support/resistance.”
Smart money sees them as fuel.
Above equal highs = cluster of buy stops.
Below equal lows = cluster of sell stops.
When price reaches them, it’s a collection of accumulated liquidity as a main driver behind that move.
Inefficiencies — Fair Value Gaps
Also known as Fair Value Gaps (FVGs) or imbalances, these occur when price moves too quickly, leaving unfilled orders behind.
Price often revisits these zones later to rebalance.
Spot them between large candles with no overlap, they often mark where institutions filled partial orders.
Points of Interest (POIs)
POIs are areas where liquidity and inefficiency converge , the zones of intent.
Look for:
Liquidity sweep of equal highs/lows
Return to imbalance or order block
Shift in market structure
That’s where high-probability setups occur.
Note:
Stop chasing every candle.
Start mapping why price moves.
Equal highs and inefficiencies are magnets, with proper plan and confluence this can represent your strong side of trading.

Liquidity Zones Explained: Where Smart Money GoesMarkets don’t move randomly. Every candle, spike, or reversal happens for a reason and that reason is liquidity.
Liquidity is what fuels price movement. It’s where buy and sell orders are concentrated, and where large players execute positions without showing their hand.
Understanding where liquidity lies gives traders a major advantage, because price doesn’t move to levels by accident. It moves there to fill orders.
Liquidity represents the pool of resting orders waiting to be filled — stop losses, pending buys, or sells.
When price reaches these areas, volume spikes, and the market finds enough counterparties for large players to enter or exit positions.
Liquidity isn’t just numbers on the book. It’s the invisible map of trader behavior:
– Stops above highs (where breakout traders get trapped)
– Stops below lows (where panic selling occurs)
– Consolidation zones (where both sides accumulate orders)
These areas become magnets for price movement.
When you see sharp wicks above or below key levels, it’s often not manipulation — it’s collection.
Smart money drives price into these zones to trigger stop losses and capture liquidity before reversing in the true direction.
The move looks random, but it’s calculated.
The goal is to fill large positions efficiently, using retail orders as exit liquidity.
Instead of chasing price, learn to wait for liquidity grabs.
The simplest method is to mark obvious highs and lows and observe how price reacts when those levels are taken.
If price breaks a key high but fails to continue — and momentum shifts back down — it’s often a sign of a liquidity sweep, not a breakout.
These moments reveal where the real players are positioning themselves.
Trading liquidity is about reaction, not prediction.
Liquidity zones reveal where traders are trapped and where professionals engage.
If you stop focusing on where price is and start paying attention to why it moves there, you’ll see the market with far more clarity.

How does the market always know my stop loss?When you finally go long with confidence and the market instantly proves you wrong.

NYSE: FRO – Bulls Defending Key Trendline & SMA 50 SupportSince April, NYSE: FRO has been building a steady uptrend, forming a sequence of higher highs and higher lows. Each corrective wave has consistently found support along the rising trendline (GREEN), which has now been successfully tested three times.
In July, price broke above the 50-day SMA (BLUE) and has since turned it into a strong dynamic support — a sign of clear trend recognition by the market.
Most recently, on October 14, FRO printed a candle that tapped into multiple layers of confluence:
* Retest of the ascending trendline
* Touch of the rising 50-day SMA
* Stop-hunt wick sweeping below recent lows
* Reclaim of the horizontal support (RED dotted line)
This combination suggests a strong defense from buyers at this zone. While short-term volatility may persist, the overall structure remains constructive — as long as price holds above the trendline and SMA 50, the bullish momentum stays intact.

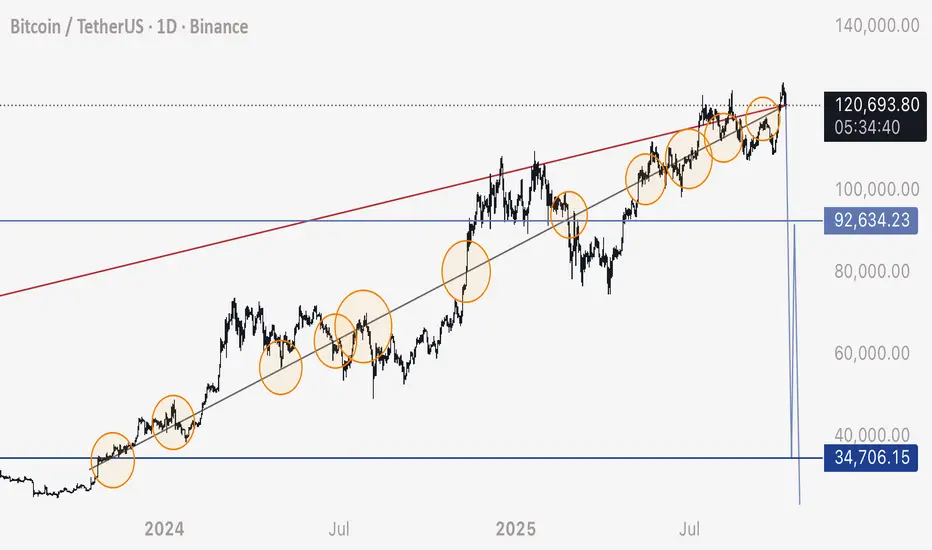
BTC - Explanation of My 35,000 Drop Prediction Here is a broken down explanation of why I’ve been predicting Bitcoin dropping to 35,000
1. We can see this diagonal ascending trendline and how price has been respecting it by looking at the various contact points circled in orange.
2. Bitcoin has been consolidating on either side of this trendline since the beginning of it.
3. Liquidity has been building and building in the form of sell orders / long stop losses all the way down as price has made no substantial recovery of these zones.
4. Eventually Bitcoin will stick it as resistance and as soon as those order blocks are hit, there is enough orders in place (stop losses and liquidations) to drop the price to 35,000 in a very short time period. Essentially, the limit orders are in place like a staircase all the way down, they will fill one after the next and the chart has all the fuel and propellant needed to make a wick to that level.
5. The only reason we would see price consolidate so truly to a bearish line like this is to attract buys and longs as it slowly moves up - this mechanic of the market makes it not only possible but highly likely to happen and we don’t need any sort of black swan or bad news. The orders are ready to set off.
6. This is way more likely than people seem to think. Every long opened has a stop loss order or liquidation order for the entire position size. We can CLEARLY see, just by looking at the chart, these wide open gaps on the chart are filled with these orders. They have been left intact PURPOSELY in order to design a natural, fast wick of a movement.
7. This wick will reclaim all of the market makers and liquidity providers liquidity to them, and de-leverage all open positions.
I truly believe this will happen exactly as I say it will.
- Drop to 35,000
- Very fast drop (2-12 hours for the whole movement - if not, 1 hour)
I’d encourage readers to at least be mindful of the rational behind this analysis and take proper precautions to protect yourselves.
Respectfully,
- DD
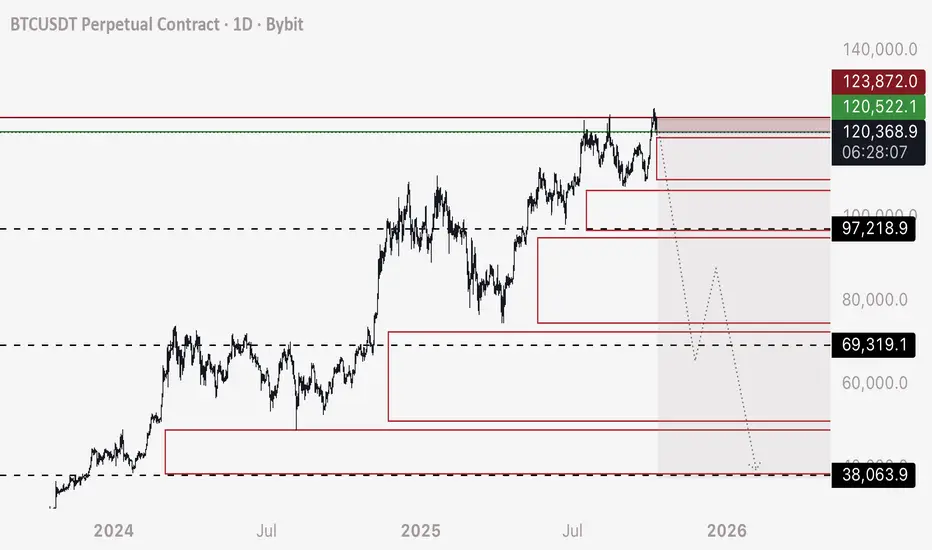
BTC - Short a Stop Hunt and Stay on the Right SideI’m breaking my larger idea down into multiple trades, now that others are opening up to the reality that it’s possible.
These order blocks shown are filled with long position stop losses, leveraged sell orders that only fill when price crosses over - and will set off like a chain reaction.
This will create a very fast drop IE Stop Hunt - and we can take advantage of it.
TRADE 1 - SHORT
Entry - 120,200 to 120,500
Stop Loss - 123,800 (although I don’t see Bitcoin rising back above 121,000 before this trade completes)
Target 1 - 97,250 (Close 25% of trade)
Target 2 - 69,400 (Close 50% of trade)
Target 3 - 38,100 (Close 40-90% of trade as it’s possible we continue to drop and don’t retrace from here to 90,000 appx)
I’ll be logging this trade.
All the best and buckle in.
- DD
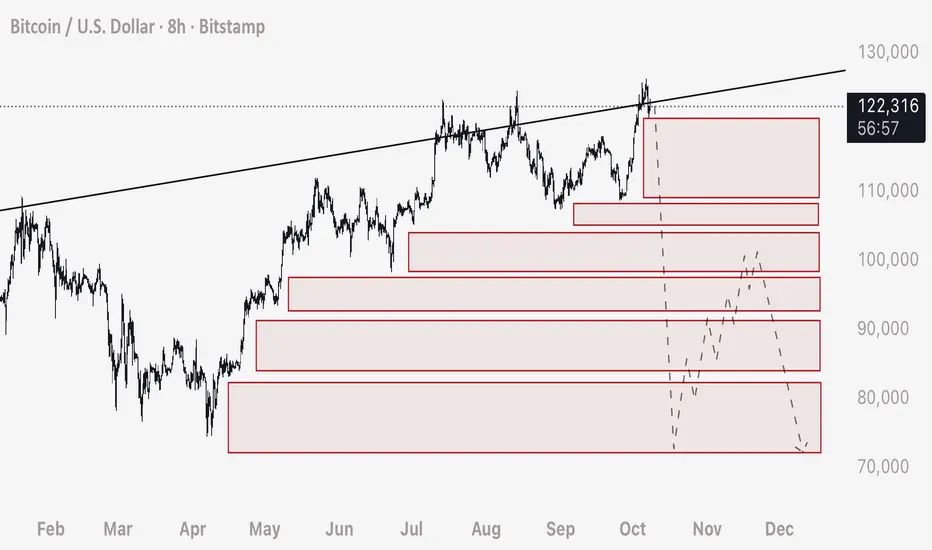
Using Order Blocks to Predict Price Movement on HTFExpanding on my previous post, we can apply this technique to predict price movement on the higher time frames (8 Hour in this case).
Step 1 - Drawing the Boxes
- Fundamentally what we want to do, is look at the price movement and figure out where clusters of stop loss would be contained.
- To do this, we want to look for the areas of upwards (in this example) consolidation that hasn’t dropped down to trigger the orders.
- I have drawn boxes here close to the candle set, and extended them out past where price currently is to prove that these areas have not been reclaimed or had the stop loss orders triggered.
PLEASE NOTE: Stop Loss orders and Liquidation Orders are very unique. Unlike limit orders that will automatically fill if price is above or below, these orders do not fill unless price CROSSES the exact price of the order. In essence, it’s important to understand that looking back on the chart we can understand there are limit orders for sells (in this example) that’s below the current price. If a limit sell order was to be placed at a lower price, it would fill automatically if price is above.
- We can anticipate a take profit (locally in this example) at 74,000. SHORT entry should be where the orders begin to set off to a large degree, in this example, entry would be BELOW where price currently is, at 122,200. We want to make sure that the stop loss orders will be enough to carry the price through these blocks. Stop loss can be places above the local wick high (where the SHORT stop losses have already been filled) at 123,900.
Step 2 - Predicting and Understanding Wick Speed
- To predict how fast the movement will complete, we need only evaluate the amount of TIME allowed for positions to be placed (longs in this example). Very simply because the more time provided to traders in an upwards consolidation, the more positions and consequently stop losses and liquidations will be placed below the price.
- More TIME = More Orders = Faster Wick Speed. To understand this another way, imagine there was 2 scenarios where regular limit buys were placed. Scenario 1 has 100 people placing buy orders, Scenario 2 has 10,000 people placing buy orders. Scenario 2 would move price higher at a faster speed, and to a greater distance. In other words we are predicting VOLUME of STOP LOSS ORDERS.
PLEASE NOTE: Stop Loss orders move price at a greater volume compared to the position entry. If Trader A uses $1,000 to open a Long, and uses a leverage of 10x - his Stop Loss or Liquidation order is to close the entire leveraged position size. While he is injecting $1,000 of liquidity into the market with his order, he is consequently leaving a sell order underneath his entry for $10,000 (leveraged position size).
PLEASE NOTE: The placement and amounts contained in stop losses or liquidations are not available to the public. Exchanges do not need to disclose that information, and you can assume it’s only shared with the market makers or liquidity providers. Heatmap Platforms such as Coinglass have disclaimers that state it’s not based on true date and is only a prediction.
SUMMARY:
I hope this serves you with a practical demonstration of how we can use Stop Loss analysis to predict price movement.
I also hope that you can understand you’re able to do this yourself by developing the vision to quickly see it in the chart. We are blessed in that we simply need to look backwards to see where we will be going next, as the orders that move Bitcoin are previously embedded in the chart.
Yours truly and all the best,
- DD
If you have any questions or want further clarifications - please ask in the comments and I will answer you.
BTC - Practical Example of Trading Order Blocks / Stop HuntsHere is a very practical, recent example of trading the reaction of BTC hitting stop loss order blocks and how price moves.
Green Boxes:
- Note that price moves in a slow, downwards consolidation
- This slow drop allowed time for traders to enter shorts, consequently leaving stop loss orders for the entire position size
- The price movement when these cascading blocks of orders are triggered always moves exponentially faster than the consolidation. Slower the move in a direction = faster the wick in the opposite direction. More orders ( buys or sells ) equals greater speed and distance.
- These orders being triggered (stop losses and liquidations) trump any pattern, support or resistance. It all becomes irrelevant as the order chains will always execute and set off, ignoring any technical pattern.
Predicting this Wick to 123,300:
- Notice the downwards consolidation followed by a faster drop in the end.
- Price quickly moved higher
- From this point we can anticipate that the high leverage stop loss orders for shorts will be triggered, at this point you can scalp a long, take profit slightly above where the consolidation started.
Red Boxes:
- The red boxes are sell orders created from long positions being opened and consequently their stop loss and liquidation orders
- Mark and extend boxes from the open zones that price has not reclaimed
- When price moves down low enough, to start filling these sell orders, you may short to slightly below the beginning of the upwards consolidation
- I’d anticipate when price moves below 122,200, that’s when the wick will form and land at a minimum of 120,100 (if not setting off more sell orders as we look at higher time frames than the 15 M)
- Looking at the slowness and time allowed for the upwards consolidation, we can anticipate a larger amount of longs have been opened, and this can be translated to an increased speed of a wick down and faster movement.
In Summary:
I hope this serves you as a good, practical example of the method of trading stop losses hunts and order blocks, which in my experience is the only reliable way to predict the price of Bitcoin.
Yours truly,
- DD
Stop Losses: The Good, The Bad and The UglyLet’s be honest — few things trigger more emotion in trading than a stop loss being hit.
But not all stop losses are created equal.
Even though the title says “The Good, the Bad, and the Ugly”, let’s start with the Bad — because that’s where most traders get stuck.
________________________________________
🚫 The Bad Stop Loss
The bad stop loss is the arbitrary one.
You know the type:
“I trade with a 50-pip stop loss.”
“My stop is always 1% below entry.”
No matter what the chart looks like.
No matter what the volatility of the asset is.
No matter if you’re trading Gold, EurUsd, or Nasdaq.
This kind of stop loss doesn’t respect market structure or context — it’s just a random number.
You might get lucky a few times, but over the long run, it’s a losing game.
If your stop loss doesn’t make sense on the chart, then it doesn’t make sense in the market either.
There’s no nuance here — it’s bad, period.
________________________________________
✅ The Good Stop Loss
The good stop loss is strategic.
It’s placed based on structure, volatility, and logic — not habit or emotion.
You define it after you’ve studied:
• Where invalidation occurs on your idea
• The volatility range of the asset
• The natural “breathing room” of the market
When this kind of stop loss is hit, it’s not a tragedy.
It’s information.
It means your prediction was wrong.
You expected the market to go up, but it went down — simple as that.
No panic. No revenge trading.
You step away, clear your mind, and wait until the next day.
Then, you redo your analysis without bias.
If the new structure confirms that the market has truly flipped direction — then, and only then, you can trade the opposite way.
That’s professionalism.
That’s how you stay consistent.
________________________________________
😬 The Ugly Stop Loss
Now, this one hurts.
The ugly stop loss is the good stop loss that gets hit… and then the market reverses immediately.
You were right — but your stop was just a little too tight.
That’s the emotional pain every trader knows.
But here’s the key:
This situation only counts as ugly if your original stop loss was good — meaning, logical and based on structure.
If it was arbitrary, then it’s not ugly — it’s just bad.
So, what do we do when a good stop loss turns ugly?
We do exactly the same thing:
• Wait until the next day.
• Reanalyze the chart with fresh eyes.
• If the setup is still valid, re-enter in the original direction.
It’s rare for both the first and second stop to be “hunted.”
Patience gives you clarity — and clarity gives you edge.
________________________________________
💭 Final Thoughts
Stop losses aren’t just a risk tool — they’re a psychological mirror.
They reveal whether you trade with emotion or with structure.
The bad stop loss shows a lack of respect for the market.
The good stop loss shows discipline and logic.
The ugly one shows that even good decisions can lead to short-term pain.
But pain is not failure — it’s feedback.
So the next time your stop gets hit, don’t see it as punishment.
See it as a test of your ability to stay rational when the market challenges you.
Because in the long run, consistency doesn’t come from winning every trade.
It comes from handling the losing ones correctly. ⚖️

Revenge on the mind? The Most Expensive Trade You'll Ever TakeThe most expensive trade isn’t that first loss of the session.
It’s the second one, the one you took trying to get it back.
The chart here is one of a sideways consolidation. Easy in hindsight right? But if you're a break out trader, or one that is looking to get involved but is caught in the noise - it's easy to get collected and feel irritated and out of sorts. How it shows up in behaviour is that one might increase size - double down - move stops (to name but a few examples).
That moment of being picked off feels electric:
You’re angry at the market.
You want to erase the red.
You convince yourself the setup is “still good.”
But it isn’t trading anymore. It’s revenge.
I’ve seen traders burn accounts this way.
It doesn’t matter whether you’re trading a $1k retail account or a $10M book, the loop looks the same.
Here’s the truth most won’t admit:
👉 Losing isn’t the problem.
👉 How you react to the loss defines your career.
So how do you break the loop? Three quick checks:
The Pause Rule : After a loss, step away for 5 minutes. If you feel an urge to “get it back,” you’re not trading you’re reacting. Take a walk. Breathe. Let that urge simmer down.
The Red Line: Decide before you start how many trades or a max loss per session you’ll allow. Hit that line? Walk away. Live to trade another day.
The Reset: Write down what just happened, in one sentence. Putting it on paper shifts you out of the emotional loop and back into analysis.
If you’ve felt the pull of revenge trading, hit follow this is where we break down the emotional traps behind every chart. Let me know if you've experienced this too.
Please note - this is not a Trade Idea. I'm exploring the mindset behind trading using this chart as an example.

BTC - Short Update Part 2This chart shows the ascending parallel channel that supports 7,000-8,000 ultimate bottom - layered with BITCOIN ONLY liquidity zones on the multi day time frame.
The majority or liquidity in the chart is long position stop losses - leveraged sell orders.
Bitcoin has been moving straight up, consolidating sideways, straight up, consolidating sideways since End 2022.
This tells us the market is collecting long position stop losses and leaving them in tact IE not allowing price to fully drop and start triggering off the cascading chain reaction of sells that is a natural phenomenon.
Happy Trading.
BTC - Update on Suspected Flash Crash ScenarioFor those of you who have been following my ideas, and I don’t think that would be many - understandably so, because these ideas seem so outrageous and out of the norm - I feel obligated to provide updated numbers per my own personal trade ideas.
I expect BTC to flash crash. In summary, here is why:
1. DXY is breaking down and retesting a major bearish trendline on the monthly. This alongside geopolitical events and sentiment, I expect the dollar to fall rapidly and store of value assets such as BTC to see a multi year bull run.
2. The market has been steadily bringing BTC up since late 2022. This leaves a trail of long position stop losses below the price, leaving a massive chain reaction of sell orders ready to set off one into the next. In other words, the orders required to make the drop are already in the chart.
3. It’s a question of when - BTC is under 3 intersecting bearish trendlines, and we can see how price breaks above and below these support / resistance levels historically. Eventually they will hold and play out, estimating when is tricky - that’s why I use DXY to predict it.
It’s difficult to pinpoint where the upper resistance is - but a pretty solid pick is around 105,200. I’ve used various numbers in the past for this idea, but it’s always refining and evolving based on what I see price doing.
I’m proposing two movements for a massive liquidation sweep of the lows prior to a 3-5 year bull run where BTC sees those quarter million dollar prices.
Scenario 1:
105,200 to 35,000
35,000 retrace to 77,000 ( although this doesn’t have to happen, I just anticipate a 3 wave corrective move)
77,000 to 10,000 (could be as low as 7,000)
7,000 and upwards of 200,000 (after all liquidity is absorbed and reclaimed)
Scenario 2:
105,200 straight down (for the most part) to 17,000 to 20,000
17-20,000 and upwards to 200,000 plus
Personally I feel scenario one is most likely. I’ve been trading this market since 2017 and the newfound “ stability “ of Bitcoin during the last 2 years cannot be trusted. This upwards move IS NOT a bull run. It’s a BEARISH RETEST.
Bearish retests typically move straight up, exactly as what’s been happening - following by a drop roughly 10 times as fast.
Same ideas on the larger time frames as smaller time frames.
WHEN DO I EXPECT THIS TO HAPPEN?
Starting any minute and spanning over the next several days to week.
Anyway - that’s my update for those of you who are interested.
Understand this stuff gets laughed at - but I experienced the same treatment when I told my group to long BTC at 16,500 in Jan 2023 to a target of 90,000. It’s not new to me and I expect it.
Doing my best to help advise and open your minds to alternative ideas.

BTC - On its way down from these trendlines How low can we go? We will find out.
Three bearish intersecting trendlines above.
Short began initiating from above as per my previous post.
I personally am not ruling out a flash crash to 10,000.
DXY is breaking down a major bearish trendline on the weekly / monthly - Market has a prime opportunity to manipulate Bitcoin into all of these long stop losses and trigger a massive liquidation event.
Stay alert and safe!

BTC - Be mindful of resistance around 109,800 to 110,000Per my second last post about this red trendline - be mindful that there is a resistance located 109,800 to 110,000 zone.
Although Bitcoin can break above, that doesn’t mean the resistance is invalid. Price will weave above and below until it sticks and plays out.
Personally I watch these levels for sudden fast movement and confirmation that it’s holding as resistance.
If you see a fast drop initiate from these levels, be mindful that this could be indicative of intention to hit the lows around 20,000.
For more information see my previous posts.
Happy trading

BTC Under Major Resistance HereBitcoin has shown strength towards playing out these ideas, as unrealistic as it may seem.
The interactions at specific levels have shown these trendlines to be valid.
I see two scenarios if BTC holds below its resistance at 104,550 to 105,000
104,600 to 35,000
35,000 retrace to 75,000
75,000 to 7,000
Alternatively:
104,600 to 20,000
Up from 20,000
While these seem like macro projections, per my previous posts and explanations - it’s possible to see this occur in a very small period of time. IE flash crash, stop hunt, etc.
Happy trading.

BTC - Another Potential Bearish PatternHere I present my second alternative for a Bearish case for Bitcoin.
Per my previous posts I explain in detail the interest in recollecting liquidity in these lower zones. Previously I presented pathways to the uber lows at 7,000-10,000 - however this is another possible case.
I believe Bitcoin can see a drop from 109,200 straight down to 19,000-20,000
Why?
1. Major Volume support at this level
2. Major liquidity pools in confluence with this level
3. Price would form a W bottom with a higher low - which aligns with DXY breaking down on the monthly time frame. We can use DXY to project a bull market spanning 2-5 years (weakening dollar = more interest in deflationary assets such as Bitcoin)
4. Per the note above, it’s unlikely that BTC continues straight up without a sharp drop. The way this market works is to a large degree with leverage trading. The market and exchanges desperately want to shake out these longs, especially if we consider a 2-5 year bullish forecast through a macro view.
5. Confluence with this diagonal trendline which shows a clear support / resistance structure (note the Bitcoin chart is formed via diagonal ascending support and resistance lines - we can demonstrate this clearly and repeatable by duplicating the correct trendline and seeing how it forms the chart at any location)
Personally, I am shorting Bitcoin from 109,000 - and am expecting to see a fast drop through the rest of the weekend.
I will watch what the price does, where it reacts and interacts, and attempt to get a head start on understanding the true bottom before this “true” bull cycle begins.
Happy trading

BTC - Bullish Madness or Bearish Retest?Zooming out on BTC chart we can note this major bearish trendline on the HTF. This diagonal support / resistance line can take BTC to 7,000.
Likely? Maybe not. Possible? Absolutely.
A straight move up on BTC like we have seen the last two years is very dangerous. There is a large chain reaction of leveraged sell orders via long position stop losses cascading down the price levels.
Can this trigger a massive and fast flash crash?
In my view - absolutely.
Here are two potential moves that take price to those low liquidations levels.
Possibility 1
110,000 to 35,000
35,000 retrace to 81,000
81,000 to 7,000
Possibility 2
110,000 to 43,000
43,000 retrace to 72,000
72,000 to 7,000
Note that both of these possibilities end with 7,000. I’m mapping out two routes that take us there, using confluences with trendlines, volume profiles, liquidity mapping, and common sense.
Always remember that crypto is a very new market, with some unique mechanics that differentiate it from other more established markets. Predominantly the futures and high leverage usage and the ways these platforms make their money…
Beware and be prepared.

Understanding Liquidity: Where Big Players Hunt Stops
Understanding Liquidity: Where Big Players Hunt Stops
Ever wondered why price suddenly spikes through your stop-loss and reverses moments later? That’s not a coincidence—it’s liquidity at play. This article will teach you how liquidity zones work, why stop hunts happen, and how to avoid getting trapped like the crowd.
🔵 What Is Liquidity in Trading?
Liquidity refers to how easily an asset can be bought or sold without drastically affecting its price. But in practical trading, liquidity is more than just volume—it’s where traders *place* their money.
Large players—institutions, market makers, or big accounts—need liquidity to fill orders.
They target areas where many retail stop-losses or pending orders are stacked.
These areas are often just above resistance or below support—classic stop-loss zones.
To move large positions without slippage, smart money uses stop hunts to trigger retail orders and create the liquidity they need.
🔵 Where Do Liquidity Zones Form?
Liquidity often builds up in predictable areas:
Above resistance: Where shorts place stop-losses.
Below support: Where longs place stop-losses.
Swing highs/lows: Obvious turning points everyone sees.
Round numbers: e.g., 1000, 10,000, 50,000.
Breakout zones: Where breakout traders place entries or stops.
These zones act like magnets. When price approaches them, it accelerates—seeking the liquidity pool behind the level.
🔵 What Is a Stop Hunt?
A stop hunt happens when price moves just far enough to trigger stop-losses before reversing. This isn’t market noise—it’s an intentional move by big players to:
Trigger a flood of stop orders (buy or sell).
Fill their own large positions using that liquidity.
Reverse price back to fair value or the prior trend.
Example: Price breaks above resistance → stops get hit → institutions sell into that liquidity → price drops sharply.
🔵 Signs You’re in a Liquidity Grab
Look for these clues:
Fast spike beyond key levels followed by rejection.
Wick-heavy candles near highs/lows.
Price touches a level, then sharply reverses.
High volume on failed breakouts or fakeouts.
These are signs of a liquidity event—not a real breakout.
🔵 How to Trade Around Liquidity Zones
You can use liquidity traps to your advantage instead of becoming their victim.
Avoid obvious stops: Don’t place stops directly below support or above resistance. Instead, use ATR-based or structure-based stops.
Wait for confirmation: Don’t chase breakouts. Let price break, reject, then re-enter inside the range.
Watch for wick rejections: If price quickly returns after a level is breached, it's often a trap.
Use higher timeframe confluence: Liquidity grabs are more powerful when they align with HTF reversals or zones.
🔵 Real Example: Liquidity Sweep Before Reversal
In this chart, we see a textbook liquidity grab:
Price breaks below support.
Longs get stopped out.
Candle prints a long wick.
Market reverses into an uptrend.
This is where smart traders enter— after the trap is set, not during.
🔵 Final Thoughts
Liquidity is the invisible hand of the market. Stop hunts aren’t personal—they’re structural. Big players simply go where the orders are. As retail traders, the best thing we can do is:
Understand where traps are set.
Avoid being part of the crowd.
Trade the reaction, not the initial breakout.
By thinking like the smart money, you can stop getting hunted—and start hunting for better trades.

BTC - “Bull Market” OR Bearish Retest on HTF? Bitcoins excessive rise for the previous two years brings concern for the mechanics of this market. Moving only up for so long leaves much liquidity in the form of long position stop losses below the current price.
These stop loss orders, or leveraged sell orders, are an explosive chain reaction ready to set off.
Observe these two trendlines and copy them to your charts. These two bearish trendlines (in my view) are why bitcoin has truly been rising so freely.
Moves up in the form of bearish retests are fast and fluid, only after the rejection does price fall aggressively.
I anticipate two scenarios here in the realm of bearish ideas:
Possibility 1 - 30% Probability
96,700 to 34,500
34,500 retrace to 68,500
68,500 to 7,000
Possibility 2 - 70% Probability
96,700 to 43,000
43,000 retrace to 60,000
60,000 to 7,000
Note that both of these possibilities end with 7,000. I’m mapping out two routes that take us there, using confluences with trendlines, volume profiles, liquidity mapping, and common sense.
Be mindful of this possibility. And protect yourself accordingly.
