$STRK - Long term outlookNASDAQ:STRK - Long term outlook 🚨
Long-term outlook remains pretty bearish under the $0.1050 - $0.1000 monthly previous key support...📉
Levels to watch:
📍 $0.0770 - $0.0850 - $0.0920 - $0.0960
Accumulation & sideways phase possible inside yellow zone 📊
A daily candle break under $0.0770 would trigger another sell breakout! ⚠️
Not financial advice - DYOR & manage your risk accordingly.
Strk

STRK Buy/Long Setup (4H)It seems we are at the end of the corrective wave C.
There are confirmations indicating a pullback to higher levels, including a bullish CH and positioning at important levels.
We have identified two entry points, where you should enter the position using DCA.
Targets are also marked on the chart.
A 4-hour candle closing below the invalidation level will invalidate this analysis.
For risk management, please don't forget stop loss and capital management
When we reach the first target, save some profit and then change the stop to entry
Comment if you have any questions
Thank You

STRK - USDT - Update:NASDAQ:STRK - Price Analysis:
Weekly candle looks pretty bad, with a large close under the $ 0.1000 monthly support! 🟥
Main trend remains pretty bearish at the moment, reflecting a lack of demand, bad tokenomics or early insider dumping 📉
No buy pressure at the moment, but if the LL holds on the weekly, we could see a bull correction to revisit the previous key support as resistance!
Keep an eye on the H1 downtrend for potential bull reversal / correction. 🟡
⚠️ Not financial advice - DYOR.
#STRK #trading

STRK Price Analysis: What Comes Next After a 70% Drop?* STRK has erased nearly all of its recent rally after a sharp 70% monthly drawdown.
* The STRK charts show early stabilization near support, but the broader downtrend remains intact.
* On-chain data hints at slowing sell pressure, though conviction from buyers is still limited.
When you zoom out and look at Starknet’s recent price action, it’s clear the market isn’t in full panic anymore, even after such a brutal selloff.
The STRK price didn’t just drift lower; it dropped nearly 70% in a short span. But what’s happened since feels more like the market catching its breath than continuing to unravel.
Lately, the STRK price has been hovering around the $0.085–$0.09 zone, an area that lines up with earlier consolidation before the last rally.
After slicing through multiple support levels during the unwind, this is the first spot where selling pressure has noticeably slowed. Dips into this range are getting absorbed faster, suggesting sellers are losing urgency even if buyers aren’t stepping in aggressively yet.
On-chain data helps put that into context. While STRK’s market cap clearly fell during the selloff, the pace of capital leaving the ecosystem has eased. Money isn’t rushing out the door anymore, which often signals a shift from outright distribution to a digestion phase.
Network activity supports that view. Active addresses and transaction counts dropped during the worst of the selloff but have since started to stabilize. They aren’t surging, but they’re also not collapsing, which usually means users are sticking around while price works through a reset rather than abandoning the network.
The biggest obstacle remains overhead. On lower time frames, the STRK price is still capped by a descending trendline that has rejected every bounce since the breakdown. Each recovery attempt has stalled quickly, showing buyers are cautious and conviction remains limited.
What’s next for Starknet?
If STRK can hold the $0.085–$0.09 base and eventually reclaim that trendline, the chart would start to look healthier. A move back toward the $0.11–$0.12 area would feel like real progress, not just another reflex bounce.
If that doesn’t happen, the downside is easier to map. A clean break below support would put lower levels back into focus, especially if broader market sentiment turns risk-off again. CoinCodex’s one-month STRK price target near $0.06451 reflects that risk.
For now, STRK is firmly in wait-and-see mode. The damage has already been done, but the chart still needs proof that selling is truly finished.
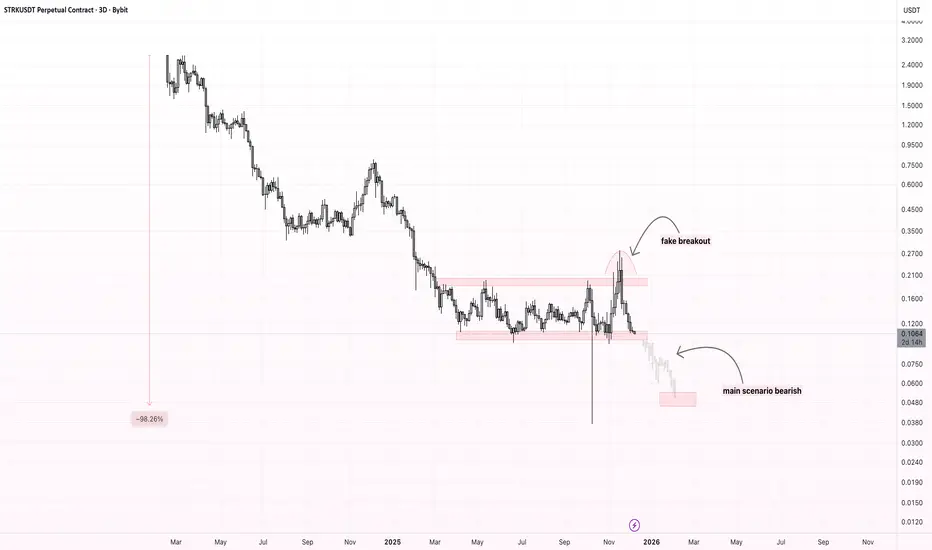
STRK – Horizontal Accumulation, Fake Breakout & Bearish OutlookPrice has spent a long time moving inside a horizontal accumulation range. Recently, the market attempted a breakout to the upside, but the move failed and quickly returned back inside the range — a classic fake breakout / deviation above resistance.
The failed breakout shifts the market structure toward weakness. As long as price stays below the upper boundary of the range, the main scenario remains bearish.
I expect continuation to the downside, with the next liquidity zones and potential targets located in the $0.055–$0.045 area.
A reclaim of the range high would invalidate the idea, but for now momentum favors sellers.
STRKUSDT – Push Down Incoming?The entire crypto market right now = pure fear mode.
Everyone’s sweating, charts are crying, and STRK was holding on like a brave little soldier…
until today.
Now it finally said:
“Alright boys, I’m tired, I’m going down too.”
I’m expecting another push to the downside, because this whole move looks like one big emotional flashout — the kind where market makers drag us lower just to check if we still have feelings.
🔎 What to watch:
• How deep can this flush really go?
• Where’s the real liquidity?
• Will STRK bounce or commit to the full gymnastic dive?
Let’s see — volatility today is high, fear everywhere, so manage this smartly.
⸻
⚠️ Risk & money management ON
Don’t get liquidated today, please.
STRK doesn’t deserve your entire account. 😅
Good luck traders — may the flashout be gentle. 🚀💀

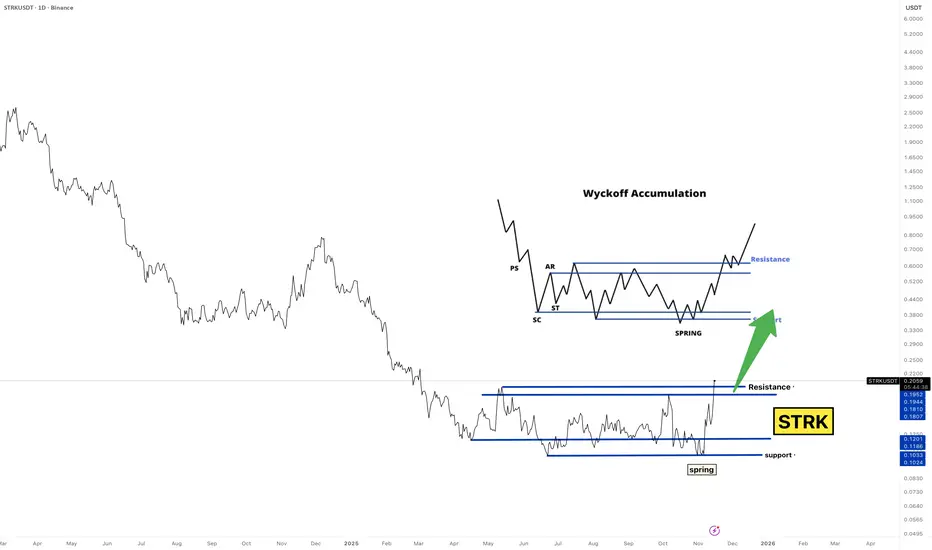
STRK just completed one of the cleanest Wyckoff Accumulation The chart literally looks like it was copied straight from the textbook:
Selling Climax → ST → Spring → Breakout
Perfect reclaim of the entire range
Volume kicking in right at resistance
Composite Operator behavior all over this
This is the kind of setup most traders only recognize after the markup begins.
If this plays out:
📌 $0.25 → $0.34 → $0.45+
That’s the path.
Not a guarantee — just a pattern the market has respected for over 100 years.
This is why you study structure.
This is why you watch accumulation ranges.
STRK is waking up.
NASDAQ:STRK #Wyckoff

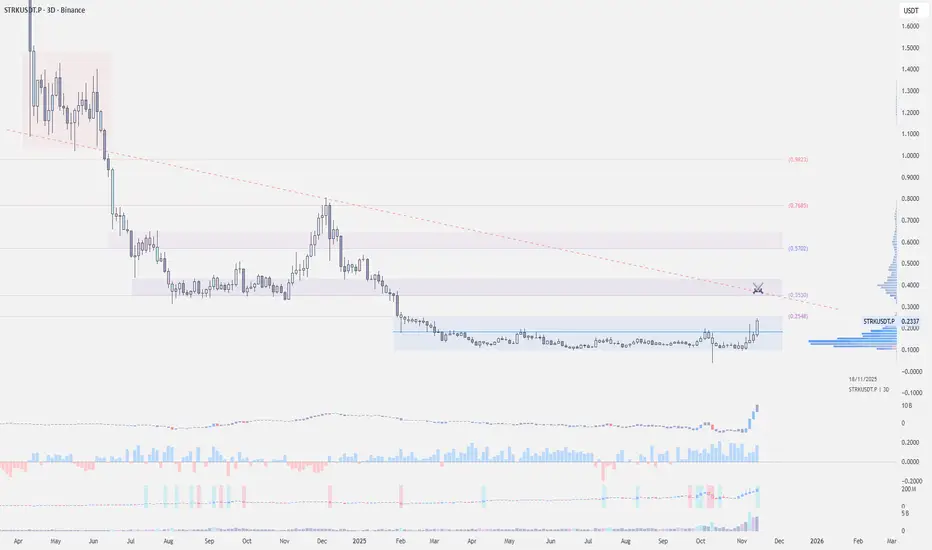
STRKUSDT - The real STAR!Let me introduce you to the new rising star that’s about to steal the spotlight: STRK.
The coin has been pumping like crazy for the past few days, but once you zoom out and check the chart, you’ll see that this is just the beginning — a clean breakout from a 258-day accumulation range.
Not only that, but it also broke the long-term descending trendline (from day one of the project) and successfully retested it.
I’m not exaggerating when I say the minimum target lies around the 0.618 Fibonacci level,
which is roughly a 3× move from the current price.
Best Regards:
Ceciliones🎯

$STRK price — Testing the end of a long-term downtrendAfter months of pressure since early 2024, #STRK is attempting a breakout.
The next two daily candle closes for OKX:STRKUSDT will be crucial for confirming direction.
Above $0.17 — potential confirmation of reversal and continuation higher.
Below $0.17 — likely a stop-loss hunt before retesting support near $0.07.
The market structure still looks fragile, so confirmation is key before entering long positions.
💭 Could this finally be the turning point for #Starknet , or another trap for hopeful buyers?
______________
◆ Follow us ❤️ for daily crypto insights & updates!
🚀 Don’t miss out on important market mov es
🧠 DYOR | This is not financial advice, just thinking out loud.

STRK - PERFECTWho laught on my chart? 👀
35% up from my bull chart ✅
30% down from the bearish chart✅
NASDAQ:STRK - 265 days range retest is in?
Following my lines, this could be a key retest before to see a 50%+ move 🚀
Remember:
90%+ of time the market tend to retest key breakout levels.
Follow the CryptoFrog to not miss any EPIC move! 🐸
STRK/USDT – The 0.153–0.133 Zone Will Decide the Next Trend?STRK/USDT is entering one of the rarest market phases: a combination of a major trendline breakout, a clean retest into a historical accumulation zone, and a perfect alignment with the 0.5–0.618 Fibonacci retracement levels.
This trio of signals often appears at the early stage of a major trend reversal.
The 0.153–0.133 zone (yellow block) is not just a support area. It is a high-value demand zone that has consistently absorbed selling pressure for months, and now acts as the critical pivot that will decide STRK’s mid-term direction.
Following the successful breakout above the long-term descending trendline, the price is now retesting the same accumulation area. This is the classic pattern often seen before a major expansion move:
Breakout → Retest → Expansion.
If the retest holds, this area could serve as the launchpad for STRK’s next major leg upward.
---
Bullish Scenario (Primary – High Probability)
1. Price holds the 0.153–0.133 support block and forms a clear bullish rejection candle.
2. Additional confirmation: a 3D or daily close above the first resistance at 0.195.
Once confirmed, STRK opens room toward the following upside targets:
TP1: 0.195 (first resistance and structural pivot)
TP2: 0.355 (major supply zone + measured-move target)
TP3: 0.520 (continuation-level target if momentum expands)
If the full breakout & retest pattern plays out, STRK may enter a mid-term trend reversal from bearish to bullish.
---
Bearish Scenario (Invalidation Criteria)
The bearish case activates only if:
Price closes decisively below 0.133, breaking the entire accumulation block and invalidating the retest structure.
If this breakdown occurs:
Market structure shifts back into bearish continuation.
Downside targets would shift toward:
0.10 – 0.09
Extended support: 0.07 – 0.05 if momentum accelerates
The 0.153–0.133 zone is therefore the key invalidation area for bullish traders.
---
Pattern & Market Structure Overview
Long-term trendline breakout shows a shift in sentiment.
Perfect retest into demand signals strong buyer presence.
0.5–0.618 Fibonacci alignment provides technical confluence for a potential reversal.
Range contraction inside the yellow block indicates a buildup before a large move.
This combination makes STRK one of the more technically compelling setups on the mid-term chart.
---
Trading Conclusion
As long as price holds the 0.153–0.133 accumulation block:
STRK remains in a high-probability reversal phase with upside potential toward 0.195 → 0.355 → 0.520.
A close below 0.133 invalidates the bullish structure and opens the door for deeper downside targets.
The yellow zone remains the decisive level that will define STRK’s next trend.
---
#STRK #STRKUSDT #CryptoAnalysis #Altcoins #BreakoutRetest #MarketStructure #DemandZone #TrendReversal #TechnicalAnalysis

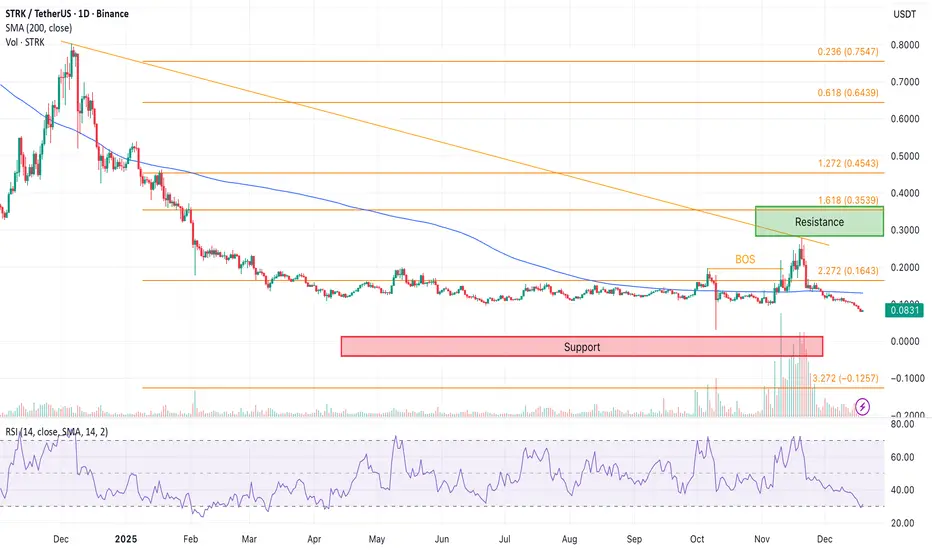
STRK Update🚨📊 STRK Update
STRK is testing the red resistance zone 🔴.
If price breaks out above this level,
the first target will be the green line level 🟢.
But be careful — at the same time,
the chart is showing signs of a possible head and shoulders formation,
which can signal weakness if the breakout fails.
Stay alert and watch how price reacts at this key zone.

$STRK Multi-Week BreakoutBINANCE:STRKUSDT | 3D
(Starknet) has been one of the stronger performers in the market, showing a clear revival as it attempts to break out of its multi-week consolidation.
On the 3-day chart, price is now hovering above the $0.20 zone. As long as it holds this premium area of the range, bulls remain firmly in control.
If this level continues to act as support, STRK has a strong chance of making a move toward the $0.30–$0.40 region — the next major resistance, aligned with the diagonal trendline.
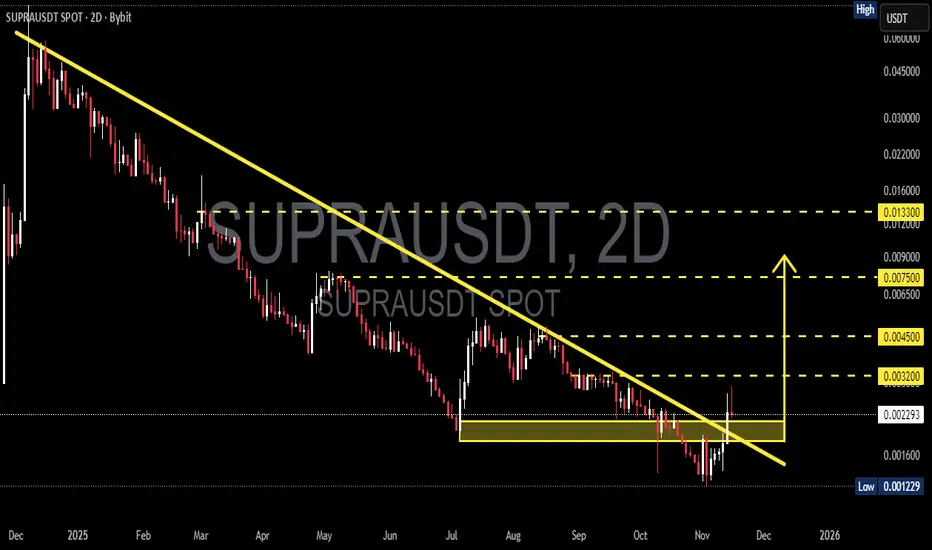
SUPRA/USDT — Trendline Breakout at Critical: Is Major Reversal?SUPRA has spent nearly a full year trapped under a relentless descending trendline—each rally attempt crushed, each bounce rejected. But for the first time since early 2025, the 2-day candle has broken above the dominant descending trendline, signaling a potential structural shift in market momentum.
This breakout occurred precisely after SUPRA revisited the major demand block at 0.00215–0.00180, a region that has repeatedly acted as the survival zone for this asset. The reaction from this area suggests renewed accumulation and a clear transfer of strength from sellers back to buyers.
SUPRA is now entering the most critical stage of its 2025 chart structure:
Is this a genuine trend reversal—or just another liquidity trap disguised as a breakout?
---
PATTERN STRUCTURE: “Descending Trendline Break + Demand Zone Rejection”
This combination is historically one of the strongest reversal structures, especially after prolonged downtrends.
1. Descending Trendline Breakout
The yellow trendline has suppressed price since early 2025.
The 2D breakout is a strong early reversal signal.
However, the wick on the breakout candle shows that sellers aren’t fully gone—momentum still needs confirmation.
2. Strong Demand Block (0.00215–0.00180)
This yellow box represents
high-volume reaccumulation,
liquidity sweeps,
structural support
that has repeatedly reset the market’s short-term direction.
3. Mid-Term Market Structure Shift (MSS)
A breakout + higher low formation near demand suggests the foundation of a larger bullish transition.
---
Bullish Scenario: “The Ingredients of a Full Trend Reversal”
SUPRA may be forming the early stages of a multi-week bullish reversal if the following conditions are respected:
1. Holding Above 0.00215
This is the line between “breakout confirmed” and “breakout failed.”
2. Successful Retest of Trendline or Demand Zone
A clean rejection wick from this zone would signal buyers stepping in aggressively.
3. Bullish Targets Based on Chart Structure
If the breakout is real, SUPRA has a clear ladder of upside targets:
Target Description
0.00320 First resistance / short-term reaction zone
0.00450 Major historical supply area
0.00750 Mid-range structural resistance
0.01330 Full trend reversal target
Bullish Narrative
A stable 2D close above 0.00230–0.00250 would mark the beginning of a mid-term trend reversal, opening the path toward multi-target rallies.
---
Bearish Scenario: “False Breakout Liquidity Trap”
Despite the breakout, danger remains:
1. Closing Below 0.00215
This would signal weakness and invalidate early bullish momentum.
2. Closing Below 0.00180 (Major Breakdown)
If the candle closes below the lower demand boundary, SUPRA risks sliding toward:
0.00123 (the next major low on the chart)
or even forming new lower lows
Bearish Narrative
If sellers reclaim the demand zone, the reversal collapses and the long-term downtrend resumes.
---
Summary
SUPRA is at one of its most defining technical moments of 2025.
The trendline breakout is only the first chapter of this story—the real decision will be made at the 0.00215–0.00200 retest.
If the zone holds, SUPRA isn’t just escaping a downtrend—it may be entering a full multi-week reversal phase aimed at 0.00320 → 0.00450 → 0.00750 and beyond.
But if it closes below 0.00180, the entire bullish structure erases and the downtrend resumes.
---
#SUPRA #SUPRAUSDT #CryptoAnalysis #Breakout #TrendlineBreak #Altcoin #MarketStructure #DemandZone #ReversalSetup
STRK Is Quietly Building a Monster Wyckoff Setup…TRK is doing EXACT Wyckoff… and nobody is paying attention.
This is the setup smart money dreams of:
Selling climax? ✔️
Secondary test? ✔️
Spring? ✔️
Back into range + breakout attempt? ✔️
This is textbook Wyckoff Accumulation — the kind you screenshot and show your kids in 10 years.
Most people won’t notice this pattern until it’s already +200% higher.
You’re seeing it early.
If Wyckoff plays out:
📌 0.22 → 0.45 → 0.70
That’s the roadmap.
Not financial advice — just reading the tape the way the composite operator intended.
Bookmark this. Save the chart.
Watch it unfold.
NASDAQ:STRK #Wyckoff #CryptoTrading #Accumulation #SpecVibe
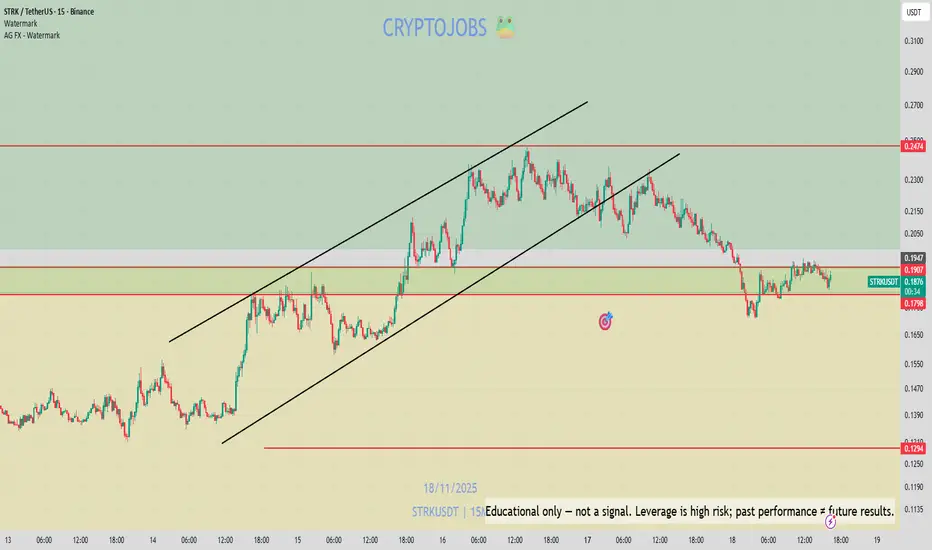
STRKUSDT.P - November 15, 2025STRKUSDT.P is consolidating below a key 0.1840–0.1860 resistance zone, with price showing hesitation and potential for either a breakout toward the 0.1980 profit level or a breakdown toward the 0.1388 support zone.
A decisive close above 0.1860 would confirm bullish continuation, while failure to hold the 0.1650 support trigger could open a sharper move toward 0.1400.
Risk Assessment: Moderate — Structure shows balanced risk with clear breakout and breakdown triggers; traders may consider adjusting stops near 0.1760 once price tests the upper resistance to reduce exposure.

STRK Update📊 STRK Update
STRK is testing the red resistance zone 🔴.
To continue the uptrend, price needs a clear breakout above this level.
Until that happens, this resistance remains the key barrier
holding back the next move up.

Breaking: Starknet ($STRK) Spike 24% Today Set for 70% Surge The price of the altcoin- Starknet ( NASDAQ:STRK ) saw a noteworthy uptick of 24% today breaking out of a falling wedge albeit the market was bearish with CRYPTOCAP:BTC dipping to the $90k zone.
NASDAQ:STRK has already broken the ceiling of the flag eyeing a move to the $1.5- $2 resistance should more buyers step in.
With the RSI at 61, NASDAQ:STRK is able to pull the 70% move. And its not only the charts. As per data from Defilama, Starknet has a total of $880.91M locked in TVL. This number shows a growing interest in the altchain.
About Starknet
Starknet is a Layer 2 blockchain solution built on Ethereum that aims to make transactions faster and cheaper while maintaining security.
It uses advanced math called STARK proofs to verify transactions efficiently.
Think of it like an express lane built on top of Ethereum's highway, helping more people use blockchain applications without the usual high costs and slow speeds.
Starknet Price Live Data
The Starknet price today is $0.170954 USD with a 24-hour trading volume of $402,680,683 USD. Starknet is up 18.91% in the last 24 hours. The current CoinMarketCap ranking is #78, with a live market cap of $779,552,068 USD. It has a circulating supply of 4,560,020,668 STRK coins and a max. supply of 10,000,000,000 STRK coins.
STRK/USDT – Position accumulation in a descending channel.StarkNet - is a permissionless decentralized Validity-Rollup (also known as a “ZK-Rollup”). It operates as an L2 network over Ethereum, enabling any dApp to achieve unlimited scale for its computation – without compromising Ethereum’s composability and security, thanks to StarkNet’s reliance on the safest and most scalable cryptographic proof system – STARK.
StarkNet Contracts and the StarkNet OS are written in Cairo – supporting the deployment and scaling of any use case, whatever the business logic.
CoinMarketCap : #106
Twitter(X) : 346,4k
Currently, STRK is trading within a large descending channel , with the price sitting at the support of the inner channel . After the hype, the price has dropped by -95% ! The Series B & C Round zones are being tested. A -30% drop to the support of the outer channel is not ruled out.
STRK will likely move only when ETH starts growing , as it is an L2 solution.
During the listing phase , this coin was heavily hyped— bloggers were screaming to buy before it "took off" , but they forgot to mention that the rocket was headed downward . Most of them had no real idea what they were doing—it was all just for hype and content .
Now, few still believe in its potential … faith is gone .
But this is exactly why fear is unnecessary . Historically, negative zones often provide some of the best entry points.
I expect STRK to outperform ETH in profitability due to its low liquidity.
I’ve marked everything on the chart—consider this in your trading strategy.

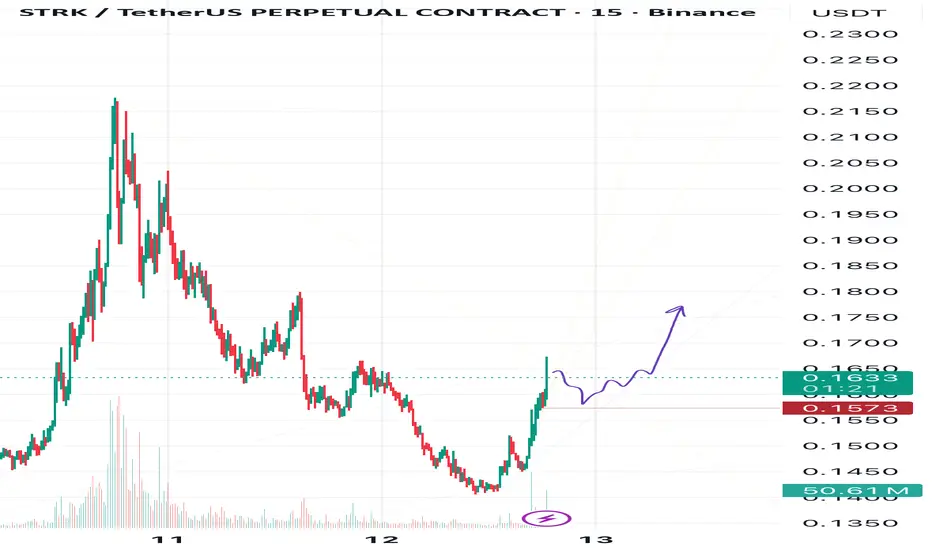
STRK About to Spark🧨STRK looks like it’s getting ready to take off.
🐂If the bullish pressure continues, we could see a strong move to the upside.
However, as always, I’ll stay cautious and watch how the price reacts near key resistance zones.
Targets:
🎯1 0.17,
🎯2— 0.176,
🎯3 — 0.182,
🚀and my global target remains at 0.20.
❌The invalidation zone for this plan is set at 0.1573.
⚠️This is not financial advice — just my personal view on the chart.
Trade safe, manage your risk, and stay tuned for what’s next! 🚀
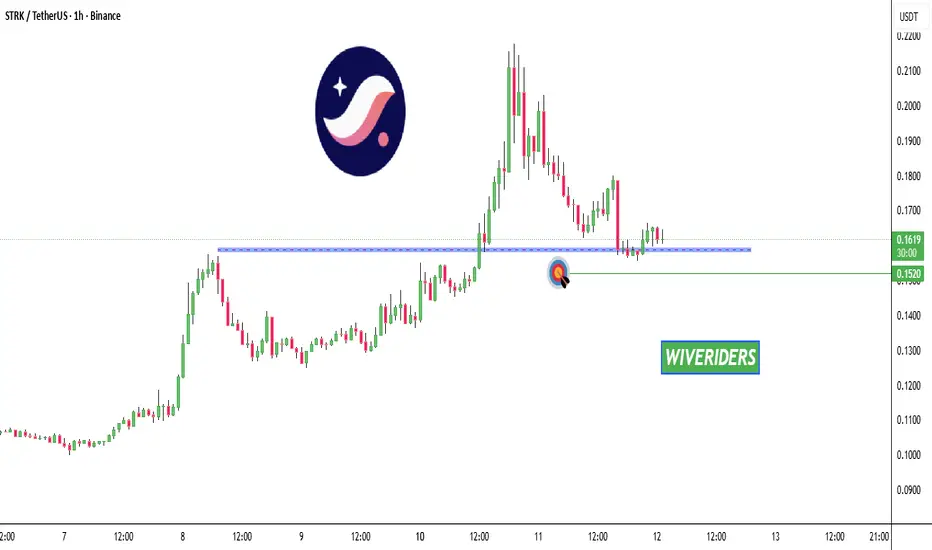
$STRK Update📊 NASDAQ:STRK Update
NASDAQ:STRK is testing the blue support level 🔵
If it breaks below, it could confirm a bearish setup 📉
The first short target would be the green line level 🟢
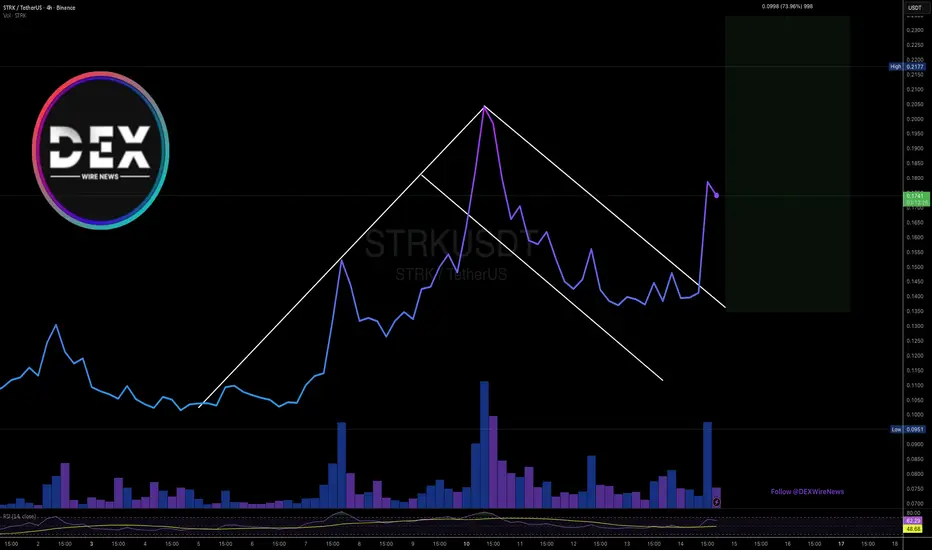
STRK/USDT — The Calm Before the Storm: Trendline Decision Zone?For months, STRK has been trapped under a relentless downtrend, unable to escape the grip of the descending yellow line — a historical resistance wall that has rejected every rally attempt.
But this time feels different.
Price is once again testing the major descending trendline near the $0.18–$0.20 zone, showing early signs of momentum.
The question is — is this just another fake pump before another leg down… or the beginning of a major reversal?
---
🔶 Market Structure & Pattern
The 3D chart clearly shows a classic downtrend exhaustion structure — a steep drop, followed by a long sideways base, and now a retest of the main trendline.
This setup resembles the early stage of a Falling Wedge Breakout or a Descending Channel Reversal, both of which often precede major bullish reversals when confirmed by strong volume.
---
🟢 Bullish Scenario — The Breakout We’ve Been Waiting For
If STRK manages to close a 3D candle above the trendline and $0.20, a strong bullish breakout could be underway.
Volume confirmation will be crucial — the stronger the breakout volume, the more reliable the rally potential.
Possible upside targets:
Target 1: $0.34 → First key resistance retest
Target 2: $0.515 → Mid-range breakout confirmation
Target 3: $0.775 – $1.35 → Full trend reversal zone if momentum extends
Once the breakout is validated and the retest holds, STRK could finally escape its accumulation zone and enter a new expansion phase.
---
🔴 Bearish Scenario — Another Rejection Ahead
However, if the yellow line once again acts as a brick wall, a sharp rejection could occur.
Failure to break through might drag the price back into its lower range:
Main support: $0.12 → $0.09
Extreme low: $0.065
A strong rejection from this zone often triggers a final capitulation wave before a true reversal emerges.
Until a confirmed breakout happens, traders should remain cautious — false signals are common at this stage.
---
⚙️ Breakout Confirmation Checklist
✅ 3D candle close above $0.20
✅ Volume spike confirming momentum
✅ Trendline flips into new support on retest
✅ Bullish divergence on RSI or MACD
✅ BTC and overall market sentiment supportive
Without these confirmations, the breakout is likely to fail.
But if all align — STRK could become one of the next altcoins to awaken from the bottom.
---
💡 Trading Insight
> “The darkest point of a chart often comes right before the dawn.”
STRK now stands at a crossroad between breakdown and breakout — where patience and precision will define the winners.
Strategy notes:
Enter after confirmation, not anticipation.
Set tight stop-loss below swing lows.
Take profit in stages at key resistance levels.
Manage risk strictly — the setup is promising but not risk-free.
---
🔖 Summary
STRK is approaching a historic decision zone.
A confirmed breakout above the long-term trendline could mark the first real shift in trend direction after months of accumulation.
Failure to do so, however, may lead to another dip before the real breakout later.
Either way — this is a key inflection point worth watching closely.
---
#STRK #STRKUSDT #Crypto #Breakout #TechnicalAnalysis #PriceAction #CryptoSignals #AltcoinWatch #TrendlineBreak #MarketAnalysis #CryptoTrading #ChartSetup #ReversalPattern #SmartMoney

$STRK Update📊 NASDAQ:STRK Update
NASDAQ:STRK is testing the red resistance zone 🔴
If it breaks out above, it could confirm a bullish setup 📈
The first target would be the green line level 🟢
