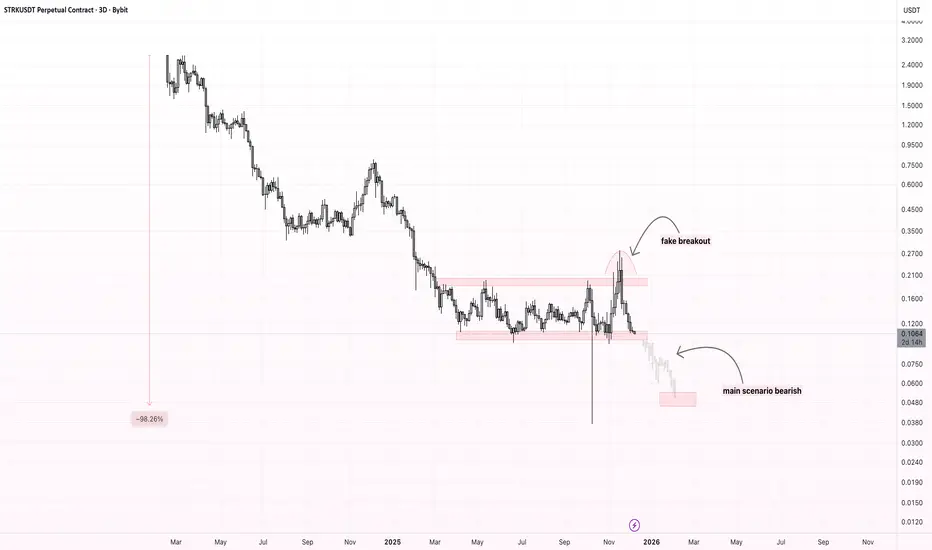
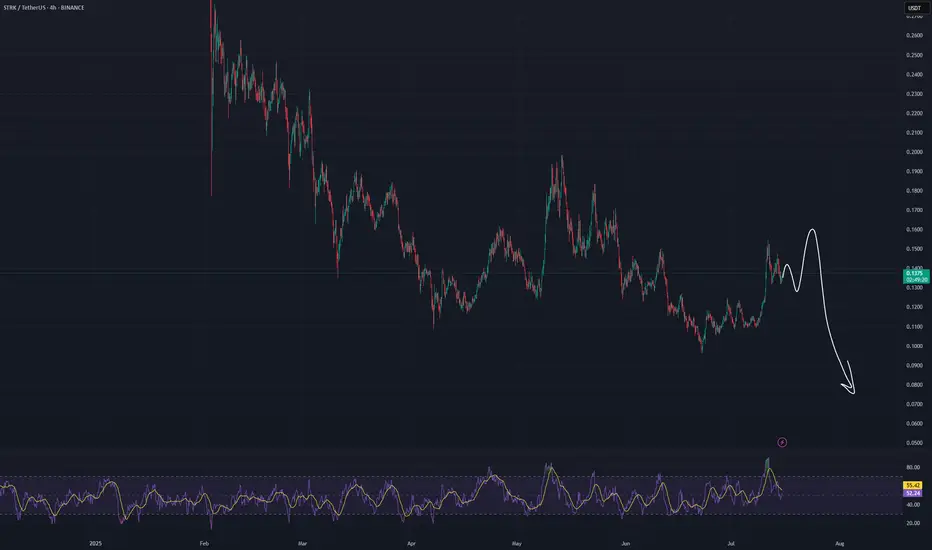
STRK – Horizontal Accumulation, Fake Breakout & Bearish OutlookPrice has spent a long time moving inside a horizontal accumulation range. Recently, the market attempted a breakout to the upside, but the move failed and quickly returned back inside the range — a classic fake breakout / deviation above resistance.
The failed breakout shifts the market structure toward weakness. As long as price stays below the upper boundary of the range, the main scenario remains bearish.
I expect continuation to the downside, with the next liquidity zones and potential targets located in the $0.055–$0.045 area.
A reclaim of the range high would invalidate the idea, but for now momentum favors sellers.
Strkanalysis
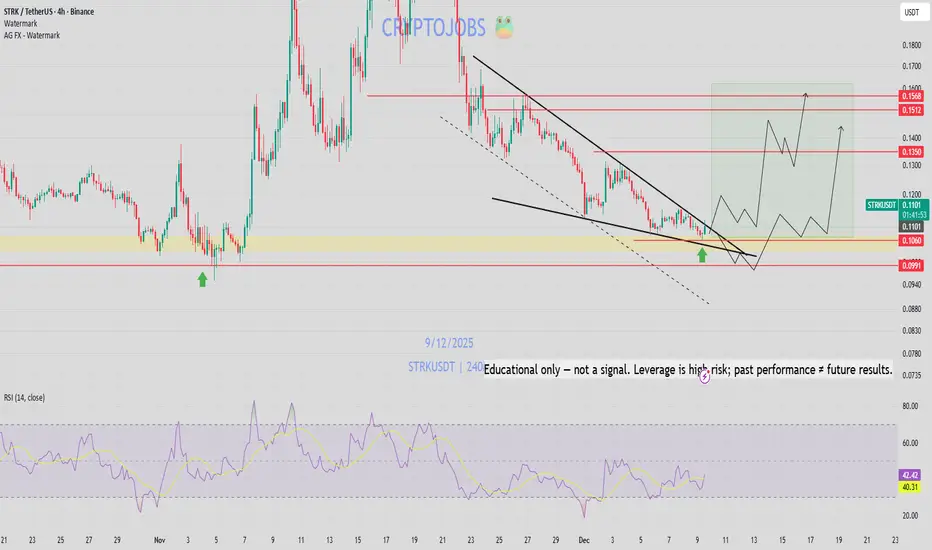
STRK - bull div RSI! NASDAQ:STRK price remains sitting on a key weekly demand zone 📊
Looking at the H4 chart, I see a falling wedge (reversal structure) and bullish RSI divergence 📈
I wouldn't be surprised to see another bull wave from the 0.1050− 0.1100 level!
Invalidation: ⚠️
Things turn bearish if we get a weekly candle close under $0.1000, but for now this is a very interesting accumulation zone for long-term holders 💎
My potential targets for a SWING play:
🎯 $ 0.1200
🎯 $ 0.1280
🎯 $ 0.1350
🎯 $ 0.1500
Not financial advice - DYOR & manage your risk accordingly.
STRK Analysis (4H)STRK is one of the coins that has performed well during the bear market, but after a bearish CH it has entered a downward phase.
Opening a short position at these levels is meaningless. We should wait for a proper liquidity pool to be collected and for the price to retrace upward, then enter a position at optimal levels.
The optimal zone for entering a position is the LP area. If the price reaches this zone, we expect it to be rejected toward the TP levels.
Do not enter the position without capital management and stop setting
Comment if you have any questions
thank you

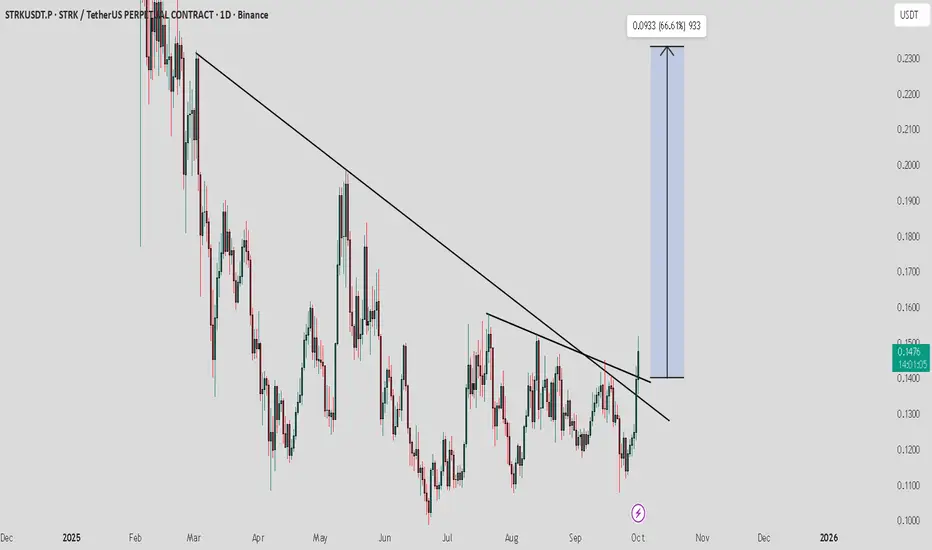
STRKUSDT - The real STAR!Let me introduce you to the new rising star that’s about to steal the spotlight: STRK.
The coin has been pumping like crazy for the past few days, but once you zoom out and check the chart, you’ll see that this is just the beginning — a clean breakout from a 258-day accumulation range.
Not only that, but it also broke the long-term descending trendline (from day one of the project) and successfully retested it.
I’m not exaggerating when I say the minimum target lies around the 0.618 Fibonacci level,
which is roughly a 3× move from the current price.
Best Regards:
Ceciliones🎯

$STRK price — Testing the end of a long-term downtrendAfter months of pressure since early 2024, #STRK is attempting a breakout.
The next two daily candle closes for OKX:STRKUSDT will be crucial for confirming direction.
Above $0.17 — potential confirmation of reversal and continuation higher.
Below $0.17 — likely a stop-loss hunt before retesting support near $0.07.
The market structure still looks fragile, so confirmation is key before entering long positions.
💭 Could this finally be the turning point for #Starknet , or another trap for hopeful buyers?
______________
◆ Follow us ❤️ for daily crypto insights & updates!
🚀 Don’t miss out on important market mov es
🧠 DYOR | This is not financial advice, just thinking out loud.

STRK/USDT – The 0.153–0.133 Zone Will Decide the Next Trend?STRK/USDT is entering one of the rarest market phases: a combination of a major trendline breakout, a clean retest into a historical accumulation zone, and a perfect alignment with the 0.5–0.618 Fibonacci retracement levels.
This trio of signals often appears at the early stage of a major trend reversal.
The 0.153–0.133 zone (yellow block) is not just a support area. It is a high-value demand zone that has consistently absorbed selling pressure for months, and now acts as the critical pivot that will decide STRK’s mid-term direction.
Following the successful breakout above the long-term descending trendline, the price is now retesting the same accumulation area. This is the classic pattern often seen before a major expansion move:
Breakout → Retest → Expansion.
If the retest holds, this area could serve as the launchpad for STRK’s next major leg upward.
---
Bullish Scenario (Primary – High Probability)
1. Price holds the 0.153–0.133 support block and forms a clear bullish rejection candle.
2. Additional confirmation: a 3D or daily close above the first resistance at 0.195.
Once confirmed, STRK opens room toward the following upside targets:
TP1: 0.195 (first resistance and structural pivot)
TP2: 0.355 (major supply zone + measured-move target)
TP3: 0.520 (continuation-level target if momentum expands)
If the full breakout & retest pattern plays out, STRK may enter a mid-term trend reversal from bearish to bullish.
---
Bearish Scenario (Invalidation Criteria)
The bearish case activates only if:
Price closes decisively below 0.133, breaking the entire accumulation block and invalidating the retest structure.
If this breakdown occurs:
Market structure shifts back into bearish continuation.
Downside targets would shift toward:
0.10 – 0.09
Extended support: 0.07 – 0.05 if momentum accelerates
The 0.153–0.133 zone is therefore the key invalidation area for bullish traders.
---
Pattern & Market Structure Overview
Long-term trendline breakout shows a shift in sentiment.
Perfect retest into demand signals strong buyer presence.
0.5–0.618 Fibonacci alignment provides technical confluence for a potential reversal.
Range contraction inside the yellow block indicates a buildup before a large move.
This combination makes STRK one of the more technically compelling setups on the mid-term chart.
---
Trading Conclusion
As long as price holds the 0.153–0.133 accumulation block:
STRK remains in a high-probability reversal phase with upside potential toward 0.195 → 0.355 → 0.520.
A close below 0.133 invalidates the bullish structure and opens the door for deeper downside targets.
The yellow zone remains the decisive level that will define STRK’s next trend.
---
#STRK #STRKUSDT #CryptoAnalysis #Altcoins #BreakoutRetest #MarketStructure #DemandZone #TrendReversal #TechnicalAnalysis

STRK Finally Escapes the RangeNASDAQ:STRK has finally broken out of its long consolidation zone and pushed above the descending trendline—something the chart hasn’t managed to do for months. This breakout shows a clear shift in momentum, with buyers stepping in strongly.
As long as price holds above this zone, STRK could be gearing up for a continuation move to the upside. The structure looks healthier now, and the breakout suggests the trend may be turning in favor of the bulls.
DYOR, NFA
Please hit the like button if you like it, and share your views in the comments section.

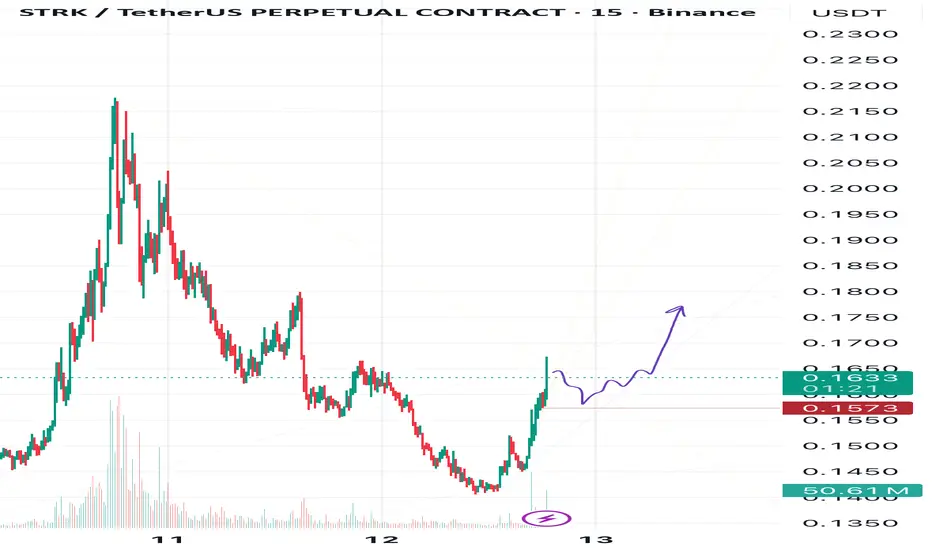
STRK About to Spark🧨STRK looks like it’s getting ready to take off.
🐂If the bullish pressure continues, we could see a strong move to the upside.
However, as always, I’ll stay cautious and watch how the price reacts near key resistance zones.
Targets:
🎯1 0.17,
🎯2— 0.176,
🎯3 — 0.182,
🚀and my global target remains at 0.20.
❌The invalidation zone for this plan is set at 0.1573.
⚠️This is not financial advice — just my personal view on the chart.
Trade safe, manage your risk, and stay tuned for what’s next! 🚀
STRK/USDT — The Calm Before the Storm: Trendline Decision Zone?For months, STRK has been trapped under a relentless downtrend, unable to escape the grip of the descending yellow line — a historical resistance wall that has rejected every rally attempt.
But this time feels different.
Price is once again testing the major descending trendline near the $0.18–$0.20 zone, showing early signs of momentum.
The question is — is this just another fake pump before another leg down… or the beginning of a major reversal?
---
🔶 Market Structure & Pattern
The 3D chart clearly shows a classic downtrend exhaustion structure — a steep drop, followed by a long sideways base, and now a retest of the main trendline.
This setup resembles the early stage of a Falling Wedge Breakout or a Descending Channel Reversal, both of which often precede major bullish reversals when confirmed by strong volume.
---
🟢 Bullish Scenario — The Breakout We’ve Been Waiting For
If STRK manages to close a 3D candle above the trendline and $0.20, a strong bullish breakout could be underway.
Volume confirmation will be crucial — the stronger the breakout volume, the more reliable the rally potential.
Possible upside targets:
Target 1: $0.34 → First key resistance retest
Target 2: $0.515 → Mid-range breakout confirmation
Target 3: $0.775 – $1.35 → Full trend reversal zone if momentum extends
Once the breakout is validated and the retest holds, STRK could finally escape its accumulation zone and enter a new expansion phase.
---
🔴 Bearish Scenario — Another Rejection Ahead
However, if the yellow line once again acts as a brick wall, a sharp rejection could occur.
Failure to break through might drag the price back into its lower range:
Main support: $0.12 → $0.09
Extreme low: $0.065
A strong rejection from this zone often triggers a final capitulation wave before a true reversal emerges.
Until a confirmed breakout happens, traders should remain cautious — false signals are common at this stage.
---
⚙️ Breakout Confirmation Checklist
✅ 3D candle close above $0.20
✅ Volume spike confirming momentum
✅ Trendline flips into new support on retest
✅ Bullish divergence on RSI or MACD
✅ BTC and overall market sentiment supportive
Without these confirmations, the breakout is likely to fail.
But if all align — STRK could become one of the next altcoins to awaken from the bottom.
---
💡 Trading Insight
> “The darkest point of a chart often comes right before the dawn.”
STRK now stands at a crossroad between breakdown and breakout — where patience and precision will define the winners.
Strategy notes:
Enter after confirmation, not anticipation.
Set tight stop-loss below swing lows.
Take profit in stages at key resistance levels.
Manage risk strictly — the setup is promising but not risk-free.
---
🔖 Summary
STRK is approaching a historic decision zone.
A confirmed breakout above the long-term trendline could mark the first real shift in trend direction after months of accumulation.
Failure to do so, however, may lead to another dip before the real breakout later.
Either way — this is a key inflection point worth watching closely.
---
#STRK #STRKUSDT #Crypto #Breakout #TechnicalAnalysis #PriceAction #CryptoSignals #AltcoinWatch #TrendlineBreak #MarketAnalysis #CryptoTrading #ChartSetup #ReversalPattern #SmartMoney

STRKUSDT — Critical Accumulation Zone Between $0.125–$0.11!
The Starknet/USDT (STRKUSDT) pair is currently moving in a mid-term consolidation phase after a prolonged downtrend since early 2025.
The chart shows a major support area (yellow block) between $0.125–$0.11, which has acted as a strong accumulation and reaction zone multiple times.
---
Structure and Price Pattern
Main trend: Still in a macro downtrend, but price action has shifted into a sideways accumulation range.
Yellow block ($0.125–$0.11): A strong horizontal support zone where buyers have repeatedly defended price — this is the key decision area.
Key resistance levels:
R1: $0.1514
R2: $0.1918
R3: $0.3455
Deep lower wick indicates liquidity sweep (stop-hunt), often appearing before a potential reversal.
Overall structure: A wide range-bound formation between $0.11 and $0.1918, showing accumulation and indecision between bulls and bears.
---
Bullish Scenario
1. Confirmation: A 2D candle closes above $0.1514, signaling renewed bullish momentum.
2. Upside targets:
Target 1: $0.1918
Target 2: $0.3455 (if momentum continues)
3. Ideal entry: Buy within the yellow block ($0.115–$0.125) upon strong bounce confirmation with volume.
4. Stop-loss: Below $0.11 (bottom of the accumulation zone).
5. Additional confirmation: A successful retest of $0.1514 as support would strengthen the bullish case.
---
Bearish Scenario
1. Confirmation: A clean 2D candle close below $0.11, confirming a breakdown from the key support.
2. Downside targets:
Target 1: $0.085
Target 2: $0.071 (if selling pressure intensifies)
3. Short entry: After breakdown and failed retest of $0.11 from below.
4. Stop-loss: Above $0.125–$0.13, depending on volatility.
5. Note: Beware of liquidity wicks below $0.11 — always wait for a confirmed close, not just a temporary dip.
---
Pattern Summary
The price is consolidating inside a major accumulation zone ($0.125–$0.11) where buyers and sellers are in balance.
As long as the price holds above $0.11, the market retains rebound potential.
A breakout above $0.1514 opens room toward $0.1918.
A breakdown below $0.11 resumes the downtrend toward $0.085–$0.071.
This remains a critical decision zone that will define Starknet’s next significant move.
#STRKUSDT #Starknet #CryptoAnalysis #SupportResistance #AccumulationZone #BreakoutSetup #CryptoTrading #AltcoinAnalysis #TechnicalAnalysis

STRK (SPOT)BINANCE:STRKUSDT
#STRK/ USDT
Entry range (0.1450 - 0.1630)
SL 1D close below 0.1400
T1 0.2100
T2 0.2500
T3 0.3200
T4 0.5000
Extra Target is optional 0.6000
_______________________________________________________
Golden Advices.
********************
* collect the coin slowly in the entry range.
* Please calculate your losses before the entry.
* Do not enter any trade you find it not suitable for you.
* No FOMO - No Rush , it is a long journey.

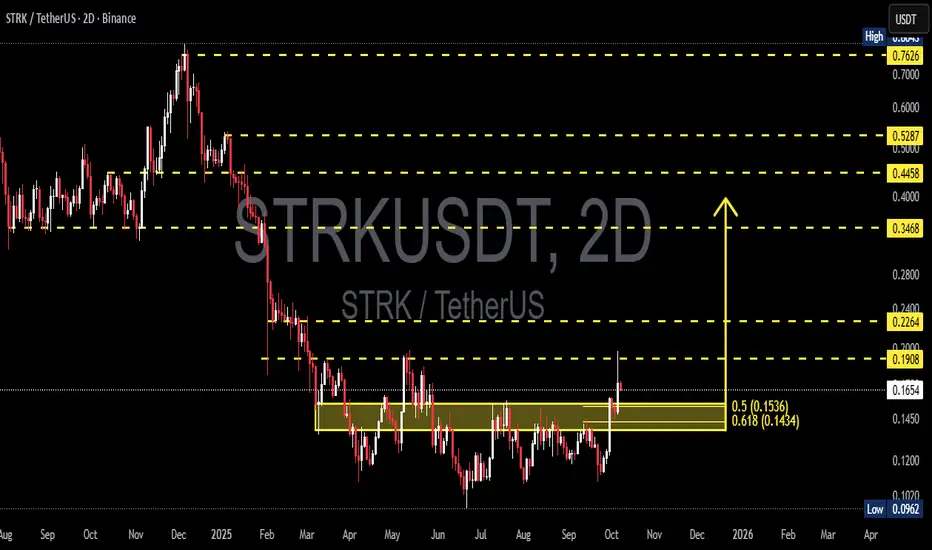
STRKUSDT — Final Retest Before Liftoff or a False Breakout Trap?After months of sideways movement, STRK is finally showing signs of life. On the 2D timeframe, price action is shaping a classic breakout–retest structure, with a strong demand zone between 0.1434–0.1536, aligning perfectly with the Fibonacci golden pocket (0.5–0.618).
The story here is simple yet crucial:
After a prolonged consolidation, price broke above the lower range and is now retesting the accumulation zone, testing whether buyers have the strength to confirm the breakout — or if this was just another false rally.
---
🔹 Structure & Technical Outlook
Multi-Month Accumulation: STRK has been trapped in a sideways base since early 2025 — a clear sign of distribution exhaustion and accumulation by stronger hands.
Initial Breakout: Price recently broke above the consolidation zone near 0.16–0.17, reaching the first resistance at 0.1908.
Retest in Progress: The current pullback toward 0.1434–0.1536 is the critical retest zone that will decide the next macro move.
---
🟩 Bullish Scenario — “Retest to Launch”
If the demand zone holds:
Buyers could regain control with a confirmed close above 0.1908.
Upside targets are 0.2264 → 0.3468 → 0.4458 → 0.5287, with potential expansion toward 0.7626 if the broader altcoin market turns risk-on.
Structure could evolve into a re-accumulation base, often the precursor to impulsive rallies following long consolidation periods.
Main bullish confirmation:
A daily or 2D close above 0.1908 with solid volume confirmation.
---
🟥 Bearish Scenario — “False Breakout Trap”
If the retest fails to hold:
A daily close below 0.1434 (the 0.618 fib) will confirm a failed breakout, signaling renewed selling pressure.
Downside targets: 0.12–0.13 as intermediate support, and 0.0962 as the final demand zone.
This would send STRK back into its previous descending range, negating the breakout structure.
---
⚙️ Trading Plan & Strategy
Aggressive Entry: Buy around 0.148–0.155, stop-loss below 0.143, targeting 0.2264+ (high R:R setup).
Conservative Entry: Wait for breakout confirmation above 0.1908, then enter on a retest of 0.185–0.19, SL below 0.175.
Take Profit Levels: Scale out at 0.2264, 0.3468, and 0.4458 while trailing stop along higher highs.
---
🧭 Conclusion
STRK is standing at a critical decision point — this zone will determine whether the market is preparing for a macro trend reversal or setting up another fakeout.
If 0.143–0.153 holds, the market could be witnessing the foundation of a new bullish impulse after a long accumulation phase.
If not, expect renewed weakness toward 0.096 and another round of range-bound trading.
---
#STRKUSDT #STRK #CryptoBreakout #TechnicalAnalysis #CryptoTA #Fibonacci #Accumulation #Retest #BreakoutSetup #AltcoinAnalysis #SupplyDemand #CryptoMarket #SwingTrade
STRK / USDT : Showing strong moemtum for a bullish rallySTRK/USDT Analysis
STRK is showing strong momentum and has confirmed its breakout. If this move holds, a bullish rally towards $0.20 – $0.25 is likely in the short term.
Always manage risk wisely and avoid chasing entries without proper confirmation.
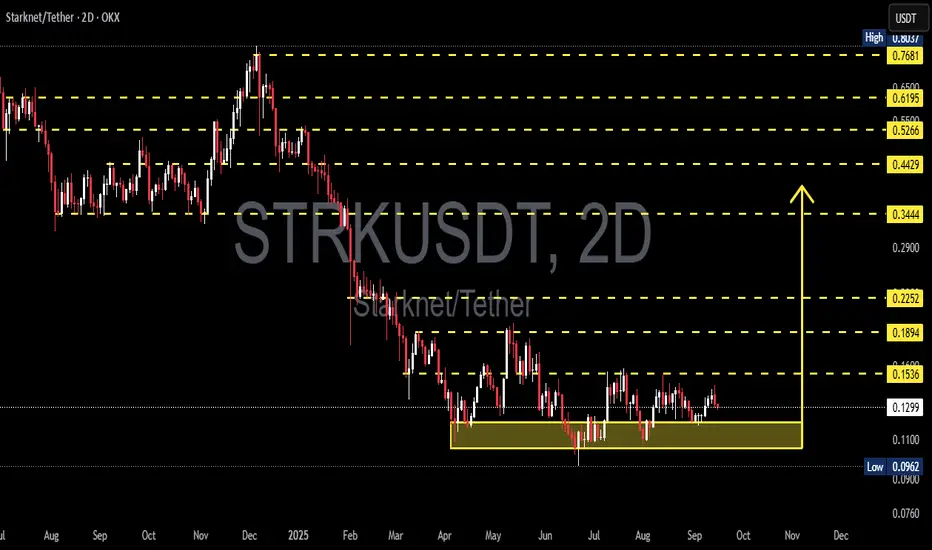
STRK/USDT — Bottom Accumulation: Beginning of a Major Reversal?
🔎 Overview
The STRK/USDT (2D) chart is showing a consolidation phase after a heavy downtrend since early 2025. Price is currently trading around 0.1299, hovering just above a key support zone at 0.096–0.11 (yellow box) which has been tested multiple times and continues to hold.
This structure resembles a rectangle accumulation pattern, often seen when buyers quietly build positions after a long selloff. If this base holds, it could mark the foundation for a mid-term reversal. If it fails, however, the broader downtrend is likely to continue.
---
📊 Key Technical Levels
Major Support:
0.1100 → upper bound of accumulation zone
0.0962 → critical low (must hold)
Key Resistances:
R1 = 0.1536 (immediate breakout trigger)
R2 = 0.1894
R3 = 0.2252
R4 = 0.3444 (potential swing target if reversal is confirmed)
---
🟢 Bullish Scenario
1. Breakout of 0.1536:
A strong 2D close above 0.1536, ideally backed by volume, would signal a bullish reversal. First target sits at 0.1894, followed by 0.2252.
2. Accumulation at Support (0.096–0.11):
Gradual accumulation near this zone offers favorable risk/reward for mid-term traders. Stop-loss should be placed just below 0.0962. If successful, upside targets range from +45% to over +150% depending on how far momentum extends.
3. Bullish Confirmation Signals:
RSI/MACD bullish divergence
Rising volume on breakout
Bullish reversal candlestick patterns at support
---
🔴 Bearish Scenario
1. Breakdown Below 0.11:
A decisive close below 0.11 — and especially below 0.0962 — would invalidate the bullish accumulation setup. This would expose STRK to further downside, potentially targeting the 0.076 zone (previous structural low).
2. False Breakout Risk:
Traders should be cautious of bull traps — where price breaks above 0.1536 but quickly falls back into the range. Such moves often occur in weak markets.
---
📐 Pattern & Market Sentiment
Pattern: Rectangle Accumulation at bottom trend
Sentiment: Neutral → turning bullish if breakout above 0.1536 is confirmed
Key Triggers:
Bullish trigger → 0.1536
Bearish trigger → 0.0962
---
⚠️ Notes
Always wait for volume confirmation on breakouts/breakdowns.
Use strict risk management and place stop-losses below/above structural levels.
Watch Bitcoin’s trend as overall market sentiment often drives altcoins.
---
🎯 Conclusion
STRK is currently sitting at a make-or-break zone. This could either be the start of a strong mid-term reversal or just a pause before further decline.
Bullish path: Break & hold above 0.1536 → targets at 0.1894 – 0.2252.
Bearish path: Break below 0.11 → retest of 0.0962 and possibly down to 0.076.
Patience and confirmation will be key.
---
#STRK #STRKUSDT #Starknet #CryptoAnalysis #CryptoTrading #PriceAction #Breakout #Accumulation #SupportResistance
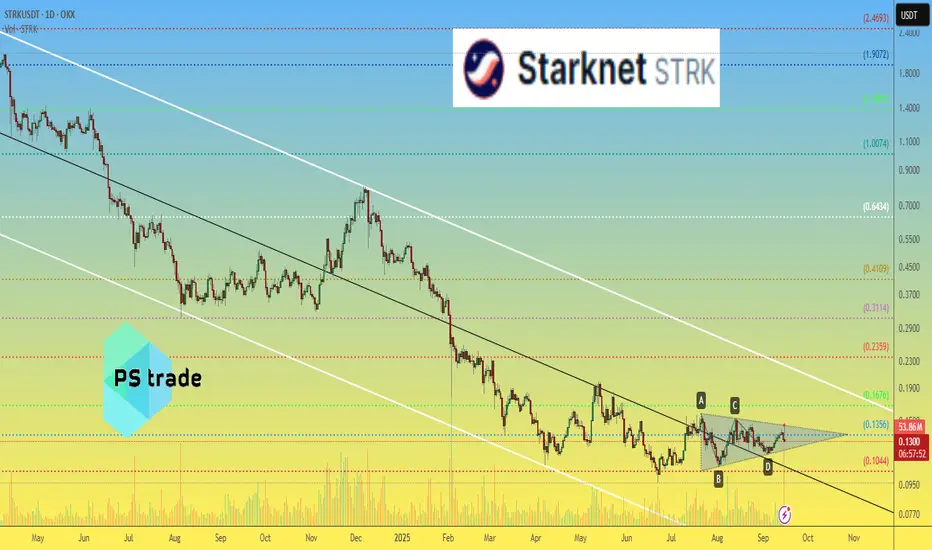
StarkNet STRK price analysisWe have to admit, the “disappointment” price of #STRK is now stuck in consolidation — but this looks like it’s heating up for a breakout 📈
Today we even saw an attempt to push higher, but it got stopped right at the upper edge of the triangle ⛔️
Let’s make it interactive: looking at this chart, what’s your scenario for OKX:STRKUSDT 👇
▫️ Drop to $0.10 ?
▫️ Pump to $0.20 ?
▫️ Or maybe even $0.40–0.50 ?
🔥 If we see good engagement around #Starknet, we’ll share our own forecast for the move of this asset… which we don’t even care about that much 😅
❓ So, which direction do you personally expect for #STRK? Comment below 👇
______________
◆ Follow us ❤️ for daily crypto insights & updates!
🚀 Don’t miss out on important market moves
🧠 DYOR | This is not financial advice, just thinking out loud.
STRK / STRKUSDTSAY Hiii...
GOOD LUCK >>>
• Warning •
Any deal I share does not mean that I am forcing you to enter into it, you enter in with your full risk, because I'll not gain any profits with you in the end.
The risk management of the position must comply with the stop loss.
(I am not sharing financial or investment advice, you should do your own research for your money.)

#STRK/USDT - SHORTI expect a decrease in the asset within a month.
(Not an investment recommendation).
STRKUSDT 1D AnalysisSTRK ~ 1D Analysis
#STRK This is the lowest support for now. Buy if you still have faith in this coin with a short term target of at least 15%+ from here.

Is Starknet STRK Really Scam? Hello, Skyrexians!
I want to make an update on BINANCE:STRKUSDT because price dropped that much recently and now everyone is telling that this coin is total scam. To be honest I have some doubts that this crypto can bring significant gains in this cycle, but solid bounce can be seen.
Here we have 4 days time frame to estimate the Elliott waves cycle correctly. We can see all 5 waves, divergence with the Awesome Oscillator, but I have the huge concern - it was the downward global impulse. What does it mean? It means that the next wave will be corrective. 0.61 Fibonacci is the max target at $1.7. This is more than 10x. I cannot believe that this coin can set ATH because I totally disappointed in it. My last purchase wave at $0.13 and average price $0.41. Now this is the worst my investment in this cycle.
Best regards,
Ivan Skyrexio
___________________________________________________________
Please, boost this article and subscribe our page if you like analysis!

STRKUSDT 1DSTRK ~ 1D Analysis
#STRK High risk trading. Buy gradually after successfully penetrating this resistant line with a short -term target of at least 10%+.

STRK ( SPOT - INVESTMENT )BINANCE:STRKUSDT
STRK / USDT
1D time frame
analysis tools
____________
SMC
FVG
Trend lines
Fibonacci
Support & resistance
MACD Cross
EMA Cross
______________________________________________________________
Golden Advices.
********************
* Please calculate your losses before any entry.
* Do not enter any trade you find it not suitable for you.
* No FOMO - No Rush , it is a long journey.
Useful Tags.
****************
My total posts
www.tradingview.com

Skyrexio | Starknet STRK Is Inside The Dead Zone AgainHello, Skyrexians!
Today we want to update our old analysis on $BINANCE:STRKUSDT. Unfortunately we were wrong about its potential growth and this crypto dived inside the dead zone again. For sure, it makes holders nervous. I (Ivan) personally have Starknet in my portfolio for 6% of deposit. This is the worst performed asset in my portfolio in this cycle. My entry point at $0.75 and it's painful now to see the price $0.38. I have not bad entry point, there are a lot of people who bought it above $1 or even $2. That's why it's important to understand is it worth to hold STRK? Any chance to revive from dead zone or not?
Let's take a look at the 3D time frame. We can see two green dots on Bullish/Bearish Reversal Bar Indicator next to the bottom. Current dot still has not been confirmed, be careful!
The fact that current signal is about to happen at the potential wave's 5 bottom gives us some confidence that reversal to the upside can come this time.
Best regards,
Skyrexio Team
___________________________________________________________
Please, boost this article and subscribe our page if you like analysis!

STRKUSDT 2DSTRK ~ 2D
#STRK So far it still continues to maintain this support block. If you still have Conviction on this coin,. Buy here with a minimum target of 20%+
