$STRK - Long term outlookNASDAQ:STRK - Long term outlook 🚨
Long-term outlook remains pretty bearish under the $0.1050 - $0.1000 monthly previous key support...📉
Levels to watch:
📍 $0.0770 - $0.0850 - $0.0920 - $0.0960
Accumulation & sideways phase possible inside yellow zone 📊
A daily candle break under $0.0770 would trigger another sell breakout! ⚠️
Not financial advice - DYOR & manage your risk accordingly.
STRKUSDT

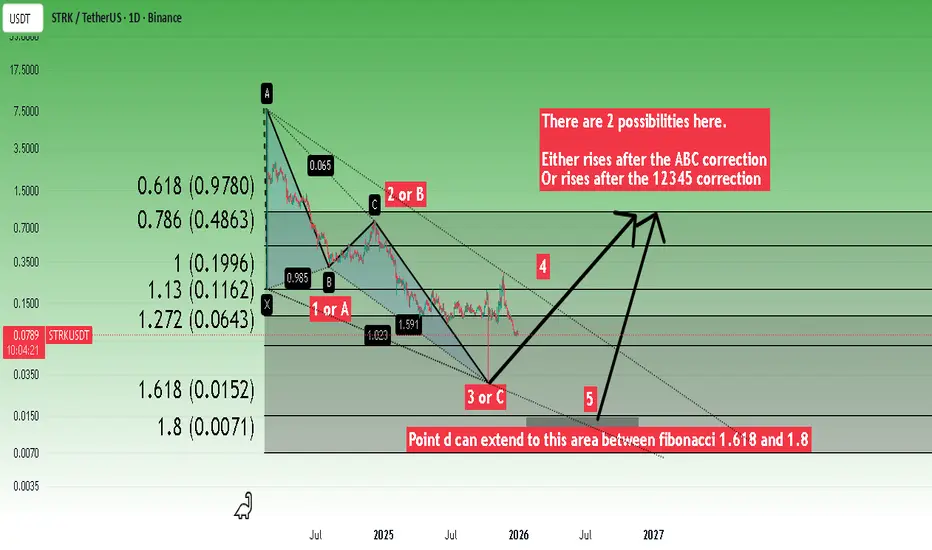
Bullish Harmonic Deep Crab PatternOne of the projects whose technology I like.
I tried to draw two possible scenarios for educational purposes.
* The purpose of my graphic drawings is purely educational.
* What i write here is not an investment advice. Please do your own research before investing in any asset.
* Never take my personal opinions as investment advice, you may lose your money.
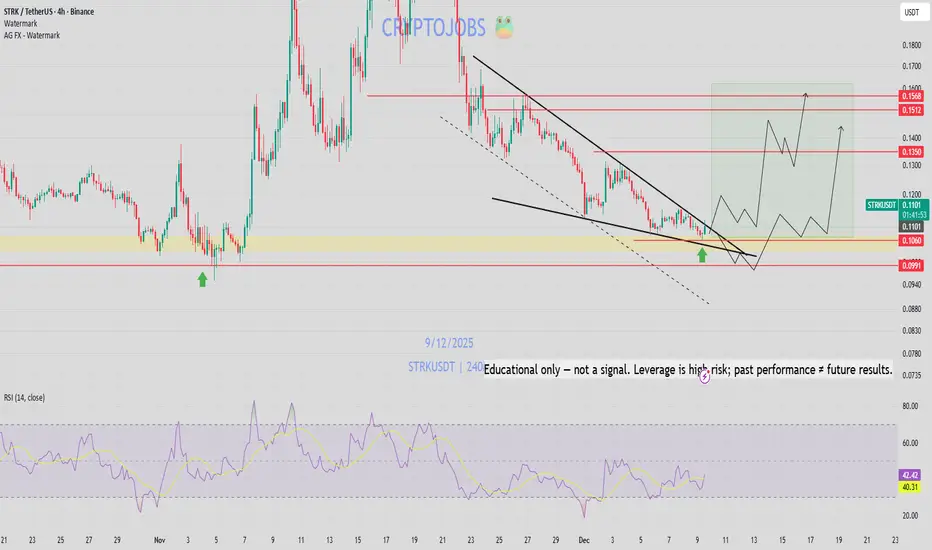
STRK Buy/Long Setup (4H)It seems we are at the end of the corrective wave C.
There are confirmations indicating a pullback to higher levels, including a bullish CH and positioning at important levels.
We have identified two entry points, where you should enter the position using DCA.
Targets are also marked on the chart.
A 4-hour candle closing below the invalidation level will invalidate this analysis.
For risk management, please don't forget stop loss and capital management
When we reach the first target, save some profit and then change the stop to entry
Comment if you have any questions
Thank You

STRK - USDT - Update:NASDAQ:STRK - Price Analysis:
Weekly candle looks pretty bad, with a large close under the $ 0.1000 monthly support! 🟥
Main trend remains pretty bearish at the moment, reflecting a lack of demand, bad tokenomics or early insider dumping 📉
No buy pressure at the moment, but if the LL holds on the weekly, we could see a bull correction to revisit the previous key support as resistance!
Keep an eye on the H1 downtrend for potential bull reversal / correction. 🟡
⚠️ Not financial advice - DYOR.
#STRK #trading

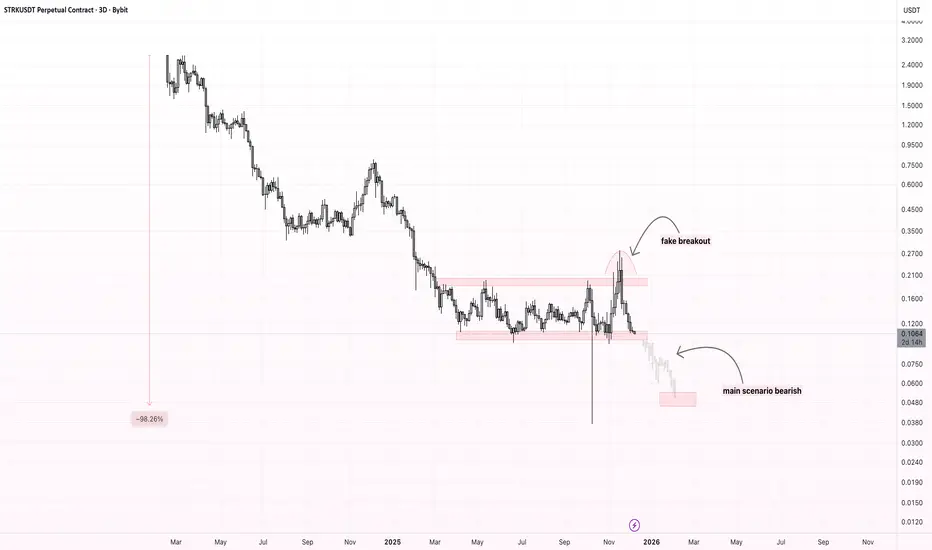
STRK – Horizontal Accumulation, Fake Breakout & Bearish OutlookPrice has spent a long time moving inside a horizontal accumulation range. Recently, the market attempted a breakout to the upside, but the move failed and quickly returned back inside the range — a classic fake breakout / deviation above resistance.
The failed breakout shifts the market structure toward weakness. As long as price stays below the upper boundary of the range, the main scenario remains bearish.
I expect continuation to the downside, with the next liquidity zones and potential targets located in the $0.055–$0.045 area.
A reclaim of the range high would invalidate the idea, but for now momentum favors sellers.
STRK - bull div RSI! NASDAQ:STRK price remains sitting on a key weekly demand zone 📊
Looking at the H4 chart, I see a falling wedge (reversal structure) and bullish RSI divergence 📈
I wouldn't be surprised to see another bull wave from the 0.1050− 0.1100 level!
Invalidation: ⚠️
Things turn bearish if we get a weekly candle close under $0.1000, but for now this is a very interesting accumulation zone for long-term holders 💎
My potential targets for a SWING play:
🎯 $ 0.1200
🎯 $ 0.1280
🎯 $ 0.1350
🎯 $ 0.1500
Not financial advice - DYOR & manage your risk accordingly.
STRKUSDT – Push Down Incoming?The entire crypto market right now = pure fear mode.
Everyone’s sweating, charts are crying, and STRK was holding on like a brave little soldier…
until today.
Now it finally said:
“Alright boys, I’m tired, I’m going down too.”
I’m expecting another push to the downside, because this whole move looks like one big emotional flashout — the kind where market makers drag us lower just to check if we still have feelings.
🔎 What to watch:
• How deep can this flush really go?
• Where’s the real liquidity?
• Will STRK bounce or commit to the full gymnastic dive?
Let’s see — volatility today is high, fear everywhere, so manage this smartly.
⸻
⚠️ Risk & money management ON
Don’t get liquidated today, please.
STRK doesn’t deserve your entire account. 😅
Good luck traders — may the flashout be gentle. 🚀💀

STRK - UPDATENASDAQ:STRK - following my lines, solid PA 📈
+110% up fvrom the 0.1300$ zone I gave you!! 🔥
0.340 - 0.350$ is gonna be see I think, momentum is strong, and rember, price is moving above the 265 days RANGE breakout!

Starknet STRK SPOT IDEAPrivacy is back at the center of the crypto narrative - everyone is pushing the topic, including Vitalik Buterin. People are simply tired of shining their addresses and balances. Against this background, interest in Starknet, which now cooperates with ZEC, has sharply increased on Twitter. 20% of the total coin supply is already in staking.
The price has consolidated above the upper limit of the accumulation range of $ 0.10-$0.16 and is gradually approaching the main resistance zone of $ 0.34-$0.52, which previously acted as support. The main sellers are sitting below $0.52 and are gradually capitulating on the price increase, dropping positions to breakeven or a small plus (most portfolios are in deep red)
bSmooth growth with pullbacks is an ideal scenario for price recovery, in which, when fixed above $ 0.52, the main push will begin without unnecessary passengers.

STRKUSD direction is clear at this pointSTRK is hitting a new ATH Rate of Change against USD on the daily chart while price is making Lower Highs and Higher Highs. I guess the direction is clear at this point, right?
Check my previous TA for this pair

Scalp SHORT – STRK🐻 Scalp SHORT – STRK
RSI is extremely overbought on the 1h timeframe, accompanied by two clear bearish divergences, signaling weakening bullish momentum. Price has repeatedly failed to break major resistance, confirming selling pressure is taking control and a downside correction is highly probable.
🎯 Trade Setup:
TP: 0.1678
SL: 3.28
RR: 1 : 5.12
A clean short setup: strong bearish divergence, failed breakout attempts, and clear correction signals.

STRK just completed one of the cleanest Wyckoff Accumulation The chart literally looks like it was copied straight from the textbook:
Selling Climax → ST → Spring → Breakout
Perfect reclaim of the entire range
Volume kicking in right at resistance
Composite Operator behavior all over this
This is the kind of setup most traders only recognize after the markup begins.
If this plays out:
📌 $0.25 → $0.34 → $0.45+
That’s the path.
Not a guarantee — just a pattern the market has respected for over 100 years.
This is why you study structure.
This is why you watch accumulation ranges.
STRK is waking up.
NASDAQ:STRK #Wyckoff


STRKUSDT - The real STAR!Let me introduce you to the new rising star that’s about to steal the spotlight: STRK.
The coin has been pumping like crazy for the past few days, but once you zoom out and check the chart, you’ll see that this is just the beginning — a clean breakout from a 258-day accumulation range.
Not only that, but it also broke the long-term descending trendline (from day one of the project) and successfully retested it.
I’m not exaggerating when I say the minimum target lies around the 0.618 Fibonacci level,
which is roughly a 3× move from the current price.
Best Regards:
Ceciliones🎯

$STRK price — Testing the end of a long-term downtrendAfter months of pressure since early 2024, #STRK is attempting a breakout.
The next two daily candle closes for OKX:STRKUSDT will be crucial for confirming direction.
Above $0.17 — potential confirmation of reversal and continuation higher.
Below $0.17 — likely a stop-loss hunt before retesting support near $0.07.
The market structure still looks fragile, so confirmation is key before entering long positions.
💭 Could this finally be the turning point for #Starknet , or another trap for hopeful buyers?
______________
◆ Follow us ❤️ for daily crypto insights & updates!
🚀 Don’t miss out on important market mov es
🧠 DYOR | This is not financial advice, just thinking out loud.

STRK - PERFECTWho laught on my chart? 👀
35% up from my bull chart ✅
30% down from the bearish chart✅
NASDAQ:STRK - 265 days range retest is in?
Following my lines, this could be a key retest before to see a 50%+ move 🚀
Remember:
90%+ of time the market tend to retest key breakout levels.
Follow the CryptoFrog to not miss any EPIC move! 🐸
STRK/USDT – The 0.153–0.133 Zone Will Decide the Next Trend?STRK/USDT is entering one of the rarest market phases: a combination of a major trendline breakout, a clean retest into a historical accumulation zone, and a perfect alignment with the 0.5–0.618 Fibonacci retracement levels.
This trio of signals often appears at the early stage of a major trend reversal.
The 0.153–0.133 zone (yellow block) is not just a support area. It is a high-value demand zone that has consistently absorbed selling pressure for months, and now acts as the critical pivot that will decide STRK’s mid-term direction.
Following the successful breakout above the long-term descending trendline, the price is now retesting the same accumulation area. This is the classic pattern often seen before a major expansion move:
Breakout → Retest → Expansion.
If the retest holds, this area could serve as the launchpad for STRK’s next major leg upward.
---
Bullish Scenario (Primary – High Probability)
1. Price holds the 0.153–0.133 support block and forms a clear bullish rejection candle.
2. Additional confirmation: a 3D or daily close above the first resistance at 0.195.
Once confirmed, STRK opens room toward the following upside targets:
TP1: 0.195 (first resistance and structural pivot)
TP2: 0.355 (major supply zone + measured-move target)
TP3: 0.520 (continuation-level target if momentum expands)
If the full breakout & retest pattern plays out, STRK may enter a mid-term trend reversal from bearish to bullish.
---
Bearish Scenario (Invalidation Criteria)
The bearish case activates only if:
Price closes decisively below 0.133, breaking the entire accumulation block and invalidating the retest structure.
If this breakdown occurs:
Market structure shifts back into bearish continuation.
Downside targets would shift toward:
0.10 – 0.09
Extended support: 0.07 – 0.05 if momentum accelerates
The 0.153–0.133 zone is therefore the key invalidation area for bullish traders.
---
Pattern & Market Structure Overview
Long-term trendline breakout shows a shift in sentiment.
Perfect retest into demand signals strong buyer presence.
0.5–0.618 Fibonacci alignment provides technical confluence for a potential reversal.
Range contraction inside the yellow block indicates a buildup before a large move.
This combination makes STRK one of the more technically compelling setups on the mid-term chart.
---
Trading Conclusion
As long as price holds the 0.153–0.133 accumulation block:
STRK remains in a high-probability reversal phase with upside potential toward 0.195 → 0.355 → 0.520.
A close below 0.133 invalidates the bullish structure and opens the door for deeper downside targets.
The yellow zone remains the decisive level that will define STRK’s next trend.
---
#STRK #STRKUSDT #CryptoAnalysis #Altcoins #BreakoutRetest #MarketStructure #DemandZone #TrendReversal #TechnicalAnalysis

STRK Finally Escapes the RangeNASDAQ:STRK has finally broken out of its long consolidation zone and pushed above the descending trendline—something the chart hasn’t managed to do for months. This breakout shows a clear shift in momentum, with buyers stepping in strongly.
As long as price holds above this zone, STRK could be gearing up for a continuation move to the upside. The structure looks healthier now, and the breakout suggests the trend may be turning in favor of the bulls.
DYOR, NFA
Please hit the like button if you like it, and share your views in the comments section.

Scalp Short – STRK📉 Scalp Short – STRK
A strong bearish divergence has formed on the 1-hour timeframe. Selling volume is increasing and starting to dominate. After an extended overbought phase, a transition toward oversold conditions is likely.
🎯 Trade Setup:
Take Profit (TP): 0.1046
Stop Loss (SL): 0.2117
Risk/Reward Ratio (RR): 1 : 3.81
A high-risk, high-reward short setup driven by clear bearish divergence and rising selling momentum.

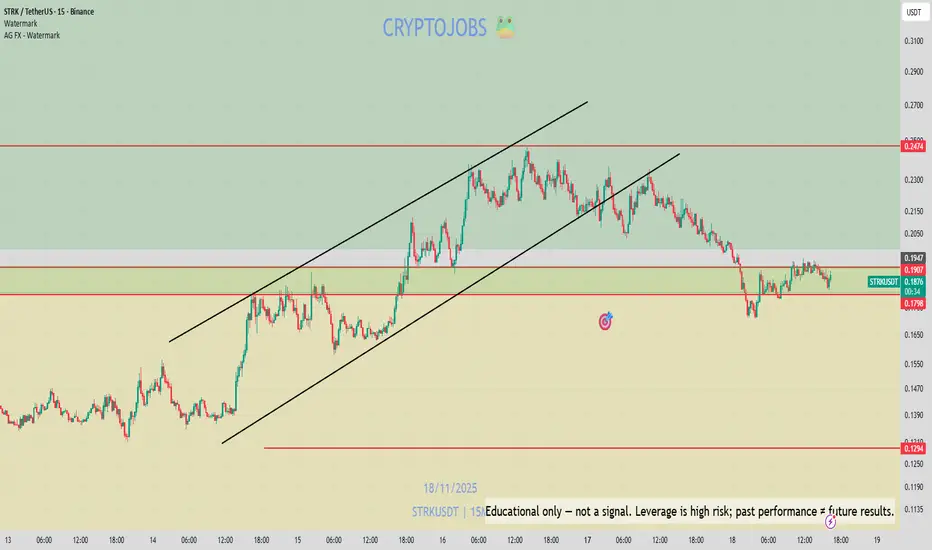
STRK Update🚨📊 STRK Update
STRK is testing the red resistance zone 🔴.
If price breaks out above this level,
the first target will be the green line level 🟢.
But be careful — at the same time,
the chart is showing signs of a possible head and shoulders formation,
which can signal weakness if the breakout fails.
Stay alert and watch how price reacts at this key zone.

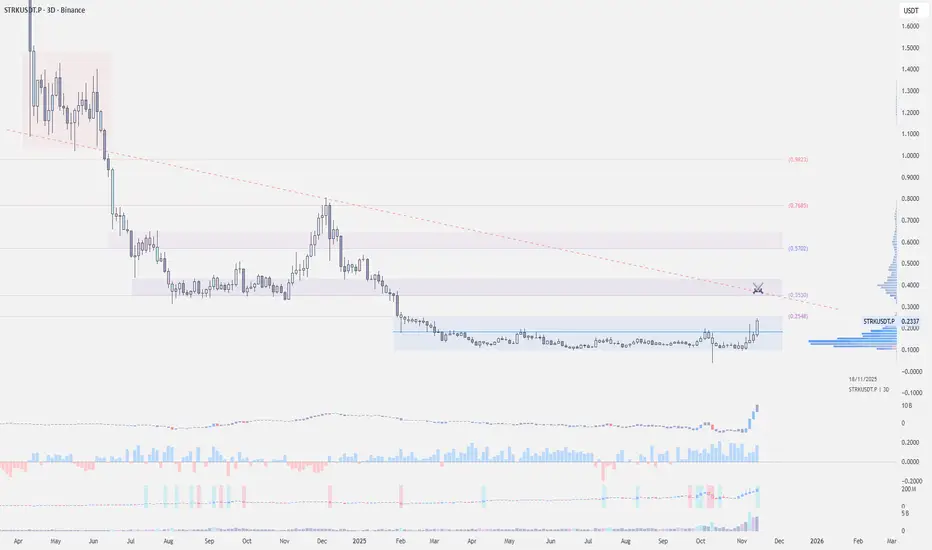
$STRK Multi-Week BreakoutBINANCE:STRKUSDT | 3D
(Starknet) has been one of the stronger performers in the market, showing a clear revival as it attempts to break out of its multi-week consolidation.
On the 3-day chart, price is now hovering above the $0.20 zone. As long as it holds this premium area of the range, bulls remain firmly in control.
If this level continues to act as support, STRK has a strong chance of making a move toward the $0.30–$0.40 region — the next major resistance, aligned with the diagonal trendline.
Awaiting the Breakout Above Consolidation!Looking the daily chart, we can clearly see price has been stuck in a consolidation range for quite some time. This sideways movement indicates a battle between buyers and sellers, with neither side able to decisively take control.
The "bulls hunt" below the consolidation range, suggesting some liquidity grabs before a potential move higher. However, to confirm a bullish continuation, we need a clear daily close above the upper boundary of this wide consolidation box.
I see a potential targets of $0.3438 & $0.4. If price reached these targets and sustained a strong momentum, we could see higher prices.
Good Luck!

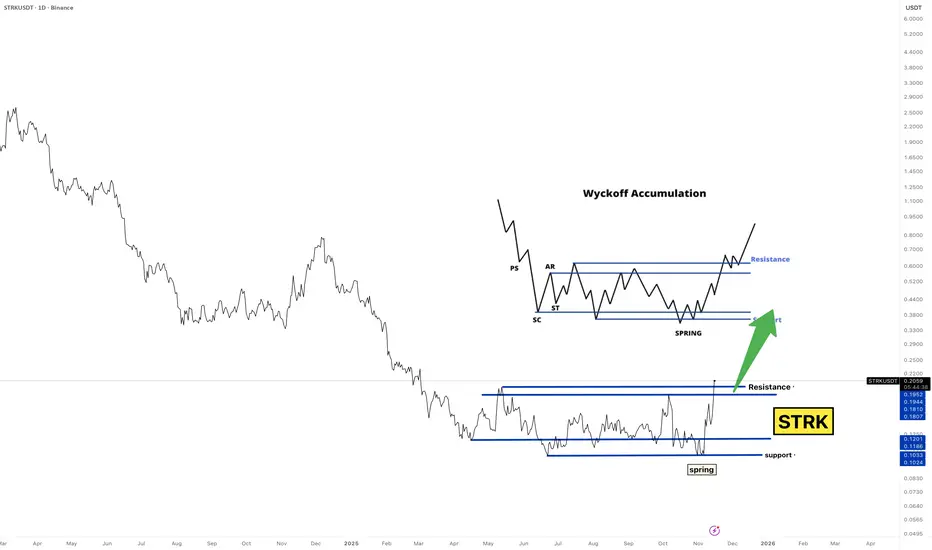
STRK Is Quietly Building a Monster Wyckoff Setup…TRK is doing EXACT Wyckoff… and nobody is paying attention.
This is the setup smart money dreams of:
Selling climax? ✔️
Secondary test? ✔️
Spring? ✔️
Back into range + breakout attempt? ✔️
This is textbook Wyckoff Accumulation — the kind you screenshot and show your kids in 10 years.
Most people won’t notice this pattern until it’s already +200% higher.
You’re seeing it early.
If Wyckoff plays out:
📌 0.22 → 0.45 → 0.70
That’s the roadmap.
Not financial advice — just reading the tape the way the composite operator intended.
Bookmark this. Save the chart.
Watch it unfold.
NASDAQ:STRK #Wyckoff #CryptoTrading #Accumulation #SpecVibe