STRK/USDT – The 0.153–0.133 Zone Will Decide the Next Trend?STRK/USDT is entering one of the rarest market phases: a combination of a major trendline breakout, a clean retest into a historical accumulation zone, and a perfect alignment with the 0.5–0.618 Fibonacci retracement levels.
This trio of signals often appears at the early stage of a major trend reversal.
The 0.153–0.133 zone (yellow block) is not just a support area. It is a high-value demand zone that has consistently absorbed selling pressure for months, and now acts as the critical pivot that will decide STRK’s mid-term direction.
Following the successful breakout above the long-term descending trendline, the price is now retesting the same accumulation area. This is the classic pattern often seen before a major expansion move:
Breakout → Retest → Expansion.
If the retest holds, this area could serve as the launchpad for STRK’s next major leg upward.
---
Bullish Scenario (Primary – High Probability)
1. Price holds the 0.153–0.133 support block and forms a clear bullish rejection candle.
2. Additional confirmation: a 3D or daily close above the first resistance at 0.195.
Once confirmed, STRK opens room toward the following upside targets:
TP1: 0.195 (first resistance and structural pivot)
TP2: 0.355 (major supply zone + measured-move target)
TP3: 0.520 (continuation-level target if momentum expands)
If the full breakout & retest pattern plays out, STRK may enter a mid-term trend reversal from bearish to bullish.
---
Bearish Scenario (Invalidation Criteria)
The bearish case activates only if:
Price closes decisively below 0.133, breaking the entire accumulation block and invalidating the retest structure.
If this breakdown occurs:
Market structure shifts back into bearish continuation.
Downside targets would shift toward:
0.10 – 0.09
Extended support: 0.07 – 0.05 if momentum accelerates
The 0.153–0.133 zone is therefore the key invalidation area for bullish traders.
---
Pattern & Market Structure Overview
Long-term trendline breakout shows a shift in sentiment.
Perfect retest into demand signals strong buyer presence.
0.5–0.618 Fibonacci alignment provides technical confluence for a potential reversal.
Range contraction inside the yellow block indicates a buildup before a large move.
This combination makes STRK one of the more technically compelling setups on the mid-term chart.
---
Trading Conclusion
As long as price holds the 0.153–0.133 accumulation block:
STRK remains in a high-probability reversal phase with upside potential toward 0.195 → 0.355 → 0.520.
A close below 0.133 invalidates the bullish structure and opens the door for deeper downside targets.
The yellow zone remains the decisive level that will define STRK’s next trend.
---
#STRK #STRKUSDT #CryptoAnalysis #Altcoins #BreakoutRetest #MarketStructure #DemandZone #TrendReversal #TechnicalAnalysis
Strkusdtperp

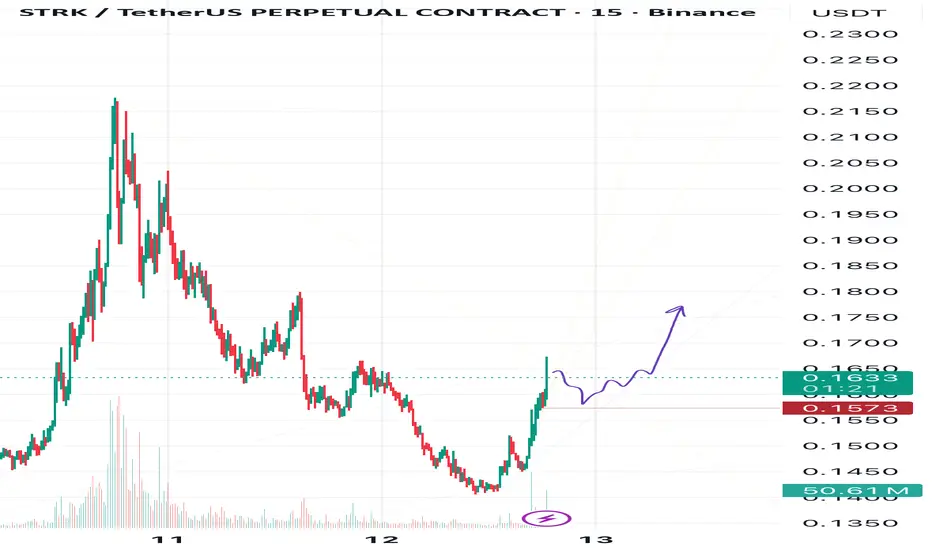
STRK About to Spark🧨STRK looks like it’s getting ready to take off.
🐂If the bullish pressure continues, we could see a strong move to the upside.
However, as always, I’ll stay cautious and watch how the price reacts near key resistance zones.
Targets:
🎯1 0.17,
🎯2— 0.176,
🎯3 — 0.182,
🚀and my global target remains at 0.20.
❌The invalidation zone for this plan is set at 0.1573.
⚠️This is not financial advice — just my personal view on the chart.
Trade safe, manage your risk, and stay tuned for what’s next! 🚀
STRK/USDT — The Calm Before the Storm: Trendline Decision Zone?For months, STRK has been trapped under a relentless downtrend, unable to escape the grip of the descending yellow line — a historical resistance wall that has rejected every rally attempt.
But this time feels different.
Price is once again testing the major descending trendline near the $0.18–$0.20 zone, showing early signs of momentum.
The question is — is this just another fake pump before another leg down… or the beginning of a major reversal?
---
🔶 Market Structure & Pattern
The 3D chart clearly shows a classic downtrend exhaustion structure — a steep drop, followed by a long sideways base, and now a retest of the main trendline.
This setup resembles the early stage of a Falling Wedge Breakout or a Descending Channel Reversal, both of which often precede major bullish reversals when confirmed by strong volume.
---
🟢 Bullish Scenario — The Breakout We’ve Been Waiting For
If STRK manages to close a 3D candle above the trendline and $0.20, a strong bullish breakout could be underway.
Volume confirmation will be crucial — the stronger the breakout volume, the more reliable the rally potential.
Possible upside targets:
Target 1: $0.34 → First key resistance retest
Target 2: $0.515 → Mid-range breakout confirmation
Target 3: $0.775 – $1.35 → Full trend reversal zone if momentum extends
Once the breakout is validated and the retest holds, STRK could finally escape its accumulation zone and enter a new expansion phase.
---
🔴 Bearish Scenario — Another Rejection Ahead
However, if the yellow line once again acts as a brick wall, a sharp rejection could occur.
Failure to break through might drag the price back into its lower range:
Main support: $0.12 → $0.09
Extreme low: $0.065
A strong rejection from this zone often triggers a final capitulation wave before a true reversal emerges.
Until a confirmed breakout happens, traders should remain cautious — false signals are common at this stage.
---
⚙️ Breakout Confirmation Checklist
✅ 3D candle close above $0.20
✅ Volume spike confirming momentum
✅ Trendline flips into new support on retest
✅ Bullish divergence on RSI or MACD
✅ BTC and overall market sentiment supportive
Without these confirmations, the breakout is likely to fail.
But if all align — STRK could become one of the next altcoins to awaken from the bottom.
---
💡 Trading Insight
> “The darkest point of a chart often comes right before the dawn.”
STRK now stands at a crossroad between breakdown and breakout — where patience and precision will define the winners.
Strategy notes:
Enter after confirmation, not anticipation.
Set tight stop-loss below swing lows.
Take profit in stages at key resistance levels.
Manage risk strictly — the setup is promising but not risk-free.
---
🔖 Summary
STRK is approaching a historic decision zone.
A confirmed breakout above the long-term trendline could mark the first real shift in trend direction after months of accumulation.
Failure to do so, however, may lead to another dip before the real breakout later.
Either way — this is a key inflection point worth watching closely.
---
#STRK #STRKUSDT #Crypto #Breakout #TechnicalAnalysis #PriceAction #CryptoSignals #AltcoinWatch #TrendlineBreak #MarketAnalysis #CryptoTrading #ChartSetup #ReversalPattern #SmartMoney

STRKUSDT 1DSTRK ~ 1D Analysis
#STRK High risk trading. Buy gradually after successfully penetrating this resistant line with a short -term target of at least 10%+.

STRKUSDT 2DSTRK Update ~ 2D
#STRK The purchasing range for this is very wide. however, This is a very good accumulation area for now. If you still have Conviction on the coin,. buy gradually inside this support block,.

STRKUSDT 2DSTRK Update ~ 2D
#STRK If you still have Conviction on this coin,. This support block would be a very good buying place for now,. Buy in stages with a short term target of at least 20%++

STRKUSDTSTRK ~ 1D
#STRK If you have Conviction on this coin,. Maybe this will be a very good support block to start accumulating from here.

STRKUSDT Forms Bullish Flag PatternSTRKUSDT technical analysis update
STRK price has formed a bullish flag pattern on the 1H chart, with the price moving toward the flag's resistance line for a potential breakout.
We can enter the trade once the breakout is confirmed on the 1H chart.
Regards
Hexa

STRKUSDT Price Making Higher HighsSTRKUSDT technical analysis update
STRK's price is making higher highs and has formed an ascending channel on the 4H chart. The price has broken the ascending channel's resistance line with high volume. We can expect a small retest before the price continues upward.
STRK price potential to reach $1.00 in few weeks.
