FireHoseReel | STX Breakout Loading at Key Levels🔥 Welcome To FireHoseReel !
Let’s jump into Stacks (STX) market analysis.
🪙 Stacks (rank #88) powers Bitcoin smart contracts, letting users build DeFi, NFTs, and apps on BTC with security anchored to the Bitcoin chain.
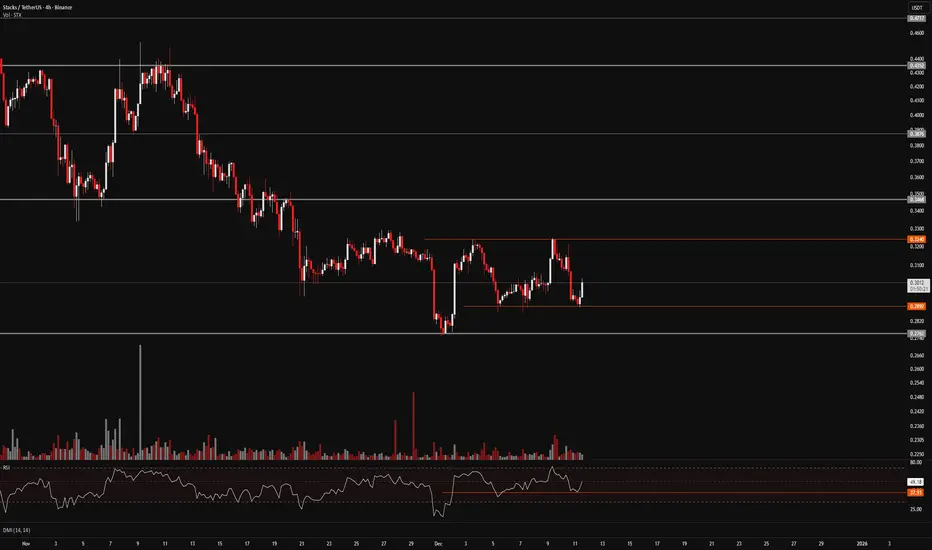
👀 STX 4H Overview
STX is in a clear downtrend on the monthly, weekly, and daily charts. On the 4H timeframe, it has formed a small consolidation zone. A breakout in either direction can create a tradable setup from this consolidation.
📊 Volume Analysis
Stacks is currently showing significant volume decline, and the last volume spike leaned toward selling pressure. A breakout through the orange pre-breakout zones could trigger a notable increase in volume.
✍️ STX Trading Scenarios
🟢 Long Scenario:
A breakout above $0.324 with rising buy volume creates a pre-breakout setup targeting the $0.346 resistance—suitable for a risky long entry.
🔴 Short Scenario:
Losing the $0.2899 support with increasing sell volume—especially if RSI dips into oversold—could act as a pre-breakout signal for a deeper move toward $0.2762.
🧠 Protect your capital first. No setup is worth blowing your account. If risk isn’t controlled, profit means nothing. Trade with rules, not emotions.
Stxanalysis
STX/USDT — Key Support Test, Break or Bounce?Stacks (STX/USDT) is currently sitting at a critical make-or-break zone that will define its medium- to long-term direction. On the weekly chart, price has returned to the historical demand zone at $0.42 – $0.58 (yellow box). This area has acted as a strong accumulation level multiple times before — notably during the 2022–2023 bottom before the explosive rally above $3.
---
🔎 Structure & Pattern
1. Historical Demand Zone ($0.42–$0.58)
This zone is the last stronghold for bulls before the market risks sliding back towards the historical low at $0.1987.
As long as price holds and forms a reversal pattern here (bullish engulfing, hammer, etc.), it can trigger another wave of accumulation.
2. Lower Highs Since 2024
After peaking above $3, STX has continued to print lower highs, showing that sellers still dominate.
However, a retest of this deep demand zone also sets the stage for a potential large-scale bottoming.
3. Multi-Year Range
STX has been moving within a broad $0.20 – $3.60 range since 2021.
Price is now at the bottom edge of this range, meaning downside risk is relatively limited compared to the upside potential if a rebound occurs.
---
🚀 Bullish Scenario
Early Confirmation: A weekly close back above $0.80 – $1.00.
Upside Targets:
First resistance: $1.0089
Next levels: $1.3112 → $1.7040 → $2.7367 → $3.6291
From entries in the $0.58–0.45 zone, the reward-to-risk (R:R) potential is >3:1, making this area a high-value accumulation zone.
---
⚠️ Bearish Scenario
Breakdown Confirmation: A weekly close below $0.42.
Downside Targets:
First: $0.28 (minor support)
Next: $0.1987 (historical low)
A failure here would signal renewed long-term bearish pressure and a potential return to the cycle’s bottom range.
---
🎯 Conclusion
STX is currently at a golden accumulation zone that historically has provided strong upside reactions.
Aggressive traders may look for entries at $0.58–0.45 with stops below $0.42.
Conservative traders should wait for a weekly close above $0.80–1.00 for confirmation of bullish momentum.
This is a decisive zone: hold = high rebound potential, break = risk of retesting $0.20.
---
#STX #STXUSDT #Stacks #Crypto #TechnicalAnalysis #CryptoTrading #Altcoins #PriceAction #SupportResistance #Accumulation

STX (SPOT)BINANCE:STXUSDT
#STX / USDT
Entry range (0.650- 0.670)
SL 4H close below 0.630
T1 0.760
T2 0.840
T3 1.000
2 Extra Targets is optional 1.300 and 1.600
_______________________________________________________
Golden Advices.
********************
* collect the coin slowly in the entry range.
* Please calculate your losses before the entry.
* Do not enter any trade you find it not suitable for you.
* No FOMO - No Rush , it is a long journey.

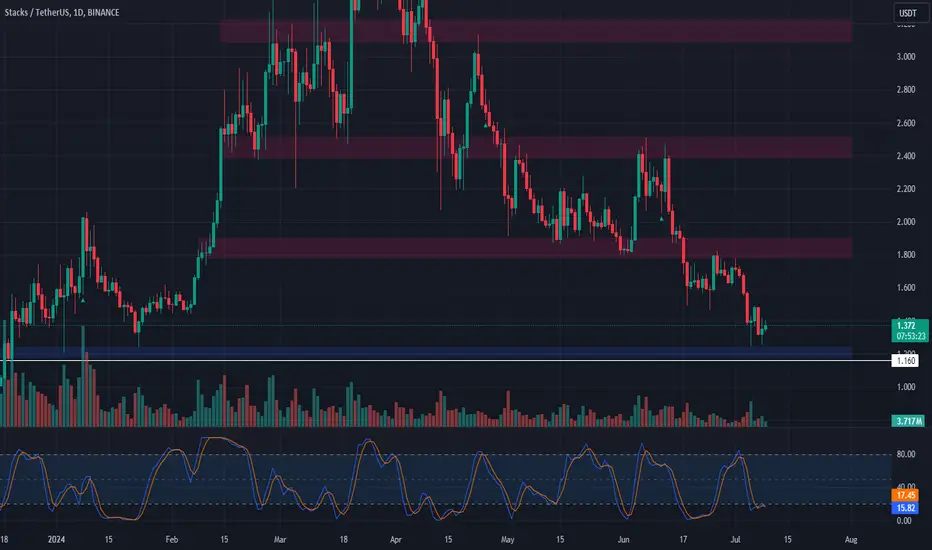
Trade Setup: STX Double Bottom FormationMarket Context:
STX has shown a significant rally of 200% the last time it touched this support level. With the price forming a double bottom and BTC expected to rally, this presents an opportunity for both a spot position and a shorter-term trade.
Trade Setup:
Entry: Enter a trade at $1.37.
Take Profit: Set profit targets at $1.80 and $1.98.
Stop Loss: Place the stop loss at $1.16 (on a daily close).
📊 Monitor BTC's performance closely and adjust your strategy as needed! #STX #CryptoTrading #DoubleBottomFormation 🎯
Opportunity to buy in STXFrom where we put the red arrow on the chart, STX correction has started.
According to STX correction, it is a symmetrical or double.
The green range is a good support.
By maintaining the green range, it can have an upward return towards the targets specified on the chart.
Closing a daily candle below the invalidation level will violate the analysis
For risk management, please don't forget stop loss and capital management
When we reach the first target, save some profit and then change the stop to entry
Comment if you have any questions
Thank You

STXUSDT Signals Potential Bullish Breakout with Falling Wedge 💎 STXUSDT pair has formed a falling wedge pattern on the 4-hour timeframe, indicating a potential bullish reversal.
💎 As the trading volume gradually decline. This signifies reduced selling pressure and accumulation by buyers. An increase in volume during the breakout can further confirm the bullish outlook.
💎 If the breakout occurs above the upper trendline of the falling wedge, it could lead to a potential upward price movement.
Disclaimer: This is Not Financial Advice ❗️ Trade at Your Own Risk ⚠️
