Sugar Market Upside Potential – Smart Entry, SL & TP GuideSUGAR: HULL MA Breakout Confirms BULLISH SWING! 🚀🍭 + Key Pairs Analysis
🔥 Asset: “SUGAR” – Soft Commodities Market Trade Opportunity Guide (Swing / Day Trade)
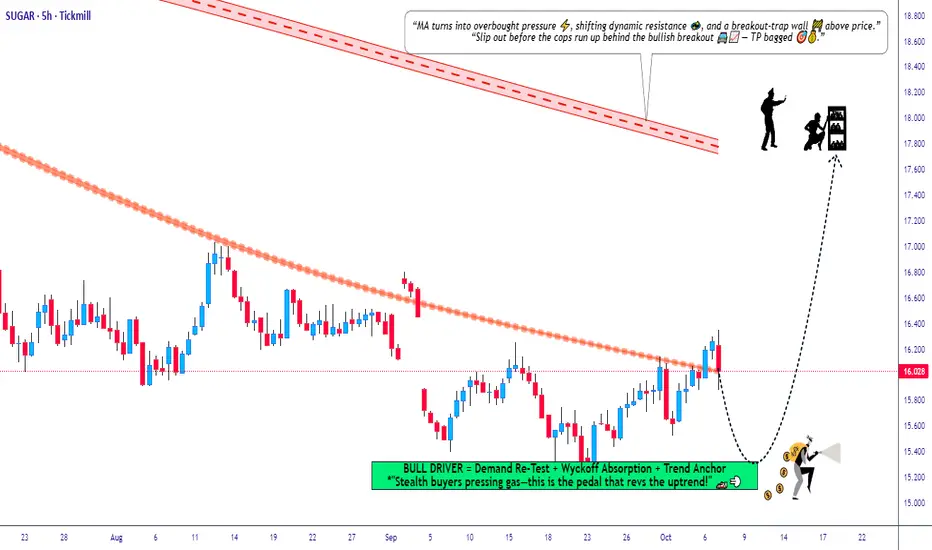
📈 Market Bias: Bullish continuation confirmed after a HULL Moving Average Breakout
🎯 Trading Style: Suitable for both Swing & Day Traders
🚀 Plan Overview
The bullish structure remains strong as price has completed a clean breakout above the Hull Moving Average, signaling renewed upward momentum. Buyers continue to hold control, and momentum strength supports potential continuation toward higher resistance zones.
🎯 Entry Plan
💠 Entry: Traders can position at any suitable price level after confirming bullish structure continuation.
✔ Use your own filtering tools such as:
– Structure Retests
– Trendline Bounces
– Pullback Zones
– Volume Confirmation
🛡 Stop Loss (Risk Management)
🔻 Suggested SL Zone: 15.200
Dear Ladies & Gentlemen (Thief OG’s), kindly adjust your stop loss based on your personal strategy and risk tolerance. This value is NOT a mandatory SL—trade safely and manage your own risk model.
🎯 Target Zone
🎯 Primary Target: 17.600
This target aligns with:
• Moving Average Resistance Zone
• Overbought Price Conditions
• Potential Bull Trap Formation Near Upper Bands
Dear Ladies & Gentlemen (Thief OG’s), take profits according to your own strategy. You are in full control—make profits, secure profits at your comfort and risk.
🔍 Correlated Pairs & Related Markets to Watch
Monitoring correlated markets helps validate momentum, sentiment, and macro commodity flow.
🔸 1. Sugar Futures (SB1!) — USD Contract
• Direct benchmark for sugar price movements.
• Strong correlation with supply shocks, weather conditions & global trade flows.
🔸 2. Crude Oil (WTI / Brent)
• Indirect correlation through biofuel production.
• When crude rises, demand for ethanol (produced from sugarcane) increases → bullish for Sugar.
• Watch for energy market volatility.
🔸 3. US Dollar Index (DXY)
• Commodities priced in USD react inversely.
• Weak USD = bullish commodities, including sugar.
• If DXY pulls back, sugar tends to strengthen.
🔸 4. Corn Futures (ZC)
• Sugar competes with corn in the biofuel market.
• If corn prices rise, sugar becomes more attractive → increases demand for sugarcane-derived products.
🔸 5. Coffee & Cocoa (Soft Commodities Basket)
• Often experience similar supply chain disruptions.
• Weather cycles impact the entire soft-commodity group together.
• Strength in these markets sometimes signals broader soft commodity momentum.
🧭 Key Takeaways
• Hull MA Breakout confirms bullish control
• Structure remains supportive for higher continuation
• Risk management is personal—trade responsibly
• Soft commodities often move in clusters; keep correlated markets on your radar
• Watch for overbought traps near target zone
Sugartrade
Is This the Perfect Short Entry in Sugar RAW? Check the Plan!🏴☠️ Thief OG’s Sugar RAW CFD Money Making Plan 💰 (Swing/Day Trade)
Asset: SUGAR RAW Commodities CFD
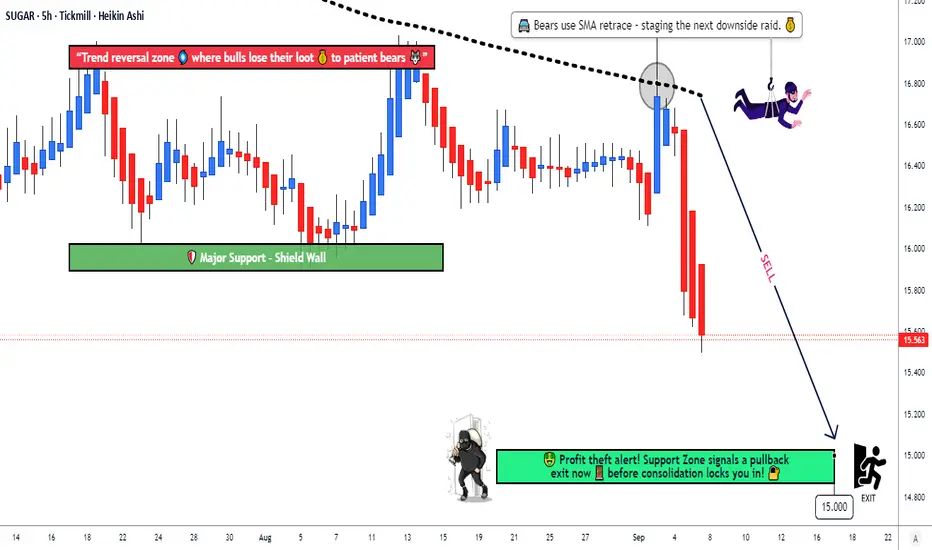
Plan: Bearish Plan confirmed with 200 SMA rejection of bulls + seller pressure on the downside
⚡ Trade Setup – Thief Strategy Style
Entry: Use Thief layering strategy with multiple limit orders:
Example: 16.000 / 15.800 / 15.600 / 16.100
💡 You can increase limit layers based on your own plan.
Stop Loss: Thief SL @16.400 ❌
Adjust based on your strategy & risk appetite.
Target: Support + oversold + market reversal trap → Target @15.000 🎯
Note: Take profits at your discretion — “stolen money” is yours to keep 💵
🔍 Why This Plan? – Thief Technical + Macro Analysis (SEPTEMBER 05)
Thief Technical Plan:
Bearish trend confirmed via 200 SMA rejection 📉
Multiple layer entries to optimize risk/reward ⚡
Market traps and reversal zones accounted for 🕵️♂️
Fundamental & Macro Insights:
Fundamental Score: 6/10
✅ Record global production: 189.3M MT (Brazil & Thailand)
❌ Surplus of 7.5M MT pressuring prices
⚠️ Logistical bottlenecks & ethanol competition affecting supply
Macro Score: 5/10
📉 Weak global demand amid slowdown
🌎 Geopolitical tensions affecting trade flows
💵 Strong USD capping gains
Investor Sentiment:
Retail Traders: Bullish 45% 🐂 / Bearish 55% 🐻
Institutional Traders: Bullish 35% 🐂 / Bearish 65% 🐻
Fear & Greed Index:
Current Level: 40/100 😨 Neutral → slight fear
Mood: Cautious due to oversupply
Overall Market Outlook: Bearish 📉
Oversupply + weak demand + macro headwinds outweigh emerging market demand potential
🔗 Related Pairs to Watch:
$COFFEEUSD ☕
$COTTONUSD 🧵
OANDA:SUGARUSD 🍬
“If you find value in my analysis, a 👍 and 🚀 boost is much appreciated — it helps me share more setups with the community!”
#SugarCFD #CommoditiesTrading #ThiefStrategy #BearishPlan #SwingTrade #DayTrade #CryptoCommodities #ForexCFD #MarketAnalysis #TradingViewIdeas #TraderOG
Massive H&S for Sugar? Right shoulder forming?Is this a massive Head and Shoulders pattern for Sugar? The head and left shoulder are complete but will the right shoulder form and head to the mid 7s?
Time will tell and we'll know by early 2025.
This all started in June 2014.

Sugar #11; Dire StraitsIt is the case once again for the typical, alternating, virtually daily news bites, decrying "world sugar deficits", "Brazilian yield collapse (due to drought; El Nino)", "record Brazilian Real strength", "rising crude oil prices" versus "record Brazilian harvests", "strengthening USD" and "falling crude prices due to recession fears". The song remains the same.
In reality;
- Brazilian harvest prospects are doing just fine;
- The recent Brazilian Real strength is likely experiencing it's end of days;
- Crude oil prices, fundamentally and technically, have a far better chance to turn south than otherwise. (See this post; )
Now, factor in the clearly (very) bearish technical outlook while also noting significant short covering, as of late. E.g., the makings of very favorable SHORT Entry here.
The Daily;
With last week's 5 strait days of breaking lower.

SUGAR BULISH SCENARIOPrice boost and upward momentum on Raw Sugar, after India declared that a downward revision on its sugar cane crush. Being the second largest manufacturer of sugar in the world, this news had a positive effect on the price of the raw material.
Both MACD and RSI are confirming the current trend. If it continues, the price might reach levels of 25.539
As a pivot point levels of 22.43 can be used, and if the price breaks below it, can test levels of 21.58
Risk Disclosure: Trading Foreign Exchange (Forex) and Contracts of Difference (CFD's) carries a high level of risk. By registering and signing up, any client affirms their understanding of their own personal accountability for all transactions performed within their account and recognizes the risks associated with trading on such markets and on such sites. Furthermore, one understands that the company carries zero influence over transactions, markets, and trading signals, therefore, cannot be held liable nor guarantee any profits or losses.

Sugar - SHORT; SELL it here!Sugar will have an awful hard time to go any higher here, climbing into multi-year major resistance. A sustained decline should take Sugar substantially lower into year's end.
Ample grain and bio-fuel stocks are also a prelude to an over-supply imbalance. (Not to mention substantially lower crude oil prices on the horizon.) This is a low-risk spot to initiate a long term SHORT .

Sugar Trade (Entry at 0.14392) (Take Profit at 0.15120)Enter SUGARUSD at 0.14392. Take Profit at 0.15120.


SUGAR FUTURES (SB1!) WeeklyDates in the future with the greatest probability for a price high or price low.
The Djinn Predictive Indicators are simple mathematical equations. Once an equation is given to Siri the algorithm provides the future price swing date. Djinn Indicators work on all charts, for any asset category and in all time frames. Occasionally a Djinn Predictive Indicator will miss its prediction date by one candlestick. If multiple Djinn prediction dates are missed and are plowed through by same color Henikin Ashi candles the asset is being "reset". The "reset" is complete when Henikin Ashi candles are back in sync with Djinn price high or low prediction dates.
One way the Djinn Indicator is used to enter and exit trades:
For best results trade in the direction of the trend.
The Linear Regression channel is used to determine trend direction. The Linear Regression is set at 2 -2 30.
When a green Henikin Ashi candle intersects with the linear regression upper deviation line (green line) and both indicators intersect with a Djinn prediction date a sell is triggered.
When a red Henikin Ashi candle intersects with the linear regression lower deviation line (red line) and both indicators intersect with a Djinn prediction date a buy is triggered.
This trading strategy works on daily, weekly and Monthly Djinn Predictive charts.
This is not trading advice. Trade at your own risk.
