Explode Your Gains: Epic $SUN Trading Breakthrough Awaits!BINANCE:SUNUSDT
Explode Your Gains: Epic NYSE:SUN Trading Breakthrough Awaits!
Key Patterns:
The uptrend forms a clear parabolic rise with increasing volatility (longer wicks on candles).
The downtrend resembles a "dump" phase, with a near-vertical drop, possibly driven by profit-taking or market sentiment shifts.
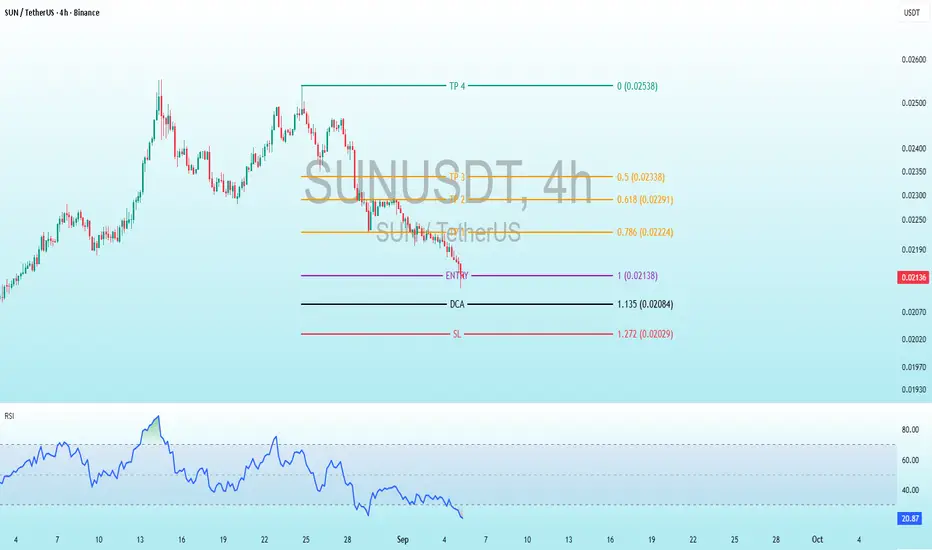
Current price is consolidating near a potential support zone (0.0190–0.0200 USDT), with small-bodied candles indicating indecision. No clear reversal pattern (e.g., hammer or double bottom) is visible yet, but the proximity to marked levels suggests a setup for one.
Volatility and Range: The price range over the period is from ~0.0170 USDT (lows) to 0.0600 USDT (highs). Recent action is low-volatility compared to the peak, with the price hugging the lower end.
Indicator Analysis: RSI
The RSI (14-period) is plotted at the bottom, ranging from 0 to 100, with overbought (>70) and oversold (<30) thresholds marked implicitly (horizontal lines at 80, 60, 40, 20).
Behavior: RSI mirrored the price action closely. It spiked to over 80 during the uptrend (overbought, signaling potential exhaustion), then plunged sharply to around 20–25 by early September (oversold, indicating potential buying opportunity).
Current Reading: The RSI is at approximately 21 (visible on the right), deep in oversold territory. It has been trending downward but flattening slightly in the recent candles, which could hint at divergence if price stabilizes— a bullish signal if confirmed.
Interpretation: Oversold RSI often precedes reversals in trending markets, especially in crypto. However, in strong downtrends, it can remain oversold for extended periods. No clear bullish divergence (RSI higher lows while price makes lower lows) is evident yet, but watch for it as a confirmation of upside.
Marked Levels and Trading Strategy
The chart includes multiple horizontal lines with labels, colors, and Fibonacci ratios (e.g., 0.786, 1.618), suggesting a Fibonacci-based trading plan for a long position. This is common in crypto trading for projecting targets and risk management. The levels appear anchored from a recent swing low to high (likely the August low to peak).
Stop Loss (SL): Red line at 1.272 USDT, labeled "SL" with Fib 1.272 (0.02029) – slight discrepancy in label, possibly a calculation note). This is the risk level where the trade would be invalidated if price breaks lower.
Dollar Cost Average (DCA): Black line at 1.135 (1.135 Fib, 0.02004). This suggests adding to the position if price dips further, averaging down the entry cost.
Entry: Purple line at 1 (1.0 Fib, 0.02140-0.02135). This is the primary buy level, where the trader would enter a long position. Current price is very close or slightly below this, making it active or imminent.
Take Profit (TP) Levels: Multiple orange and cyan lines upward, labeled with Fib extensions (e.g., 0.786, 1.618, 3.0, 4.618, 5.0) and prices:
TP1: ~0.02224 USDT (0.786 Fib, 0.02224)
TP2: ~0.02291 USDT (1.618 Fib, 0.02291)
TP3: ~0.02338 USDT (likely 3.0 or 4.0 Fib, 0.02338)
TP4: Cyan at 0 (extended target 0.02538 USDT, possibly 5.0 Fib or the previous high).
Sunusdtlong
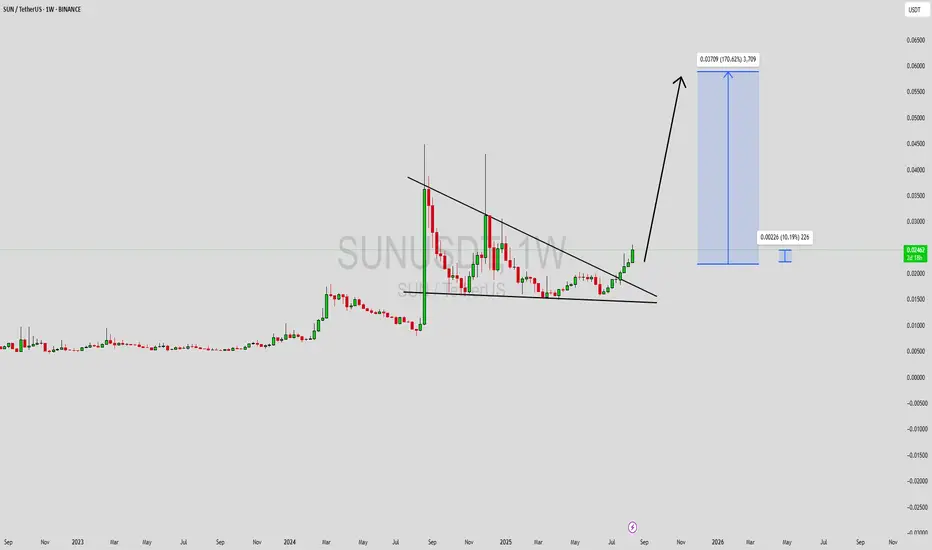
SUNUSDT Forming Descending TriangleSUNUSDT is showing a strong bullish breakout from a long-term descending triangle, a formation that often precedes explosive price action. The weekly chart reveals a sustained breakout above the multi-month trendline resistance, indicating a shift in market structure and signaling that bulls are gaining control. With volume gradually building up and a clear structure confirming accumulation, SUNUSDT appears ready for a significant move. Based on the current chart setup, there’s potential for an impressive 140% to 150% upside.
Historically, SUN has shown sharp vertical rallies following periods of consolidation. The current breakout mimics past behavior and could lead to a powerful trend continuation toward the 0.06000 USDT region. Traders and investors alike are paying close attention to this level, as the next wave of bullish sentiment could send SUNUSDT into price discovery, especially with the crypto market showing renewed optimism.
Market sentiment around SUN is also improving due to increasing attention from retail and institutional players. Social buzz, coupled with increased transaction volumes, reflects growing confidence in this project's roadmap and future prospects. If current momentum continues, SUNUSDT might outperform other altcoins in the short-to-medium term.
✅ Show your support by hitting the like button and
✅ Leaving a comment below! (What is You opinion about this Coin)
Your feedback and engagement keep me inspired to share more insightful market analysis with you!
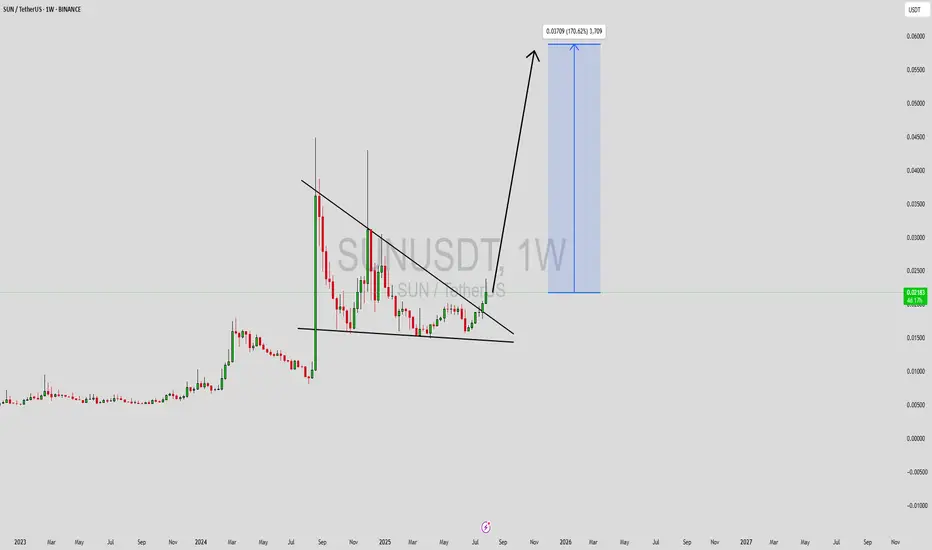
SUNUSDT Forming Potential BreakoutSUNUSDT is currently forming a promising potential breakout pattern that traders and investors should closely watch. The price action has shown a period of consolidation near key support zones, building a strong base for a potential explosive move. With volume gradually increasing and bulls taking control, the pair appears primed to break past resistance levels, signaling the beginning of a new uptrend phase.
The technical structure supports a bullish bias, with the potential to achieve a gain of 140% to 150%+ if the breakout materializes fully. Historical price behavior and recent candle formations suggest that SUNUSDT is gearing up for a rally, especially as it approaches a crucial trendline. If confirmed, this breakout could lead to a parabolic move, driven by renewed market interest and buying pressure.
SUN, being part of the TRON ecosystem, benefits from a solid foundation and increasing usage in DeFi applications. The token has seen growing investor interest, further fueling positive sentiment and long-term potential. The fundamentals are aligning well with the current technical outlook, providing additional confidence to bullish traders eyeing high-reward setups.
Given the momentum and improving market dynamics, SUNUSDT has become a high-potential watchlist candidate for both swing traders and long-term investors. A confirmed breakout above the current range could open the door to significant upside gains.
✅ Show your support by hitting the like button and
✅ Leaving a comment below! (What is You opinion about this Coin)
Your feedback and engagement keep me inspired to share more insightful market analysis with you!
SUNUSDT – One Chart, Three Opportunities☀️ In SUN/USDT, three distinct blue box zones stand out. Each offers its own kind of opportunity — but only if you approach them with structure and discipline.
🎯 Here's How to Use Them
📍 Zone 1 → potential for short-term gains
📍 Zone 2 → better suited for medium-term positioning
📍 Zone 3 → promising long-term risk:reward
But don’t place blind orders — instead:
✅ Set alerts for each zone
✅ When price reaches one, switch to 1H chart
✅ Look for an upward breakout
✅ Confirm with positive & rising CDV
If these conditions align, then — and only then — execute a trade.
"The market pays those who are patient and prepared — not those who guess."
Without confirmation, you're trading hope, not setup.
Let’s stay smart. Let’s stay strategic.
UmutTrades 💙
📌I keep my charts clean and simple because I believe clarity leads to better decisions.
📌My approach is built on years of experience and a solid track record. I don’t claim to know it all but I’m confident in my ability to spot high-probability setups.
📌If you would like to learn how to use the heatmap, cumulative volume delta and volume footprint techniques that I use below to determine very accurate demand regions, you can send me a private message. I help anyone who wants it completely free of charge.
🔑I have a long list of my proven technique below:
🎯 ZENUSDT.P: Patience & Profitability | %230 Reaction from the Sniper Entry
🐶 DOGEUSDT.P: Next Move
🎨 RENDERUSDT.P: Opportunity of the Month
💎 ETHUSDT.P: Where to Retrace
🟢 BNBUSDT.P: Potential Surge
📊 BTC Dominance: Reaction Zone
🌊 WAVESUSDT.P: Demand Zone Potential
🟣 UNIUSDT.P: Long-Term Trade
🔵 XRPUSDT.P: Entry Zones
🔗 LINKUSDT.P: Follow The River
📈 BTCUSDT.P: Two Key Demand Zones
🟩 POLUSDT: Bullish Momentum
🌟 PENDLEUSDT.P: Where Opportunity Meets Precision
🔥 BTCUSDT.P: Liquidation of Highly Leveraged Longs
🌊 SOLUSDT.P: SOL's Dip - Your Opportunity
🐸 1000PEPEUSDT.P: Prime Bounce Zone Unlocked
🚀 ETHUSDT.P: Set to Explode - Don't Miss This Game Changer
🤖 IQUSDT: Smart Plan
⚡️ PONDUSDT: A Trade Not Taken Is Better Than a Losing One
💼 STMXUSDT: 2 Buying Areas
🐢 TURBOUSDT: Buy Zones and Buyer Presence
🌍 ICPUSDT.P: Massive Upside Potential | Check the Trade Update For Seeing Results
🟠 IDEXUSDT: Spot Buy Area | %26 Profit if You Trade with MSB
📌 USUALUSDT: Buyers Are Active + %70 Profit in Total
🌟 FORTHUSDT: Sniper Entry +%26 Reaction
🐳 QKCUSDT: Sniper Entry +%57 Reaction
📊 BTC.D: Retest of Key Area Highly Likely
📊 XNOUSDT %80 Reaction with a Simple Blue Box!
📊 BELUSDT Amazing %120 Reaction!
📊 Simple Red Box, Extraordinary Results
📊 TIAUSDT | Still No Buyers—Maintaining a Bearish Outlook
📊 OGNUSDT | One of Today’s Highest Volume Gainers – +32.44%
📊 TRXUSDT - I Do My Thing Again
📊 FLOKIUSDT - +%100 From Blue Box!
📊 SFP/USDT - Perfect Entry %80 Profit!
📊 AAVEUSDT - WE DID IT AGAIN!
I stopped adding to the list because it's kinda tiring to add 5-10 charts in every move but you can check my profile and see that it goes on..

#SUN/USDT#SUN
The price is moving within a descending channel on the 1-hour frame and is expected to continue upward.
We have a trend to stabilize above the 100 moving average once again.
We have a downtrend on the RSI indicator that supports the upward move with a breakout.
We have a support area at the lower limit of the channel at 0.01560.
Entry price: 0.01610
First target: 0.01632
Second target: 0.01660
Third target: 0.01700

SUNUSDT 5DSUN ~ 5D Analysis
#SUN Trading is very high risk. Buy from here if you have a Conviction on this coin with a short -term target of at least 15%+.

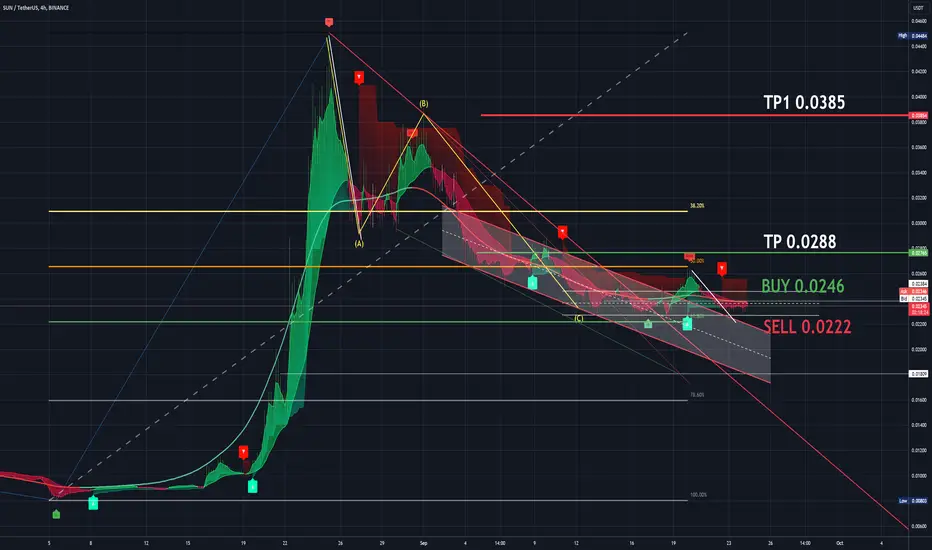
SUNUSDT 4H Consolidation zone on the 0.61% FIBONACCI correction.SUNUSDT 4H Consolidation zone on the 0.61% FIBONACCI correction.
SUN has broken out of all the bearish trends and is settling its price at these levels. From here, we have to watch what direction it takes, having clear levels where we can position ourselves bullish or bearish. We have to take into account what BTC does, which is the conductor of the orchestra for all ALTS.
LEVELS:
BUY: 0.0246
SELL: 0.0222
SL: 0.0222
TP: 0.0288
TP1: 0.0385
I share with you my technical analysis assessments on certain stocks that I follow as part of the strategies I design for my portfolio, but I do not recommend anyone to operate based on these indications. Get informed, train yourself and build your own strategies when investing. I just hope that my comments will help you on your own path :)
TradeX BoT (in development):
Tool to automate trading strategies designed in TradingView. It works with both indicators and graphic design tools: parallel channels, trend lines, supports, resistances... It allows you to easily establish SL (%), TP (%), SL Trailing... multiple strategies in different values, simultaneous BUY-SELL orders, conditional orders.
This tool is in the development process and the BETA will soon be ready for testing.
FOLLOW ME, and I will keep you informed of the progress we make.
Sun under the eclips?I guess not.
NYSE:SUN is currently trading at $0.03235 after a pullback from recent highs. The price is finding support near the 0.5 Fibonacci retracement level. A potential rally could target $0.04136 and $0.06034 if the bullish momentum continues. The RSI suggests the market is neither overbought nor oversold, providing room for further movement. Keep an eye on the EMAs and support levels for signs of continuation or reversal.

#SUN/USDT#SUN
The price is moving in an upward trend, which the price has relied on more than once in its rise
We have support at the 0.00750 level, from which it is expected to rise
After it is corrected a little
We also have a catalyst from the RSI indicator
We have a higher stability moving average of 100
Entry price .00764
First target 0.00861
Second goal 0.00957
Third goal 0.01060

SUN/USDT - Sun (New): Resistance_Breakout◳◱ A Resistance Breakout has been identified on the SET:SUN / CRYPTOCAP:USDT chart. The price has broken above a key resistance level, indicating a potential bullish trend. The next resistance key levels are located at 0.00585 | 0.00619 | 0.00682, and the major support zones can be found at 0.00522 | 0.00493 | 0.0043. Consider entering at the current price zone of 0.00562 and targeting higher levels.
◰◲ General info :
▣ Name: Sun (New)
▣ Rank: N/A
▣ Exchanges: Binance, Kucoin, Bybit, Huobipro, Gateio, Poloniex
▣ Category/Sector: N/A
▣ Overview: Sun (New) project overview is currently unavailable. I'll try to update this in the upcoming analysis.
◰◲ Technical Metrics :
▣ Mrkt Price: 0.00562 ₮
▣ 24HVol: 167,404.124 ₮
▣ 24H Chng: 1.627%
▣ 7-Days Chng: N/A
▣ 1-Month Chng: N/A
▣ 3-Months Chng: N/A
◲◰ Pivot Points - Levels :
◥ Resistance: 0.00585 | 0.00619 | 0.00682
◢ Support: 0.00522 | 0.00493 | 0.0043
◱◳ Indicators recommendation :
▣ Oscillators: NEUTRAL
▣ Moving Averages: STRONG_BUY
◰◲ Technical Indicators Summary : BUY
◲◰ Sharpe Ratios :
▣ Last 30D: N/A
▣ Last 90D: N/A
▣ Last 1-Y: N/A
▣ Last 3-Y: N/A
◲◰ Volatility :
▣ Last 30D: N/A
▣ Last 90D: N/A
▣ Last 1-Y: N/A
▣ Last 3-Y: N/A
◳◰ Market Sentiment Index :
▣ News sentiment score is N/A
▣ Twitter sentiment score is 0.46 - Bearish
▣ Reddit sentiment score is 0.54 - Bullish
▣ In-depth SUNUSDT technical analysis on Tradingview TA page
▣ What do you think of this analysis? Share your insights and let's discuss in the comments below. Your like, follow and support would be greatly appreciated!
◲ Disclaimer
Please note that the information and publications provided are for informational purposes only and should not be construed as financial, investment, trading, or any other type of advice or recommendation. We encourage you to conduct your own research and consult with a qualified professional before making any financial decisions. The use of the information provided is solely at your own risk.
▣ Welcome to the home of charting big: TradingView
Benefit from a ton of financial analysis features, instruments and data. Have a look around, and if you do choose to go with an upgraded plan, you'll get up to $30.
Discover it here - affiliate link -

SUN/USDT - Sun (New): Resistance_Breakout_Confirmation◳◱ A Resistance Breakout and Confirmation has been detected on the $SUN / $USDT chart. The price has broken above a key resistance level and has been confirmed by a strong candle, indicating a potential bullish trend. The next resistance key levels are located at 0.00681 | 0.00706 | 0.00767, and the major support zones can be found at 0.0062 | 0.00584 | 0.00523. Consider entering a trade at the current price zone of 0.0068 and targeting higher levels.
◰◲ General info :
▣ Name: Sun (New)
▣ Rank: N/A
▣ Exchanges: Binance, Kucoin, Bybit, Huobipro, Gateio, Poloniex
▣ Category/Sector: N/A
▣ Overview: Sun (New) project overview is currently unavailable. I'll try to update this in the upcoming analysis.
◰◲ Technical Metrics :
▣ Mrkt Price: 0.0068 ₮
▣ 24HVol: 1,255,025.500 ₮
▣ 24H Chng: 3.343%
▣ 7-Days Chng: N/A
▣ 1-Month Chng: N/A
▣ 3-Months Chng: N/A
◲◰ Pivot Points - Levels :
◥ Resistance: 0.00681 | 0.00706 | 0.00767
◢ Support: 0.0062 | 0.00584 | 0.00523
◱◳ Indicators recommendation :
▣ Oscillators: NEUTRAL
▣ Moving Averages: STRONG_BUY
◰◲ Technical Indicators Summary : BUY
◲◰ Sharpe Ratios :
▣ Last 30D: N/A
▣ Last 90D: N/A
▣ Last 1-Y: N/A
▣ Last 3-Y: N/A
◲◰ Volatility :
▣ Last 30D: N/A
▣ Last 90D: N/A
▣ Last 1-Y: N/A
▣ Last 3-Y: N/A
◳◰ Market Sentiment Index :
▣ News sentiment score is N/A
▣ Twitter sentiment score is 0.46 - Bearish
▣ Reddit sentiment score is 0.54 - Bullish
▣ In-depth SUNUSDT technical analysis on Tradingview TA page
▣ What do you think of this analysis? Share your insights and let's discuss in the comments below. Your like, follow and support would be greatly appreciated!
◲ Disclaimer
Please note that the information and publications provided are for informational purposes only and should not be construed as financial, investment, trading, or any other type of advice or recommendation. We encourage you to conduct your own research and consult with a qualified professional before making any financial decisions. The use of the information provided is solely at your own risk.
▣ Welcome to the home of charting big: TradingView
Benefit from a ton of financial analysis features, instruments and data. Have a look around, and if you do choose to go with an upgraded plan, you'll get up to $30.
Discover it here - affiliate link -

SUN after creating this base, time to goAs we can see SUN already creating base, time to breakout
Fact is about sun now :
1. ATL (all time low)
2. Strong Support $0.01170

BUY SUNUSDT on the 4 hour chart SUNUSDT looks like its moving to the upside on the 4 hour chart indicating a good entry at the moment with a 1:2 risk to reward ratio and a take profit of just over 30%.


SUNUSDT (STRONG BUY)HI.
THIS MY IDEA:
after a sudden fall there may be a sudden ascent may occur again
and boooom
billion dollars
I have allocated some of my capital to this
this is the best step

SUNUSDT Double Bottoms - Seems BullishSUNUSDT Double Bottoms - Seems Bullish
NOTE: ENTER INTO TRADE IF AND ONLY IF YOU SEE TRADING VOLUME
IN YELLOW ZONE AND MARKET CONVENCINGLY BREAKING THE LEVEL 35.5
Do proper risk and money management. Only for Spot Trading.
