SUPERUSDT Forming Falling WedggeSUPERUSDT is forming a clear falling wedge pattern, a classic bullish reversal signal that often indicates an upcoming breakout. The price has been consolidating within a narrowing range, suggesting that selling pressure is weakening while buyers are beginning to regain control. With consistent volume confirming accumulation at lower levels, the setup hints at a potential bullish breakout soon. The projected move could lead to an impressive gain of around 190% to 200% once the price breaks above the wedge resistance.
This falling wedge pattern is typically seen at the end of downtrends or corrective phases, and it represents a potential shift in market sentiment from bearish to bullish. Traders closely watching SUPERUSDT are noting the strengthening momentum as it nears a breakout zone. The good trading volume adds confidence to this pattern, showing that market participants are positioning early in anticipation of a reversal.
Investors’ growing interest in SUPERUSDT reflects rising confidence in the project’s long-term fundamentals and current technical strength. If the breakout confirms with sustained volume, this could mark the start of a fresh bullish leg. Traders might find this a valuable setup for medium-term gains, especially as the wedge pattern completes and buying momentum accelerates.
✅ Show your support by hitting the like button and
✅ Leaving a comment below! (What is your opinion about this Coin?)
Your feedback and engagement keep me inspired to share more insightful market analysis with you!
SUPERUSDT

SUPERUSDT Forming Falling WedgeSUPER/USDT is showing a strong structural setup that’s catching attention in the market. The price action appears to be forming a falling wedge, which is typically a bullish reversal pattern. Given the recent pick-up in volume and the squeeze of price inside the narrowing range, the setup suggests that we could be on the precipice of a breakout. If the breakout occurs with conviction, the potential upside is meaningful given the current base and historical levels of this asset.
From a fundamental standpoint, SUPER (the native token of SuperVerse) is positioned within the high-interest realms of Web3 gaming, NFTs, and metaverse infrastructure. It has a circulating supply in the ballpark of ~637 million tokens, placing it in a size range where upside can still be significant if adoption ramps. Its ecosystem narrative—gamefi, NFT marketplace, user friendly Web3 onboarding—maps into the high-traffic crypto search keywords right now. Strong volume and renewed investor interest suggest that the project may be waking up after a period of consolidation.
On the technical side, a clean breakout above the wedge’s upper trendline, ideally followed by a retest of that breakout level, would increase the odds of a sustained move. Given the token’s narrative and structural setup, the reward-to-risk looks interesting. Traders should monitor key resistance zones, volume confirmation, and market breadth to validate the move. If volume validates the breakout, targets could be multiples of current levels depending on the breakout momentum.

SUPER – Heavy Trend with Strong Market Cap SupportSUPER is trending heavily today, showing strong momentum and buyer interest. With a market cap just under 500M, it steps into the range where bigger investors and institutions begin to take notice, suggesting that this is more than just a typical pump-and-dump scenario.
This trend looks promising for a sustained move higher, so keeping an eye on price action and volume will be key to riding this momentum successfully.
Trade with discipline, manage your risk, and let’s see where the price goes!
Good luck and happy trading! 🚀

#SUPER/USDT The End of Pullback ?#SUPER
The price is moving within a descending channel on the 1-hour frame, adhering well to it, and is heading for a strong breakout and retest.
We have a bearish trend on the RSI indicator that is about to be broken and retested, which supports the upward breakout.
There is a major support area in green at 0.5800, which represents a strong support point.
For inquiries, please leave a comment.
We are in a consolidation trend above the 100 moving average.
Entry price: 0.5930
First target: 0.6035
Second target: 0.6123
Third target: 0.6257
Don't forget a simple matter: capital management.
When you reach the first target, save some money and then change your stop-loss order to an entry order.
For inquiries, please leave a comment.
Thank you.

SUPER/USDT – Ready for a Massive Rebound or a Sharp Breakdown?Market Overview
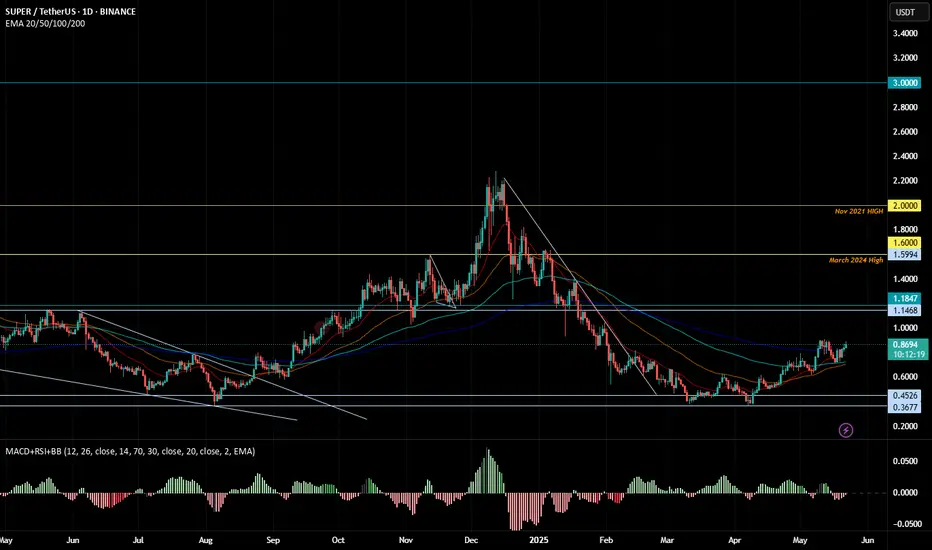
SUPER is currently trading around 0.6025 USDT, sitting right above the 0.42–0.62 historical demand zone (yellow box). This area has acted as both accumulation and distribution since 2021 — a key battleground where long-term buyers and sellers fight for dominance.
---
Weekly Structure
Major Support: The 0.42–0.62 zone is a multi-year demand zone. Price has tested it multiple times without a confirmed breakdown, signaling strong buyer defense.
Layered Resistances: If buyers hold the line, the next hurdles are 0.9004 → 1.5754 → 2.1851 → 2.6703 → 3.2979 → 4.77 (ATH).
Range-Bound Market: Since early 2024, price action has been sideways, suggesting accumulation or distribution in progress.
---
Price Action & Patterns
Lower Highs: Sellers remain in control in the short-to-mid term.
Demand Zone Rejection: Buyers continue to defend the yellow box, keeping this zone highly relevant.
Liquidity Sweep Potential: A false breakdown below 0.42 followed by a strong rebound could be the catalyst for a bullish reversal.
---
Possible Scenarios
Bullish Case (Rebound & Breakout)
Confirmation: Weekly close above 0.9004.
Targets:
T1 = 0.9004 (+49% from current price).
T2 = 1.5754 (+161%).
T3 = 2.1851 → 2.6703 → 3.2979 (extended targets).
Narrative: If buyers defend the demand zone and break 0.90, SUPER may enter a markup phase, potentially triggering FOMO-driven rallies.
Bearish Case (Breakdown & Capitulation)
Confirmation: Weekly close below 0.42.
Targets:
T1 = 0.25 (psychological support).
T2 = 0.07 (all-time low).
Narrative: A breakdown of this demand zone would signal buyer exhaustion. Sellers could then push price into deeper liquidity zones.
---
Trading Strategy & Risk Management
1. Aggressive Traders
Consider entries within 0.42–0.62 with tight stops below 0.42.
Conservative target: 0.90 (Risk/Reward ≈ 1:1.5).
2. Conservative Traders
Wait for a confirmed breakout above 0.90.
Entry on retest of 0.90 → Target 1.57 (Risk/Reward >1:4).
3. Risk Notes
Never go full size at support without confirmation.
Limit risk per trade to 1–2% of portfolio.
Watch volume and weekly close for confirmation.
---
Conclusion
SUPER is at a make-or-break level. As long as 0.42–0.62 holds, the potential for a +100% move toward 1.57 remains strong. But if this zone fails, a deeper drop to 0.25 or even 0.07 becomes possible.
Key takeaway: Weekly close above 0.90 = bullish phase. Weekly close below 0.42 = bearish phase.
---
Price is consolidating at the 0.42–0.62 demand zone.
Bullish: Hold & break 0.90 → targets 1.57+.
Bearish: Breakdown <0.42 → targets 0.25 → 0.07.
This zone = “do or die” for SUPER.
---
#SUPER #SUPERUSDT #Crypto #Altcoin #TechnicalAnalysis #PriceAction #SupportResistance #BullishScenario #BearishScenario #SwingTrading

SUPERUSDT Forming Bullish DescendingSUPERUSDT is currently showing strong potential as it forms a bullish descending channel pattern, a setup that often signals an upcoming breakout after a period of consolidation. This technical structure suggests that the recent downtrend may be approaching exhaustion, with a reversal on the horizon. Based on the chart projection, SUPERUSDT could deliver gains in the range of 80% to 90%+ once it confirms a breakout to the upside.
The trading volume remains supportive, reflecting steady participation from buyers. This is a key indicator of market interest, as consistent volume often precedes strong directional moves. If buying momentum continues to increase, the breakout from this channel could be sharp and sustained, driving the price toward higher targets.
Investor sentiment around SUPERUSDT is improving as traders begin to recognize the technical strength of this setup. The coin’s resilience during market volatility has also caught attention, with many positioning themselves early to capitalize on the possible rally. This growing interest helps strengthen liquidity and further validates the bullish outlook.
Overall, SUPERUSDT is entering a critical stage where price action aligns with technical indicators to suggest a strong upward move. With its descending channel pattern nearing completion, solid volume, and rising investor attention, the coin has the potential to generate substantial returns in the near term.
✅ Show your support by hitting the like button and
✅ Leaving a comment below! (What is You opinion about this Coin)
Your feedback and engagement keep me inspired to share more insightful market analysis with you!

SUPER | Major Support Retest — Spot Long SetupSUPER is currently testing a significant support zone, potentially setting the stage for a bullish reversal or bounce.
📌 Entry Zone: $0.70 – $0.75
🎯 Targets:
• TP1: $0.90 – $0.95
• TP2: $1.10 – $1.15
• TP3: $1.40 – $1.45
🛑 Stop Loss: Just below $0.66
This support region has held well in the past — if it holds again, we could see a strong upward move. Look for confirmation and volume uptick before entering.
📈 Risk management is key — plan your trade, trade your plan.

Smart Money Trap Identified! FVG + Liquidity Grab“Smart Money Trap Identified! FVG + Liquidity Grab Before Super USD Skyrockets to Target Zone ”
⸻
🧠 Technical Breakdown:
1. Liquidity Sweep (Manipulation Phase):
We see price aggressively sweep local liquidity around July 23, likely triggering stop-losses of early longs or breakout traders. This is a classic Smart Money trap, where big players induce volatility to grab liquidity before a move in the real direction.
2. Fair Value Gap (FVG):
A clear bullish FVG (imbalance) has formed post-liquidity grab, suggesting a potential institutional entry zone. This imbalance typically acts as a magnet for price and an entry point for Smart Money after manipulation.
3. Demand Zone & Target Projection:
• Price is now reacting from a well-defined Demand Zone, with clear rejection wicks indicating aggressive buying interest.
• The target zone (0.88334882) sits just below a previous supply zone, aligning with a potential distribution area where Smart Money may begin profit-taking.
4. Supertrend Indicator:
The supertrend has flipped bullish, confirming potential momentum shift, supporting the bullish bias as long as the FVG holds.
5. Confluence Factors:
✅ Liquidity Grab
✅ FVG Reaction
✅ Demand Zone Bounce
✅ Supertrend Confirmation
✅ High-Risk/High-Reward Entry Before Smart Money Run
⸻
🎯 Trade Idea (For Educational Purpose Only):
• Entry: On pullback into the FVG zone
• Stop Loss: Below the recent swing low or Demand Zone
• Target: 0.8833 (inside the upper supply/demand imbalance)
⸻
🧠 Educational Note:
This chart beautifully showcases how market makers operate — manipulate liquidity, fill imbalances, and target inefficiencies. Always think like Smart Money, not retail traders.

SUPER Breakout Incoming or Just Another Trap Before the Flush?Yello, Paradisers is SUPER about to explode out of this structure, or are we being lured into a fakeout before the next rug pull? This setup is too clean to ignore, and the next few candles will tell us everything.
💎The daily chart on #SUPERUSDT reveals a well-respected descending channel that has dictated price action for over two months. After multiple rejections from the upper boundary and rebounds off the lower trendline, the price has now shown its first serious signs of momentum since bottoming in the strong demand zone around $0.45–$0.50. This zone has held firmly, marking the third time price has bounced from this key level a textbook area of interest where buyers consistently step in.
💎What's notable here is the confluence between the demand zone and the descending support line. The most recent bounce was not only from this dual-support area, but also accompanied by a shift in momentum that has pushed the price back toward a critical inflection point the resistance-turned-support zone at $0.58–$0.62. This level has acted as resistance before and now becomes the level to reclaim for the bullish scenario to stay valid.
💎If the price breaks and closes above the upper boundary of the descending channel and holds above the $0.60–$0.62 region, the path opens toward the moderate resistance at $0.75. Should bullish momentum continue, we could be looking at a retest of the psychological and historical strong resistance zone near the $1.00 mark where we’d expect both aggressive profit-taking and liquidity to build up.
💎On the flip side, any failure to break out and sustain above the current resistance would likely send price back down to retest the demand zone. If the structure gives in and closes below $0.45 on the daily timeframe, this would invalidate the bullish thesis completely and could trigger a sharper drop toward $0.35 or even lower as the broader market liquidates over-leveraged longs.
MyCryptoParadise
iFeel the success🌴

SUPER - Getting ready for the super run- Price is trading near the resistance after forming higher high.
- it's highly likely that price will get rejected around the resistance and will form another higher high.
- this is an excellent opportunity for us to enter the trade.
Entry Price: 0.7322
Stop Loss: 0.5344
TP1: 0.8939
TP2: 1.0517
TP3: 1.2867
TP4: 1.6336
TP5: 2.2243
Max Leverage 5x.
Don't forget to keep stoploss.
Support us by Liking and following.
Thanks and Cheers!
GreenCrypto

[UPD] Trend analysis: BTC / ETH / SOL / XRP and other Just recorded a new video overview of the crypto market and the current trend developments in major coins: CRYPTOCAP:BTC , CRYPTOCAP:ETH , CRYPTOCAP:SOL , CRYPTOCAP:XRP , CRYPTOCAP:LINK , GETTEX:HYPE , BSE:SUPER , $FLOKI.
Among the new assets on my radar I shared my view on the trend structure of $RENDER.
In my personal investment planning, I continue to treat any potential corrections into key support zones as opportunities to add or open new positions.
Thank you for your attention and I wish you successful trading decisions!
If you’d like to hear my take on any other coin you’re tracking — feel free to ask in the comments (just don’t forget to boost the idea first 😉).

SUPER = BACK WITH SUPER EFFECT - MOON SHOTSuper can show in the coming time frames an interesting view.
When there is confirmations, will add below this update.

[UPD] BTC / ETH / SOL / XRP / HYPE / SUPER / FLOKIUpdating my view on intermediate trend structures I am tracking in CRYPTOCAP:BTC , CRYPTOCAP:ETH , CRYPTOCAP:SOL , CRYPTOCAP:XRP , GETTEX:HYPE , BSE:SUPER and SEED_DONKEYDAN_MARKET_CAP:FLOKI highlighting key support and resistance zones to watch in the coming sessions
Charts featured in the video:
BTC
ETH
XRP
SOL
HYPE
SUPER
FLOKI
Thank you for your attention and I wish you successful trading decisions!
If you’d like to hear my take on any other coin you’re tracking — feel free to ask in the comments (just don’t forget to boost the idea first 😉).

SuperVerse "Above Water," Higher Highs With A Solid BaseHere we have a really long-term support. In May and June 2021 SuperVerse (SUPERUSDT) found support at the same level as in August 2024 and March/April 2025. Amazing.
Back in 2021 SUPERUSDT was coming down from a high point and this support zone worked to produce a small bounce before a long-term market bottom was established. SuperVerse went 'below water' for 560 days. Once back 'above water' the bulls have the upper hand and this is where the action is happening today.
In simple terms, the bullish zone. SUPERUSDT confirmed recently its long-term support producing higher highs with a solid base. The bottom is flat but the peaks become higher with each bullish wave. This is to say that the next high will be a major new high and the biggest ever for this pair-project.
SuperVerse has never experienced what it is about to experience. It started in a bear market and it did good in late 2023, but 2023 was the recovery year, part of a long-term transition between bear and bull.
Now the year is 2025 and this is the bull market year. Notice that between 2022 and 2023 SUPERUSDT traded below water. In 2024 and 2025 it trades above water. We are about to experience the best yet.
Prepare for maximum growth.
SuperVerse will go higher than the easy target shown on the chart. Much higher.
Namaste.

SUPER Long Setup – Confluence of Fibonacci and Major SupportSUPER has retraced into a strong confluence zone, aligning with the 61.8% Fibonacci level and a major support area. The $0.55–$0.58 range offers a solid opportunity to enter a long swing trade.
📌 Trade Setup:
• Entry Zone: $0.55 – $0.58
• Take Profit Targets:
o 🥇 $0.75 – $0.90
o 🥈 $1.05 – $1.20
• Stop Loss: Daily close below $0.50

#SUPER/USDT#SUPER
The price is moving within a descending channel on the 1-hour frame, adhering well to it, and is heading for a strong breakout and retest.
We are seeing a bounce from the lower boundary of the descending channel. This support is at 0.7294
We have a downtrend on the RSI indicator that is about to be broken and retested, supporting the upward trend.
We are looking for stability above the 100 Moving Average.
Entry price: 0.8327
First target: 0.8729
Second target: 0.9236
Third target: 0.9953

#SUPER/USDT#SUPER
The price is moving in a descending channel on the 1-hour frame and is adhering to it well and is heading to break it strongly upwards and retest it
We have a bounce from the lower limit of the descending channel, this support is at a price of 0.7300
We have a downtrend on the RSI indicator that is about to break and retest, which supports the rise
We have a trend to stabilize above the moving average 100
Entry price 0.7624
First target 0.7835
Second target 0.8057
Third target 0.8280

SUPER about to rip over $1It's ALT SZN baby, Super along with all other alts is about to pump through previous targets, we will be back over 1$ soon then we can revisit other prev targets
TAO ANALYSIS📊 #TAOAnalysis
✅There is a formation of Descending Channel Pattern in daily time frame in #TAO .
Also there is a perfect breakout and retest. Now we can expect a bullish move. If the price sustains the major resistance zone then we will see more bullish move
👀Current Price: $349
🎯 Target Price : $460
⚡️What to do ?
👀Keep an eye on #TAO price action and volume. We can trade according to the chart and make some profits⚡️⚡️
#TAO #Cryptocurrency #Breakout #TechnicalAnalysis #DYOR

Is This The End of Pullback?BINANCE:SUPERUSDT has entered the support zone between 0.5142 – 0.4754 after a strong impulsive move to the upside.
This support zone is considered valid due to multiple rejections that occurred within this area in the past—indicating strong buyer interest.
Ideally, this is where we expect price to bounce and resume the bullish trend. The first sign of confirmation would be a break above 0.5272, which may open the path toward higher targets.
However, the bullish scenario remains valid only if the price stays above 0.4983—a key invalidation level.
Note:
If this level is breached before a clear candlestick confirmation, the candle pattern being used to validate the move becomes invalid.
Even if the price breaks below the invalidation level, as long as it remains within the support zone, the support is still valid — but it would require the formation of a new bullish candlestick pattern to re-confirm the potential for an upward move.

Buyers Still in Control?Price surged from 0.4000, broke the previous high, and reached the 0.4852 resistance level. The current sideways movement around the resistance suggests that sellers lack the strength to push the price lower. Even if a pullback occurs, the 0.4579 – 0.4455 area is expected to act as a support zone, potentially holding the price and allowing the uptrend to continue toward 0.5534 – 0.5652.

Trading opportunity for SUPERUSDTBased on technical factors there is a Sell position in :
📊 SUPERUSDT
🔴 Sell Now
🪫Stop loss 0.6550
🔋Target 0.3925
📏 R/R 1,8
💸RISK : 1%
We hope it is profitable for you ❤️
Please support our activity with your likes👍 and comments📝

$SUPER Wyckoff Accumulation – Schematic #1 or #2 in PlayBSE:SUPER Wyckoff Accumulation – Schematic #1 or #2
My base case at the moment is Wyckoff Accumulation Schematic #2 , where the Secondary Test ( ST-B ) could mark the very bottom. This idea will be validated for me especially if we see interaction with the High Time Frame VAL .
Green Zone:
We have confluence with VAL and Green TRP Zone from HTF ReAccumulation idea.
High Time Frame Wyckoff ReAccumulation Idea:
