SUPRA 5D – Long-Term Downtrend Testing Key Support ZoneSummary:
SUPRA continues its multi-month downtrend, making lower highs and lower lows since early 2025. Price is currently sitting directly on a major support band around 0.00100–0.00107, a level that has historical relevance on this higher timeframe. With the 35 EMA and 205 EMA both trending sharply downward, the macro structure remains bearish until proven otherwise — but this is also the type of zone where relief bounces often originate.
📉 Market Structure: Clear Long-Term Downtrend
SUPRA has been in a persistent decline for months, respecting every lower-timeframe breakdown and failing to reclaim prior support levels.
Candle structure on the 5D chart remains weak, with sellers defending every rally attempt.
Both EMAs (35 & 205) are sloping downward, confirming long-term bearish momentum.
This remains a downtrend until price can reclaim and close above significant resistance zones.
📌 Key Levels
🔻 Immediate Support Zone (Current Area)
0.0010711 (current trading region)
0.0010031 (major support)
This zone is critical — a breakdown below 0.0010031 opens the door to new lows and potential capitulation.
🔺 Overhead Resistances to Watch
These are the levels SUPRA must reclaim to shift sentiment:
0.0013750 – first major resistance above current price
0.0019159 – breakdown origin area
0.0046222 – high-timeframe supply zone
0.0079712 – major structural resistance
0.0130722 – long-term bearish retest level
0.0566736 & 0.0800169 – historical high liquidity zones
📊 EMA Signals
35 EMA: Trending steeply down, acting as dynamic resistance since mid-year.
205 EMA: Deeply above price, confirming long-term bearish macro environment.
A true reversal isn’t confirmed until price begins closing above the 35 EMA on the 5D — a level that SUPRA has failed to reclaim for months.
📈 What to Expect
Bullish Scenario (Risky, Counter-Trend)
SUPRA holds above 0.00100 support
Price forms a higher low on the 5D
A reclaim of 0.0013750 would signal first signs of exhaustion in the downtrend
Break and close above the 35 EMA → potential mid-term rally toward 0.0019159 and possibly 0.0046222
Bearish Continuation Scenario (Most Likely Until Proven Otherwise)
Breakdown below 0.0010031
Momentum continues downward, possibly forming new lows
Macro structure remains bearish unless major resistance levels are reclaimed
📌 Trade Thesis
SUPRA is sitting on a critical support cluster after a prolonged multi-month downtrend. The trend is still decisively bearish, with price trading far below both major EMAs. However, this support zone has the potential to act as a short-term reaction level.
Bullish traders will look for a relief rally from this zone.
Bearish traders will look for a clean breakdown to continue the macro trend.
Supra

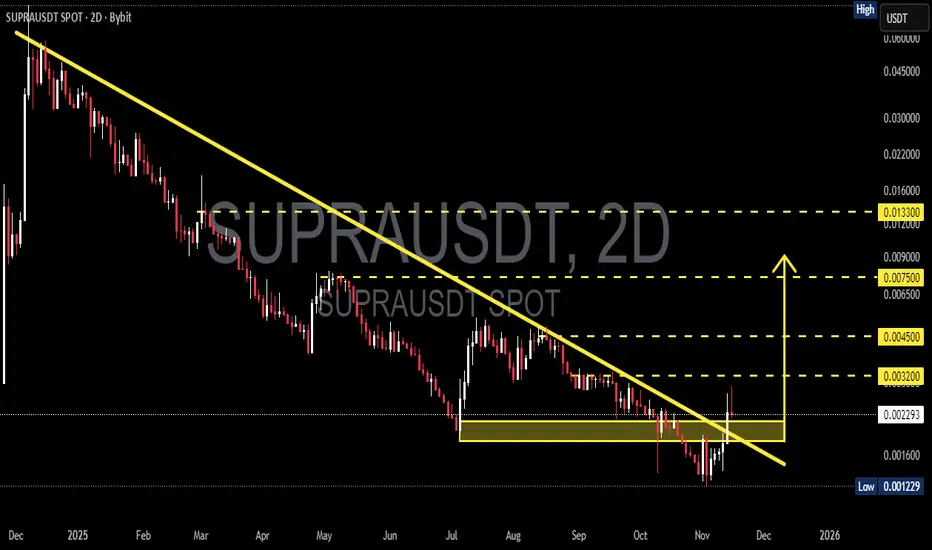
SUPRA/USDT — Trendline Breakout at Critical: Is Major Reversal?SUPRA has spent nearly a full year trapped under a relentless descending trendline—each rally attempt crushed, each bounce rejected. But for the first time since early 2025, the 2-day candle has broken above the dominant descending trendline, signaling a potential structural shift in market momentum.
This breakout occurred precisely after SUPRA revisited the major demand block at 0.00215–0.00180, a region that has repeatedly acted as the survival zone for this asset. The reaction from this area suggests renewed accumulation and a clear transfer of strength from sellers back to buyers.
SUPRA is now entering the most critical stage of its 2025 chart structure:
Is this a genuine trend reversal—or just another liquidity trap disguised as a breakout?
---
PATTERN STRUCTURE: “Descending Trendline Break + Demand Zone Rejection”
This combination is historically one of the strongest reversal structures, especially after prolonged downtrends.
1. Descending Trendline Breakout
The yellow trendline has suppressed price since early 2025.
The 2D breakout is a strong early reversal signal.
However, the wick on the breakout candle shows that sellers aren’t fully gone—momentum still needs confirmation.
2. Strong Demand Block (0.00215–0.00180)
This yellow box represents
high-volume reaccumulation,
liquidity sweeps,
structural support
that has repeatedly reset the market’s short-term direction.
3. Mid-Term Market Structure Shift (MSS)
A breakout + higher low formation near demand suggests the foundation of a larger bullish transition.
---
Bullish Scenario: “The Ingredients of a Full Trend Reversal”
SUPRA may be forming the early stages of a multi-week bullish reversal if the following conditions are respected:
1. Holding Above 0.00215
This is the line between “breakout confirmed” and “breakout failed.”
2. Successful Retest of Trendline or Demand Zone
A clean rejection wick from this zone would signal buyers stepping in aggressively.
3. Bullish Targets Based on Chart Structure
If the breakout is real, SUPRA has a clear ladder of upside targets:
Target Description
0.00320 First resistance / short-term reaction zone
0.00450 Major historical supply area
0.00750 Mid-range structural resistance
0.01330 Full trend reversal target
Bullish Narrative
A stable 2D close above 0.00230–0.00250 would mark the beginning of a mid-term trend reversal, opening the path toward multi-target rallies.
---
Bearish Scenario: “False Breakout Liquidity Trap”
Despite the breakout, danger remains:
1. Closing Below 0.00215
This would signal weakness and invalidate early bullish momentum.
2. Closing Below 0.00180 (Major Breakdown)
If the candle closes below the lower demand boundary, SUPRA risks sliding toward:
0.00123 (the next major low on the chart)
or even forming new lower lows
Bearish Narrative
If sellers reclaim the demand zone, the reversal collapses and the long-term downtrend resumes.
---
Summary
SUPRA is at one of its most defining technical moments of 2025.
The trendline breakout is only the first chapter of this story—the real decision will be made at the 0.00215–0.00200 retest.
If the zone holds, SUPRA isn’t just escaping a downtrend—it may be entering a full multi-week reversal phase aimed at 0.00320 → 0.00450 → 0.00750 and beyond.
But if it closes below 0.00180, the entire bullish structure erases and the downtrend resumes.
---
#SUPRA #SUPRAUSDT #CryptoAnalysis #Breakout #TrendlineBreak #Altcoin #MarketStructure #DemandZone #ReversalSetup
SUPRAUSDT UPDATE#SUPRA
UPDATE
SUPRA Technical Setup
Pattern: Falling Wedge Pattern
Current Price: $0.00293
Target Price: $0.00615
Target % Gain: 144.78%
Technical Analysis: SUPRA has broken out of a falling wedge pattern on the 1D chart, showing strong bullish momentum as price moves above the upper trendline. The breakout is supported by increasing volume and a clear shift in market structure, suggesting buyers are taking control. If momentum continues, price may push toward the projected target near $0.00615.
Time Frame: 1D
Risk Management Tip: Always use proper risk management.

garbage!!!idk why everyone loves this token. 55M market cap and 392M full diluted. thats less than 15% of all tokens. and the chart looks like trash. why would you buy this???
chart pattern is garbage lol
SUPRA Setting Up For Big Move UpThe 2 day chart on Supra looks as if it has bottomed. With some volume we could really see an explosive move to .014 in the short term.
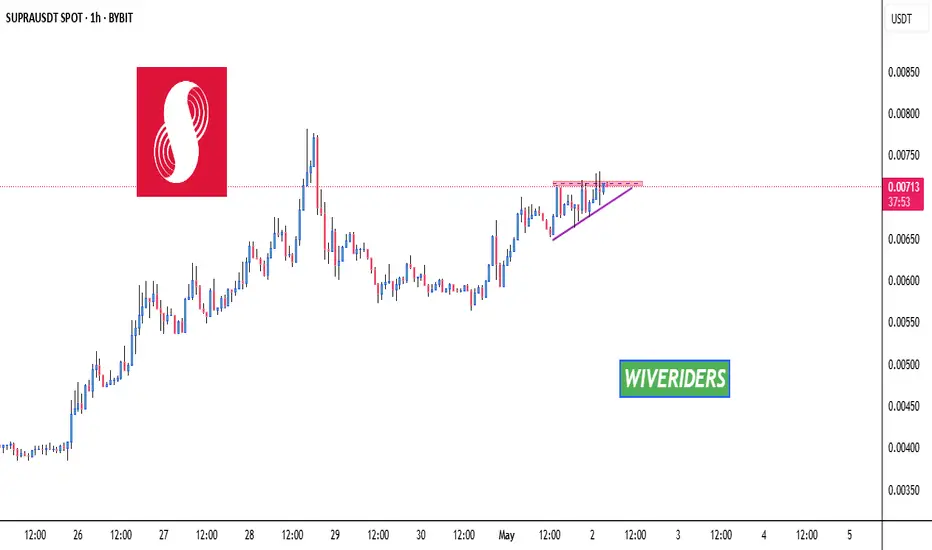
SUPRA is forming an ascending triangle patternSUPRA is forming an ascending triangle pattern and is approaching a key red resistance zone. A breakout above this level could confirm the bullish pattern and signal a strong upward move.
📈 Technical Overview:
Pattern: Ascending Triangle
Resistance Zone: Red area currently being tested.
🎯 Breakout Target: To be determined upon confirmation of the breakout.
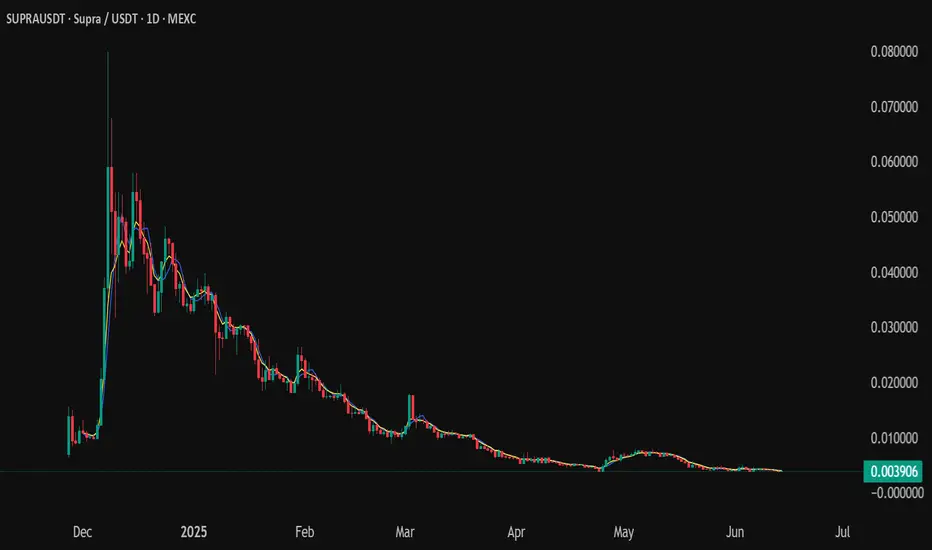
Supra: Your Altcoin ChoiceThis Supra chart is barely four months old, so it doesn't meet our criteria of at least 6 months for a technical analysis, but the project looks good and the chart is easy to read. I had a good feeling as soon as I opened the chart so let's look into it anyway. It is my pleasure to do these analysis for you.
There is a perfect downtrend on this SUPRAUSDT chart and this is always quite revealing. Knowing that a downtrend is present we know that at some point the market must change course. This point in time is now.
The All-Time Low came on 3-April. Notice how as soon as April starts volume starts to rise. This is the signal. Low prices, a new ATL and then suddenly, action. Whales are buying.
This increase in trading volume reveals that a support level has been found and is being established. Looking at the rest of the market, we know that this support will hold and a reversal comes next. Also, trading volume continues to rise and the candles are now turning green. This is positive, this is bullish. There is good potential for growth.
That's it. It is a young chart so there isn't much more.
The downtrend will lead to sideways. Sideways lead to bullish growth.
Many targets can be seen mapped on the chart based on Fibonacci proportions. Growth potential goes beyond 3,000% or more for the 2025 ATH. Truly, impossible to tell. This pair/project might grow 5,000%, 10,000% or who knows. When new projects are launch preceding a bull market, anything goes.
Here I am mapping some short-term targets. You take care of the rest.
This project is likely to grow really strong in the coming months.
Thank you for reading.
Your support is appreciated.
All Altcoins Choice requests have been fulfilled.
Namaste.

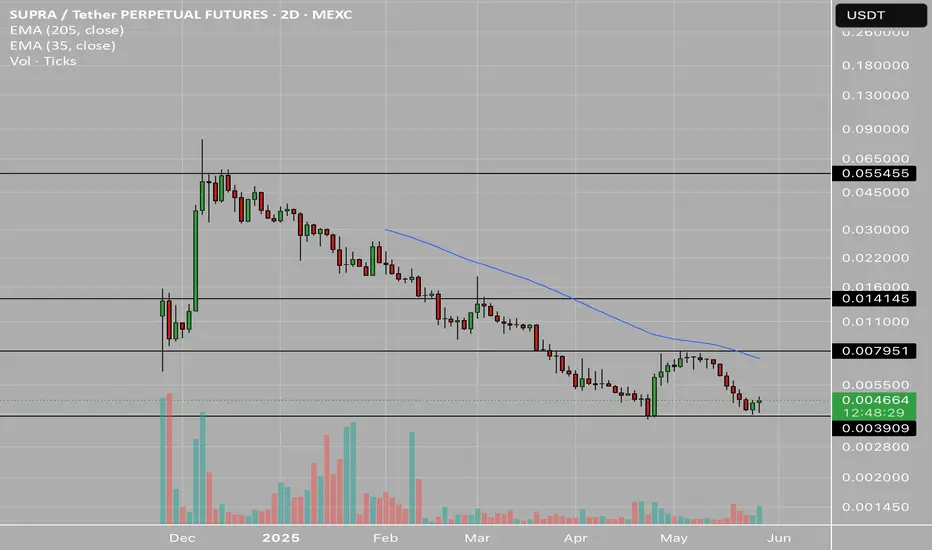
SUPRA chart updated analysisThis is a follow on from previous SUPRA analysis here:
Left chart:
Price holding the possible reversal bullish divergence forming along pink trendlines.
EMA8 blue line is still holding price down and the Stoch RSI is back to bearish zone.
Right chart:
I drew in a different trendline(green) on this chart to show either left or right chart green trendline are valid.
The RSI and LMACD still have no bullish signs as mentioned in previous analysis as to what we want to see here.
Overall, SUPRA is still in a downtrend and if the bullish divergence fails, then the green fib pocket on right chart could be hit at 0.01
If the bullish divergence plays out price must breakout through resistances shown, then get past 0.022 and then above 0.0265
Any big bullish move will get stopped at 0.03252
Where do you think price will go from here, down or up?
Don't forget to hit that like rocket button!

SUPRA chart analysisSo far I have called every move on SUPRA since joining the SUPRA tribe.
What we see on this chart is SUPRA is in a downtrend still rejecting off fib pocket each time. I have not shown the fib indicators here to show this as the chart would be too messy.
On the Stoch RSI we can see each time it crosses up as shown by the orange vertical lines, the price on the chart goes from the yellow arrow to the % as shown by the green price ranges.
The Stoch RSI needs to get above 40 as it has not done so yet and this will break SUPRA out of the downtrend. Also the normal RSI is in a downtrend also as you can see.
On the chart the 0.03252 yellow line is major resistance as well as the current green trendline keeping SUPRA in a downtrend.
The current cross of the Stoch rsi shows an upward move already on the price chart and the estimated target which is exactly where the fib pocket is. If reject there price goes lower to 0.016
Do not forget to smash that rocket like button!

SUPRA/USDT targeting $0.25A repeat of Supra's recent run would be a 500% return.
SUPRA stands out with its high-performance blockchain, capable of 500,000 TPS, making it incredibly scalable for dApps. Its Moonshot Consensus ensures low latency, potentially attracting more developers to its ecosystem. The platform's vertical integration, including native oracles and VRFs, reduces external dependency, enhancing efficiency and security. HyperNova technology offers secure cross-chain communication without bridges, positioning SUPRA as a key player in blockchain interoperability. Significant investor backing fuels further development and ecosystem growth through initiatives like the "Super dApp Showdown." Offering decentralized oracle services within its Layer-1, SUPRA could become essential for DeFi, driving token demand. These features collectively suggest SUPRA/USDT could be a strong hold for those looking at utility and growth in the crypto market.
