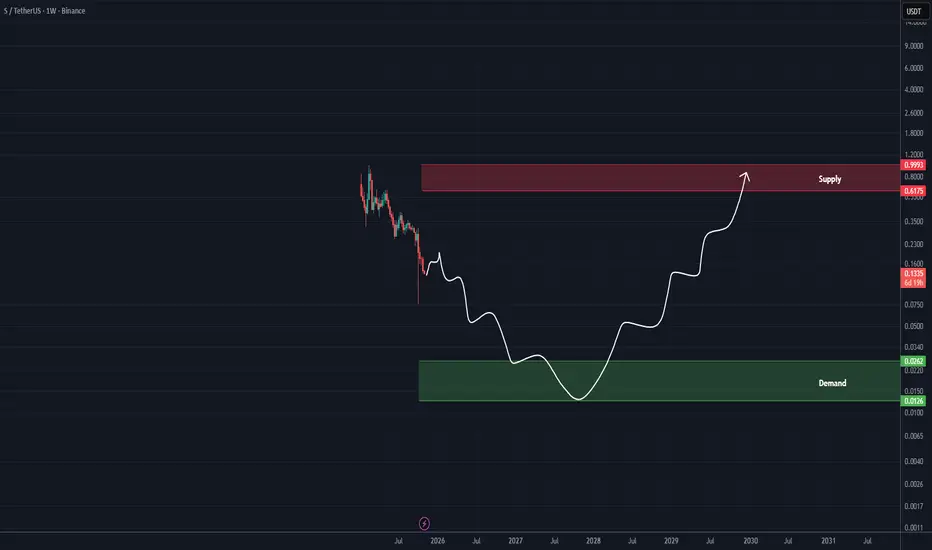
S Analysis (1W)Based on the complete data of this coin | which is not fully available in this chart —
From the point where we placed the red arrow on the chart, the major corrective wave S has begun.
It appears that an ABC pattern has formed on the weekly timeframe, where wave B was a completed diametric structure.
We are now in the large C wave, which is expected to be a long and time-consuming move both in price and duration, likely to complete within the green zone.
This is our outlook on S.
For risk management, please don't forget stop loss and capital management
When we reach the first target, save some profit and then change the stop to entry
Comment if you have any questions
Thank You
Susd
S/USDT The Big Test at the Trendline — Rebound or Rejection?🔎 Overview
The price action of S/USDT remains under pressure from a long-term downtrend, marked by the descending trendline (yellow) that has consistently capped every rally attempt since early this year.
After bouncing from the 0.2219 major low, price has shown a solid rebound and is now testing the critical confluence resistance zone at 0.2984 – 0.31.
This area is a make-or-break level: will buyers manage a breakout to end the seller’s dominance, or will the trendline reject price once again?
---
🧩 Structure & Pattern
1. Descending Trendline
– A clear series of lower highs confirms seller dominance.
– Each rally attempt has been rejected at this line.
2. Key Supports
– 0.2219 → the major swing low and critical downside level.
– Minor support zone: 0.260 – 0.244.
3. Layered Resistances
– 0.2984 (current test) → the first breakout checkpoint.
– 0.3531 – 0.3946 → next upside targets if breakout holds.
– 0.6088 – 0.8650 → major resistance levels, potential rally zone in the mid-term.
---
📈 Bullish Scenario (If Breakout Holds)
Confirmation: Daily close above 0.2984–0.31 with strong volume.
Entry Idea: Buy on retest of the breakout zone.
Upside Targets:
TP1 → 0.3531
TP2 → 0.3946
TP3 → 0.6088
Stop Loss: Below 0.28 (or below the retest low).
Narrative: A breakout from the descending trendline could signal the first step of a trend reversal, opening the path for further bullish momentum.
---
📉 Bearish Scenario (If Rejection Happens)
Confirmation: Bearish rejection candle (engulfing / pinbar) around 0.298–0.31.
Entry Idea: Short/sell after confirmation of rejection.
Downside Targets:
TP1 → 0.260–0.244
TP2 → 0.2219 (major low)
Stop Loss: Above 0.31–0.33.
Narrative: As long as price remains below the trendline, the broader bearish structure is intact. Rejection here may trigger continuation towards the lows.
---
📝 Conclusion
The 0.298–0.31 zone is a major battleground between bulls and bears.
A confirmed breakout could shift momentum towards 0.3531–0.3946.
A rejection, however, keeps downside risk alive with targets back to 0.2219.
Best strategy: Wait for daily close + volume confirmation before committing to major positions.
---
📌 Key Levels to Watch
Support: 0.2884 → 0.260–0.244 → 0.2219
Resistance: 0.2984 → 0.3531 → 0.3946 → 0.6088 → 0.8650
---
#SUSDT #CryptoAnalysis #Altcoin #TechnicalAnalysis #TrendlineBreakout #BearishVsBullish #CryptoTrading #SwingTrade #SupportResistance

FTM/USDT S/USDT Update Considering the failure to break the dynamic resistance and the breakdown of the triangle in this wave, it seems that we have been experiencing an Elliott corrective pattern, as illustrated on the chart. To confirm the validity of this pattern, the dynamic resistance must be broken. I place significant weight on this breakout, especially since there are at most two months left until the end of the current cycle, and such confirmation could play a decisive role in the market’s next direction.

Sonic Near Strong Support, Eyes 15% Rally Toward $0.36 TargetHello✌️
Let’s analyze Sonic’s price action both technically and fundamentally 📈.
🔍Fundamental analysis:
Sonic Token’s Fee Monetization lets developers keep up to 90% of fees their apps make, boosting growth by rewarding active builders. This approach helped other projects grow 20-40% TVL early on.🚀
📊Technical analysis:
BINANCE:SUSDT shows solid volume near a strong daily support; if it holds, a 15% upside toward $0.36 looks likely. Watching this level is key for a potential bounce.📊🔍
✨We put love into every post!
Your support inspires us 💛 Drop a comment we’d love to hear from you! Thanks, Mad Whale

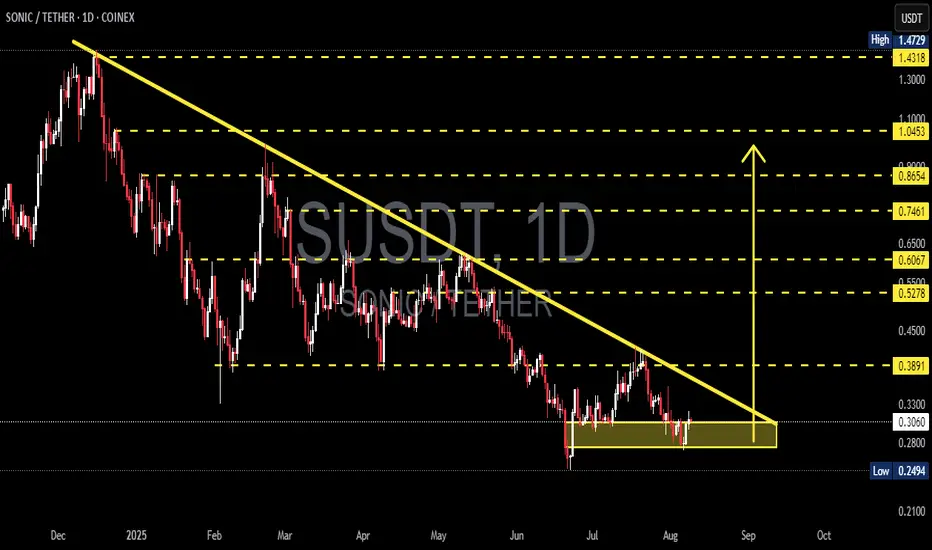
SONIC/USDT — Descending Triangle at Key Support!Overview
The daily chart shows a clear medium-term downtrend (well-defined descending trendline) meeting a strong horizontal support zone around 0.25–0.31 USDT (yellow box). Current price ≈ 0.3059 USDT. This structure forms a descending triangle or accumulation range, signaling that the market is in a decision phase — either a bullish breakout or a bearish continuation.
---
Key Levels
Current Price: 0.3059
Support Zone: 0.2494 – 0.305 (historical low at 0.2494)
Descending Trendline Resistance: ~0.33–0.35 (dynamic)
Next Resistances: 0.3891, 0.5278, 0.6067, 0.7461, 0.8654, 1.0453
Breakdown Measured Target: ~0.11 (if 0.2494 breaks)
Potential % moves from current price:
To 0.3891 ≈ +27.2%
To 0.5278 ≈ +72.5%
To 0.2494 ≈ −18.5%
To 0.11 ≈ −64%
---
Pattern & Interpretation
Main Pattern: Descending trendline + horizontal support = descending triangle (bearish bias unless broken to the upside).
Bearish Signal: Lower highs structure, price still under the descending trendline, supply pressure dominant. A daily close below 0.2494 with high volume = breakdown confirmation.
Bullish Signal: Daily close above the trendline (~0.33–0.35) with strong volume, followed by a successful retest = breakout confirmation. Extra confirmation if price breaks and holds above 0.3891.
---
Scenarios
Bullish
1. Break & daily close above trendline (~0.33–0.35) with rising volume.
2. Retest holds as support.
3. Targets: 0.3891 (+~27%), then 0.5278 (+~72%).
4. Stop-loss: below support box (~0.28 or safer < 0.2494).
Bearish
1. Daily close below 0.2494 with strong volume = breakdown.
2. Measured move target ≈ 0.11.
3. Conservative target: psychological zones 0.18–0.15.
4. Stop-loss for shorts: above 0.305–0.33.
---
Trading Notes
Conservative Long: Wait for breakout & retest above trendline.
Aggressive Long: Enter near support (0.26–0.30) with tight stop below 0.2494.
Short: Only after confirmed breakdown below 0.2494.
Always watch daily close + volume to avoid false signals.
---
Conclusion
Current trend is bearish, but the strong 0.25–0.31 support keeps the possibility of a short-term rebound alive.
Decision point: Breakout above 0.35 → bullish rally, Breakdown below 0.2494 → extended sell-off.
Risk management is key — use stop-losses and position sizing.
#SONIC #SONICUSDT #CryptoAnalysis #SupportResistance #DescendingTriangle #Breakout #Altcoin #RiskManagement
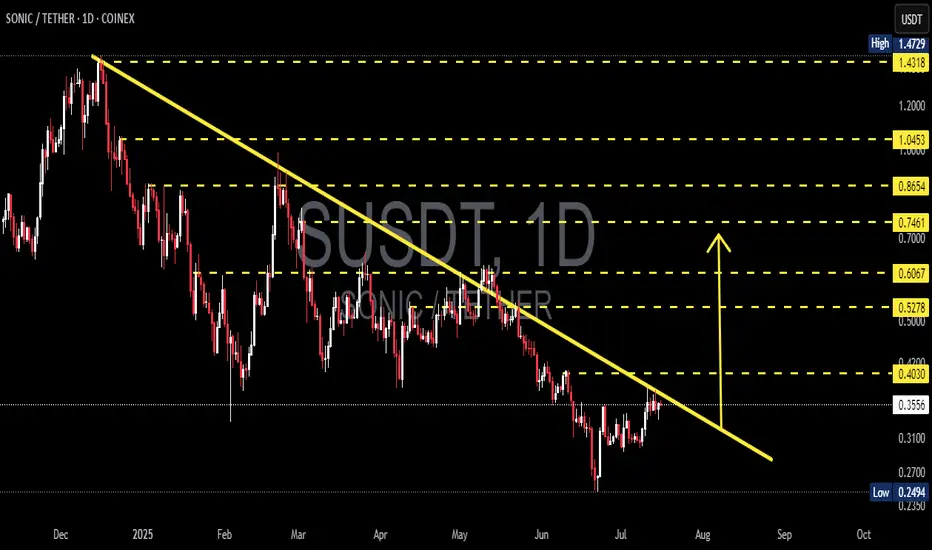
SONIC/USDT Breakout in Progress? Watch This Critical Level Close🧠 Technical Breakdown – Daily Chart (1D, Coinex)
The SONIC/USDT pair is currently exhibiting a textbook descending trendline breakout setup, formed over the past 7+ months. This long-term downtrend has been respected since late November 2024, connecting multiple lower highs and establishing a well-defined bearish structure.
However, recent price action shows a potential trend reversal as the pair consolidates tightly near the apex of the structure, with signs of breakout momentum building.
📐 Pattern Identification:
✅ Falling Wedge / Descending Triangle
✅ Continuous lower highs connected by a descending trendline
✅ Support held above $0.25 (strong demand zone)
✅ Price now testing the upper boundary of the trendline
This is a classic bullish reversal pattern—especially when price breaks out after long-term compression.
🚀 Bullish Scenario:
Should SONIC successfully break and close above the $0.4030 level (trendline + horizontal resistance), it could unlock a wave of bullish momentum. Here are the key upside targets based on Fibonacci retracement from the previous high ($1.4729) to the local low ($0.2494):
🎯 Resistance Level Significance
$0.5278 0.382 Fib – First major target post-breakout
$0.6067 Key confluence level – psychological barrier
$0.7461 0.618 Fib – Bullish continuation zone
$0.8654 High momentum extension
$1.0453 0.786 Fib – Reversal confirmation
$1.4318 Retest of the all-time high
If volume supports the breakout, we could see a sharp move toward these zones.
🧨 Bearish Scenario:
If price fails to break out and gets rejected from the trendline:
It could retrace back toward $0.3100 and $0.2700
A daily close below $0.2494 (previous low) would invalidate the bullish setup, signaling potential continuation of the downtrend
Traders should monitor RSI divergence and volume drop as warning signs
📌 Why This Setup Matters:
This is not just a short-term play. A successful breakout here signals the end of a multi-month downtrend and the potential start of a new macro uptrend. SONIC has been heavily compressed — and the tighter the coil, the bigger the move.
Smart money often enters before the breakout confirmation. Monitor for volume surges, candle structure changes, and key breakout retests.
✅ Summary:
🔄 Trendline breakout imminent
🟢 Watch for breakout confirmation above $0.4030
🔴 Breakdown below $0.2494 invalidates the bullish thesis
🧭 Fibonacci levels offer reliable target zones for profit-taking
This is a critical make-or-break zone for SONIC/USDT. Traders, be ready.
#SONICUSDT #BreakoutSetup #AltcoinAlert #CryptoAnalysis #TrendReversal #TechnicalAnalysis #CryptoTA #Altseason #FibonacciLevels #PriceAction
SUSDT 1D AnalysisS ~ 1D Analysis
#S Buy back gradually from here if you still have confidence in this coin with a short term target of at least 15%+ from here.

S (Ex FTM) UpdateS is Preparing for a Key Liquidity Grab and Potential Reversal
Previously, S swept the liquidity from the upside and formed a zig-zag corrective structure within a descending channel. Following a clean breakdown, it has struggled to recover — despite broader bullish conditions in the market.
Now, the structure is showing strong signs of a potential long-side liquidity grab in the coming days or weeks. This setup often marks the final phase of accumulation before a major upside move.
Additionally, the price action aligns perfectly with Fibonacci extension levels, particularly around the $0.38 zone, which could act as a key support and entry area for long positions.
A decisive reaction from this zone could trigger the beginning of a strong reversal, leading to the next impulsive leg.
— Thanks for reading.

SONICUSDT 1D Analisis S / SET:SONIC ~ 1D Analisis
#S / #SONIC Buy gradually from here if you still have confidence in this coin with a short term target of at least 10%+ From here.

updateIs Sonic forming an ascending triangle? Sonic is acting confusingly and the market maker is probably planning a big rally after collecting all of Sonic from the public.
S = 55$
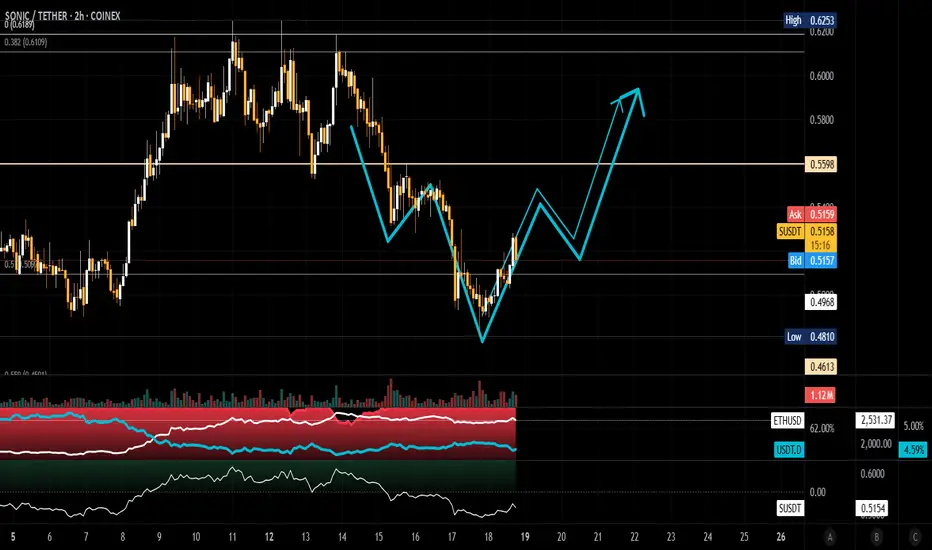
S (EX FTM) Update (4H)Like many other altcoins, S has formed an Inverse Head and Shoulders pattern, signaling a potential trend reversal.
Additionally, a bullish flag formation has broken out on the lower timeframes, further confirming the upward momentum.
The current price structure appears suitable for long positions, especially with confluence from multiple technical signals.
A conservative target lies around the $0.64 level, based on the measured move projections from the flag and neckline breakouts.
— Thanks for reading.

SONICUSDT 12HS / SET:SONIC ~ 12H Analysis
#S / #SONIC Buy after successfully penetrating this resistant line with a short -term target of at least 10%+ from here.

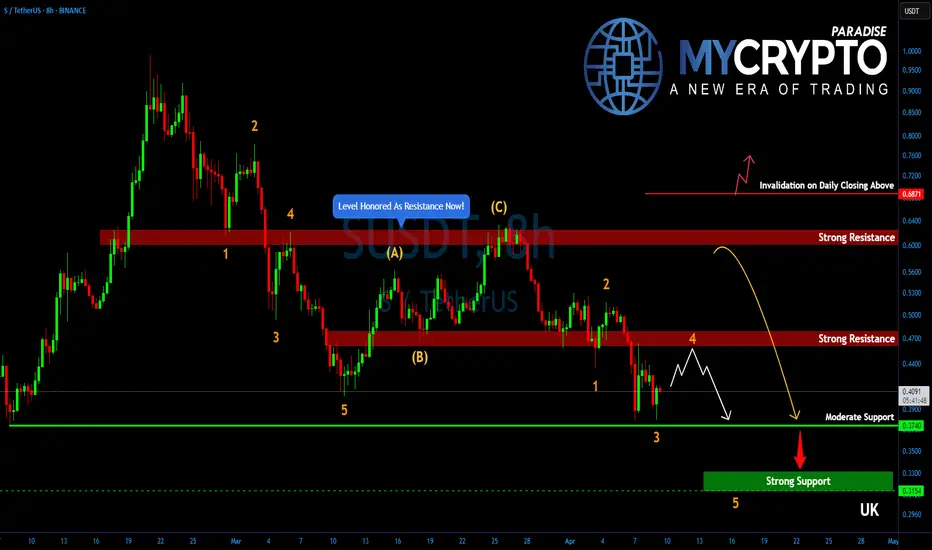
SUSDT Still in Trouble – Is the Worst Yet to Come?Yello, Paradisers! Are you letting this short-term bounce on #SUSD fool you? Be careful. What looks like a recovery could just be a deceptive pause before the next major drop hits.
💎After topping out just shy of the psychological $1.00 mark, SUSDT has entered a significant zigzag corrective structure. Despite the recent bounce, the bigger picture still suggests that the market is setting up for one more leg to the downside, where the real bottom might finally be reached.
💎#SUSDT has printed a short-term double bottom around the $0.38 level, positioned slightly above a moderate support zone. This has triggered a minor bullish push, offering a temporary sense of relief for bulls. However, based on the current market structure, this move is likely to be short-lived and part of a broader corrective pattern.
💎The resistance zone between $0.465 and $0.4720 is now the key level to watch. It’s a strong supply area where selling pressure is expected to return with intensity, making it difficult for buyers to gain control. If price gets rejected from this zone, a drop back toward the $0.3740 level is highly probable, as this area serves as the next moderate support.
💎The structure on SUSDT is far from done to the downside. If the rejection plays out as expected, the price could slide even lower, targeting the $0.3300 to $0.3150 range. This is where the final drop may conclude and a proper base for recovery could finally be established.
Paradisers, strive for consistency, not quick profits. Treat the market as a businessman, not as a gambler.
MyCryptoParadise
iFeel the success🌴
SUSDT 12HS ~ 12H Analysis
#S Buy gradually from here if you still have a Conviction on this coin with a short -term target of at least 10%+.

S (Ex FTM) UpdateS has formed a mini bearish flag which will push S towards down.
It's target also lined up with an Orderblock left behind.
Reasonable entry would be 0.4760

S (Ex FTM) Next MoveAt the moment, S is going in a parallel channel through upwards. Either right from around here or from a lower demand zone, S will be going through 0,63 level.
It's a low risk trade and might be usefull.
Below the are 0.58 which is marked on the chart might be dangerous and would be a usefull stoploss.
If you can follow the chart in low time frame wait for a 4 hour candle close before stop the position if it reaches the invalidation level.

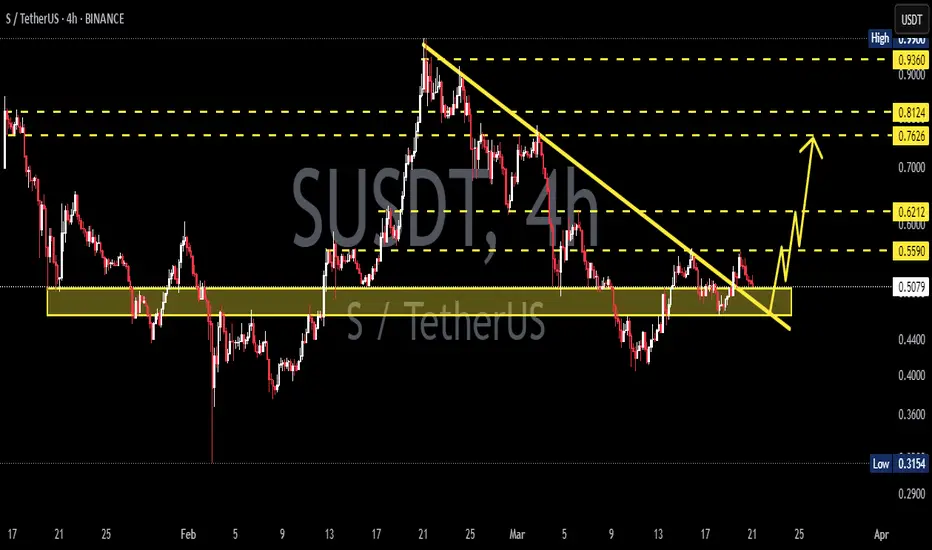
SUSD 4H Chart – Easy Trend with RSI Signal!SUSD on the 4H chart is in a steady uptrend within a channel since February. After a drop to the 0.285 level, it’s now at 0.382, sitting near the channel’s midline. RSI is at 54.26, showing neutral momentum—room to move either way. The yellow line suggests a potential push to the channel top at 1.0000000 if the trend continues. On the downside, 0.3500000 is key support to watch.


SUSDT 4HS ~ 4H Analysis
#S Buy from here if you only have a Conviction on this coin with a short -term target of at least 10%+.
Bulls in Trouble! Sonic Rejected Again—Lower Lows Incoming?Yello, Paradisers! Is #Sonic about to take another dive? The latest price action suggests trouble for the bulls. After failing to reclaim key support, the downtrend is back in full force.
💎#SUSDT continues to reject from a historically strong resistance at $0.63 – $0.65, a level that has repeatedly proven difficult to break. This latest rejection is only accelerating the downside, putting lower targets into play.
💎The sellers are initially aiming for the $0.46 – $0.44 levels, a strong support zone where we could see some short-covering as traders take profits on their positions. This level has provided temporary relief in the past, making it a key area to watch.
💎However, if sellers maintain control and the bearish momentum continues, the price could dip even further into the $0.3850 – $0.3740 zone. This area has historically acted as a strong support base, attracting significant buying pressure that could fuel a potential reversal.
💎For bulls to regain control, they must reclaim the $0.63 – $0.65 zone, a strong resistance level. However, with descending resistance reinforcing this area, breaking out won’t be easy. Until then, the trend remains bearish, and lower levels are in play.
Stay patient, Paradisers! The market always rewards discipline. If we see confirmation, we take action. If not, we wait. Trade smart, not fast! 🎖
MyCryptoParadise
iFeel the success 🌴

SUSDT buy/long setup (4H)It seems that a lot of orders have accumulated at the lower levels. We have a bullish iCH on the chart, and the trigger line has been broken. The price is now near a supply zone. If it bounces from the green area, we can look for buy/long positions.
Targets are marked on the chart.
A daily candle closing below the invalidation level will invalidate this analysis.
For risk management, please don't forget stop loss and capital management
Comment if you have any questions
Thank You

(Prev. FTM) Support and Resistance Zone: 0.4126-0.4930
Hello, traders.
If you "Follow", you can always get new information quickly.
Please click "Boost".
Have a nice day today.
-------------------------------------
(SUSDT 1D Chart)
FTM Coin (Token) has been changed to Sonic Coin (Token).
Since the chart was newly created on January 16, the support and resistance role may be weak, so be careful when trading.
-
(12h chart)
Since the indicator has not been created yet on the 1D chart, support and resistance points are not displayed, so the 12h chart was used.
The point of interest is whether it can rise above the Fibonacci ratio of 0.236 (0.5815) ~ 0 (0.6565).
To do so, it is important to see whether it can receive support near the BW (0) indicator point of 0.4126 and rise above 0.4930.
If it falls below 0.4126, it is likely to fall to around the Fibonacci ratio of 1 (0.3385).
Therefore, if it shows support in the low boundary zone of 0.4126-0.4930, it is a time to buy.
-
The MS-Signal indicator is an indicator that can tell the trend.
Therefore, if the price stays above the MS-Signal indicator, there is a high possibility that it will turn into an uptrend.
-
Thank you for reading to the end.
I hope you have a successful trade.
--------------------------------------------------
- Big picture
I used TradingView's INDEX chart to check the entire range of BTC.
(BTCUSD 12M chart)
Looking at the big picture, it seems that it has been maintaining an uptrend following a pattern since 2015.
In other words, it is a pattern that maintains a 3-year uptrend and faces a 1-year downtrend.
Accordingly, the uptrend is expected to continue until 2025.
-
(LOG chart)
Looking at the LOG chart, you can see that the uptrend is decreasing.
Accordingly, the 46K-48K range is expected to be a very important support and resistance range from a long-term perspective.
Therefore, it is expected that prices below 44K-48K will not be seen in the future.
-
The Fibonacci ratio on the left is the Fibonacci ratio of the uptrend that started in 2015.
In other words, it is the Fibonacci ratio of the first wave of the uptrend.
The Fibonacci ratio on the right is the Fibonacci ratio of the uptrend that started in 2019.
Therefore, it is expected that this Fibonacci ratio will be used until 2026.
-
No matter what anyone says, the chart has already been created and is already moving.
It is up to you how to view and respond to this.
If the ATH is renewed, there are no support and resistance points, so the Fibonacci ratio can be appropriately utilized.
However, although the Fibonacci ratio is useful for chart analysis, it is ambiguous to use it as support and resistance.
The reason is that the user must directly select the important selection points required to generate Fibonacci.
Therefore, since it is expressed differently depending on how the user specifies the selection points, it can be useful for chart analysis, but it can be seen as ambiguous to use it for trading strategies.
1st: 44234.54
2nd: 61383.23
3rd: 89126.41
101875.70-106275.10 (when overshooting)
4th: 134018.28
151166.97-157451.83 (when overshooting)
5th: 178910.15
-----------------

SUSDT - Bearish chart!Breaking down the rising wedge pattern in 4H chart
Price targeting the 0.45 level
Entry: 0.53 - 0.54
Targets: 0.525 - 0.515 - 0.505 - 0.480 - 0.450
Stoploss:0.570
Leverage: x5
Best regards Ceciliones 🎯
