SUSDT swing trade or spot investmentWe can see how the price is moving in the descending channel, currently SUSDT formed a descending wedge figure which may indicate about a reversal movement, another factor is that the price came to the support level of this channel and it seems the price is ready to bounce up from this level, which may be a good opportunity for opening a long position for swing, or spot investment. Keep in mind that SUSDT was ex FantomUSDT, anyway I won't be surpised to see $1-$1.5 on a bullish market.
Susdtanalysis

$SUSDT Breakout Alert: Bullish Reversal in Play.$S just broke out of a long falling wedge, signalling a possible bullish reversal.
MACD is turning positive, adding momentum to the move.
If price holds above the breakout zone, it could rally toward $0.8808, nearly 195% higher than current levels.
DYOR, NFA

S/USDT The Big Test at the Trendline — Rebound or Rejection?🔎 Overview
The price action of S/USDT remains under pressure from a long-term downtrend, marked by the descending trendline (yellow) that has consistently capped every rally attempt since early this year.
After bouncing from the 0.2219 major low, price has shown a solid rebound and is now testing the critical confluence resistance zone at 0.2984 – 0.31.
This area is a make-or-break level: will buyers manage a breakout to end the seller’s dominance, or will the trendline reject price once again?
---
🧩 Structure & Pattern
1. Descending Trendline
– A clear series of lower highs confirms seller dominance.
– Each rally attempt has been rejected at this line.
2. Key Supports
– 0.2219 → the major swing low and critical downside level.
– Minor support zone: 0.260 – 0.244.
3. Layered Resistances
– 0.2984 (current test) → the first breakout checkpoint.
– 0.3531 – 0.3946 → next upside targets if breakout holds.
– 0.6088 – 0.8650 → major resistance levels, potential rally zone in the mid-term.
---
📈 Bullish Scenario (If Breakout Holds)
Confirmation: Daily close above 0.2984–0.31 with strong volume.
Entry Idea: Buy on retest of the breakout zone.
Upside Targets:
TP1 → 0.3531
TP2 → 0.3946
TP3 → 0.6088
Stop Loss: Below 0.28 (or below the retest low).
Narrative: A breakout from the descending trendline could signal the first step of a trend reversal, opening the path for further bullish momentum.
---
📉 Bearish Scenario (If Rejection Happens)
Confirmation: Bearish rejection candle (engulfing / pinbar) around 0.298–0.31.
Entry Idea: Short/sell after confirmation of rejection.
Downside Targets:
TP1 → 0.260–0.244
TP2 → 0.2219 (major low)
Stop Loss: Above 0.31–0.33.
Narrative: As long as price remains below the trendline, the broader bearish structure is intact. Rejection here may trigger continuation towards the lows.
---
📝 Conclusion
The 0.298–0.31 zone is a major battleground between bulls and bears.
A confirmed breakout could shift momentum towards 0.3531–0.3946.
A rejection, however, keeps downside risk alive with targets back to 0.2219.
Best strategy: Wait for daily close + volume confirmation before committing to major positions.
---
📌 Key Levels to Watch
Support: 0.2884 → 0.260–0.244 → 0.2219
Resistance: 0.2984 → 0.3531 → 0.3946 → 0.6088 → 0.8650
---
#SUSDT #CryptoAnalysis #Altcoin #TechnicalAnalysis #TrendlineBreakout #BearishVsBullish #CryptoTrading #SwingTrade #SupportResistance

S/USDT - Daily - BreakoutThe S/USDT pair on the Daily timeframe presents a Potential Buying Opportunity.
Target Levels:
1st Resistance – 0.4000
2nd Resistance - 0.5839

SONIC/USDT — Descending Triangle at Key Support!Overview
The daily chart shows a clear medium-term downtrend (well-defined descending trendline) meeting a strong horizontal support zone around 0.25–0.31 USDT (yellow box). Current price ≈ 0.3059 USDT. This structure forms a descending triangle or accumulation range, signaling that the market is in a decision phase — either a bullish breakout or a bearish continuation.
---
Key Levels
Current Price: 0.3059
Support Zone: 0.2494 – 0.305 (historical low at 0.2494)
Descending Trendline Resistance: ~0.33–0.35 (dynamic)
Next Resistances: 0.3891, 0.5278, 0.6067, 0.7461, 0.8654, 1.0453
Breakdown Measured Target: ~0.11 (if 0.2494 breaks)
Potential % moves from current price:
To 0.3891 ≈ +27.2%
To 0.5278 ≈ +72.5%
To 0.2494 ≈ −18.5%
To 0.11 ≈ −64%
---
Pattern & Interpretation
Main Pattern: Descending trendline + horizontal support = descending triangle (bearish bias unless broken to the upside).
Bearish Signal: Lower highs structure, price still under the descending trendline, supply pressure dominant. A daily close below 0.2494 with high volume = breakdown confirmation.
Bullish Signal: Daily close above the trendline (~0.33–0.35) with strong volume, followed by a successful retest = breakout confirmation. Extra confirmation if price breaks and holds above 0.3891.
---
Scenarios
Bullish
1. Break & daily close above trendline (~0.33–0.35) with rising volume.
2. Retest holds as support.
3. Targets: 0.3891 (+~27%), then 0.5278 (+~72%).
4. Stop-loss: below support box (~0.28 or safer < 0.2494).
Bearish
1. Daily close below 0.2494 with strong volume = breakdown.
2. Measured move target ≈ 0.11.
3. Conservative target: psychological zones 0.18–0.15.
4. Stop-loss for shorts: above 0.305–0.33.
---
Trading Notes
Conservative Long: Wait for breakout & retest above trendline.
Aggressive Long: Enter near support (0.26–0.30) with tight stop below 0.2494.
Short: Only after confirmed breakdown below 0.2494.
Always watch daily close + volume to avoid false signals.
---
Conclusion
Current trend is bearish, but the strong 0.25–0.31 support keeps the possibility of a short-term rebound alive.
Decision point: Breakout above 0.35 → bullish rally, Breakdown below 0.2494 → extended sell-off.
Risk management is key — use stop-losses and position sizing.
#SONIC #SONICUSDT #CryptoAnalysis #SupportResistance #DescendingTriangle #Breakout #Altcoin #RiskManagement
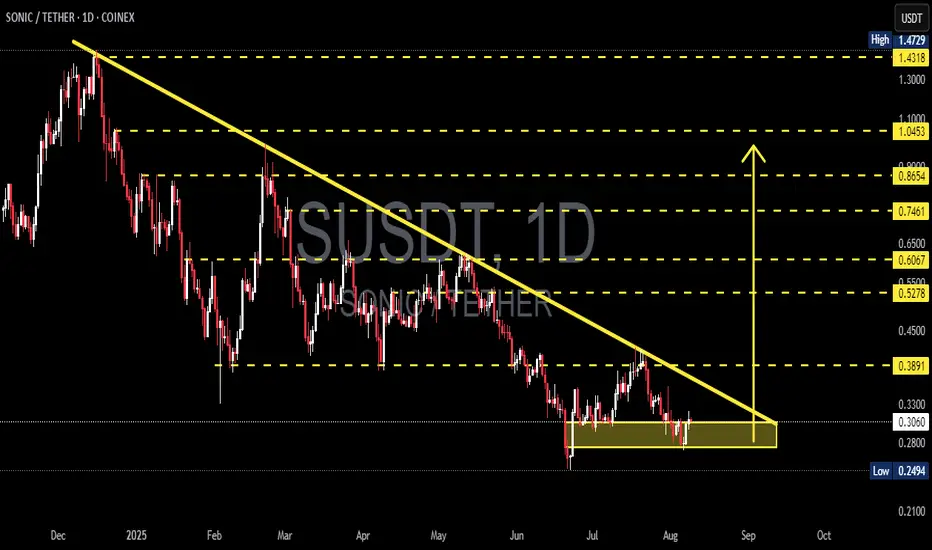
SONIC/USDT Breakout in Progress? Watch This Critical Level Close🧠 Technical Breakdown – Daily Chart (1D, Coinex)
The SONIC/USDT pair is currently exhibiting a textbook descending trendline breakout setup, formed over the past 7+ months. This long-term downtrend has been respected since late November 2024, connecting multiple lower highs and establishing a well-defined bearish structure.
However, recent price action shows a potential trend reversal as the pair consolidates tightly near the apex of the structure, with signs of breakout momentum building.
📐 Pattern Identification:
✅ Falling Wedge / Descending Triangle
✅ Continuous lower highs connected by a descending trendline
✅ Support held above $0.25 (strong demand zone)
✅ Price now testing the upper boundary of the trendline
This is a classic bullish reversal pattern—especially when price breaks out after long-term compression.
🚀 Bullish Scenario:
Should SONIC successfully break and close above the $0.4030 level (trendline + horizontal resistance), it could unlock a wave of bullish momentum. Here are the key upside targets based on Fibonacci retracement from the previous high ($1.4729) to the local low ($0.2494):
🎯 Resistance Level Significance
$0.5278 0.382 Fib – First major target post-breakout
$0.6067 Key confluence level – psychological barrier
$0.7461 0.618 Fib – Bullish continuation zone
$0.8654 High momentum extension
$1.0453 0.786 Fib – Reversal confirmation
$1.4318 Retest of the all-time high
If volume supports the breakout, we could see a sharp move toward these zones.
🧨 Bearish Scenario:
If price fails to break out and gets rejected from the trendline:
It could retrace back toward $0.3100 and $0.2700
A daily close below $0.2494 (previous low) would invalidate the bullish setup, signaling potential continuation of the downtrend
Traders should monitor RSI divergence and volume drop as warning signs
📌 Why This Setup Matters:
This is not just a short-term play. A successful breakout here signals the end of a multi-month downtrend and the potential start of a new macro uptrend. SONIC has been heavily compressed — and the tighter the coil, the bigger the move.
Smart money often enters before the breakout confirmation. Monitor for volume surges, candle structure changes, and key breakout retests.
✅ Summary:
🔄 Trendline breakout imminent
🟢 Watch for breakout confirmation above $0.4030
🔴 Breakdown below $0.2494 invalidates the bullish thesis
🧭 Fibonacci levels offer reliable target zones for profit-taking
This is a critical make-or-break zone for SONIC/USDT. Traders, be ready.
#SONICUSDT #BreakoutSetup #AltcoinAlert #CryptoAnalysis #TrendReversal #TechnicalAnalysis #CryptoTA #Altseason #FibonacciLevels #PriceAction
SUSDT 1D AnalysisS ~ 1D Analysis
#S Buy back gradually from here if you still have confidence in this coin with a short term target of at least 15%+ from here.

SONICUSDT 1D Analisis S / SET:SONIC ~ 1D Analisis
#S / #SONIC Buy gradually from here if you still have confidence in this coin with a short term target of at least 10%+ From here.

Short position SUSDT RR=3Short position for swing style in SUSDT
TP and SL is obvious.
if you have any question leave a comment
