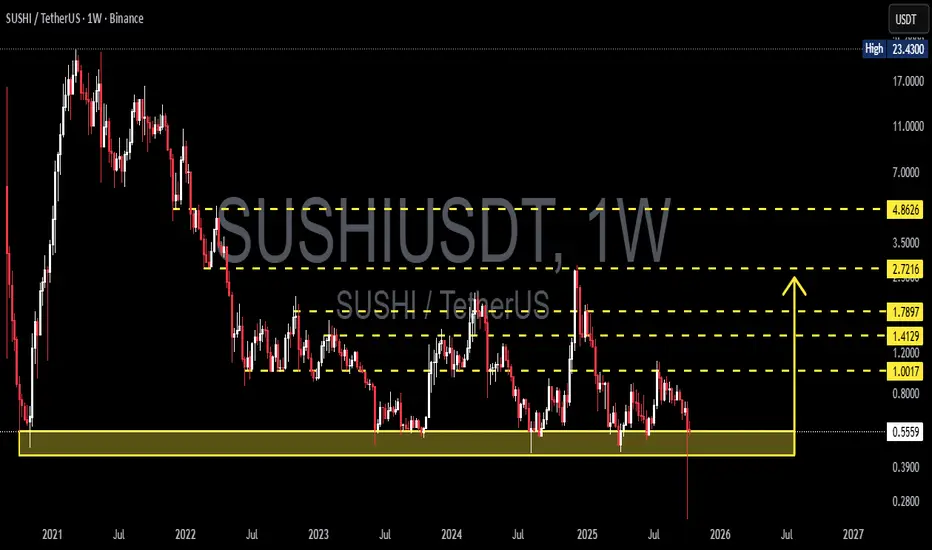
SUSHI/USDT — Decision Zone! Accumulation or Breakdown Oblivion?SUSHI has returned to its major historical support zone between 0.553 – 0.44 USDT, an area that has held firm since 2022.
Each time price has entered this block, the market has shown signs of a relief bounce and potential accumulation — but the more a level is tested, the weaker it tends to become.
Since its 2021 peak, SUSHI has remained in a long-term downtrend, forming consistent lower highs and lower lows.
However, the presence of deep long wicks beneath the current range indicates liquidity sweeps — a classic signature of hidden accumulation by strong hands preparing for a potential reversal.
---
📊 Pattern & Structure
Primary trend: Long-term downtrend (bearish structure)
Major Support Zone (yellow block): 0.553 – 0.44 USDT
Potential Pattern: Double Bottom or Spring Phase (if the price rebounds strongly from this zone)
Key Resistance Levels (target zones):
1.0017
1.4129
1.7897
2.7216
4.8626
---
Bullish Scenario
Price holds the yellow block and rejects any breakdown below 0.44.
A strong confirmation would come from a weekly close above 0.553 with rising volume.
Formation of a higher low would signal the start of structural reversal.
A decisive breakout and weekly close above 1.00 USDT would confirm a major trend shift.
Gradual bullish targets: 1.00 → 1.41 → 1.78 → 2.72 → 4.86 USDT.
Additional narrative:
This area could represent an institutional accumulation zone, similar to previous DeFi cycle reaccumulation phases.
If DeFi narratives regain momentum, SUSHI could emerge as one of the stronger comeback tokens.
---
Bearish Scenario
A weekly close below 0.44 would confirm a structural breakdown.
The 0.553–1.00 zone would flip into a strong supply area, likely acting as resistance on any retest.
Price could then slide further toward the psychological zone of 0.30–0.28 USDT or even lower if selling pressure continues.
---
Conclusion
SUSHI now stands at a make-or-break point in its multi-year cycle.
The yellow block at 0.553 – 0.44 is not just a support zone — it’s the final line of defense that has protected this structure since 2022.
If it holds, a major reversal could unfold.
If it breaks, a new phase of capitulation may begin.
The next weekly close will define SUSHI’s fate.
Traders should wait for clear confirmation before committing to any large directional move.
#SUSHI #SUSHIUSDT #Crypto #DeFi #TechnicalAnalysis #SupportResistance #SwingTrading
SUSHIUSDC
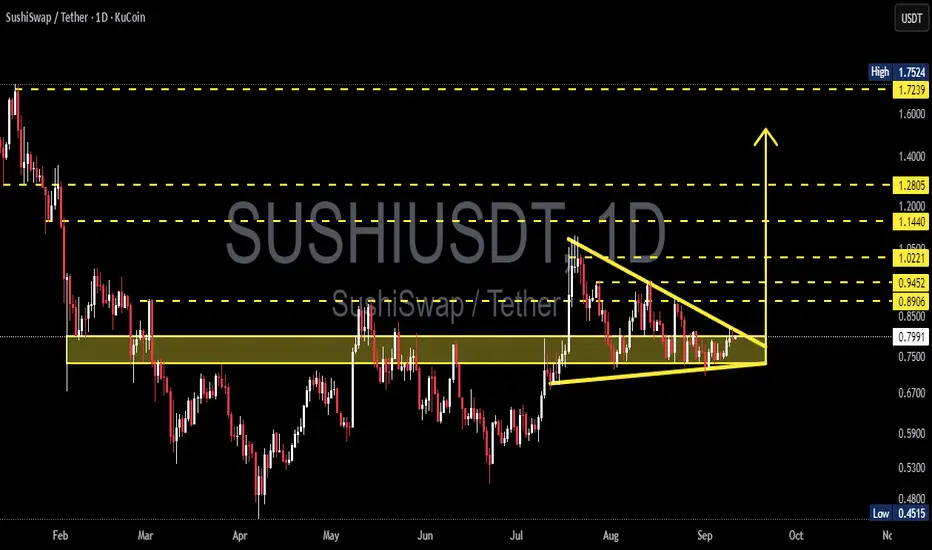
SUSHI/USDT – Symmetrical Triangle Compression Near Key Flip Zone🔎 Market Overview
SUSHI is currently trading around $0.799, consolidating within a symmetrical triangle pattern that has been forming since mid-July. This setup reflects a period of decreasing volatility and volume, where the market is accumulating energy for the next major move.
The $0.72–0.83 zone is acting as a critical support-resistance flip area, tested multiple times since March. This is the battlefield where bulls and bears are fighting for dominance. The eventual breakout from this zone will likely dictate the mid-term trend.
---
📐 Technical Pattern Breakdown
Symmetrical Triangle: Converging trendlines (lower highs + higher lows). Neutral by nature, direction depends on breakout.
Historical Context: Prior to the triangle, price rallied from $0.45 → $1.05, hinting this could be a bullish continuation pattern if an upside breakout occurs. Still, the broader macrotrend has been bearish since the start of the year, so both outcomes remain on the table.
Key Levels:
Major Supports: $0.72 → $0.67 → $0.45
Major Resistances: $0.89 → $0.94 → $1.02 → $1.14 → $1.28 → $1.72
---
🚀 Bullish Scenario (Upside Breakout)
If price manages to close a daily candle above the $0.85–0.89 resistance trendline with strong volume, upside potential is significant. Bullish targets include:
🎯 Target 1: $0.945
🎯 Target 2: $1.02
🎯 Target 3: $1.14
🎯 Target 4: $1.28
🎯 Extended Target: $1.72
This would represent a possible +100% upside if momentum builds.
Bullish Confirmation Signals:
Daily close above $0.89–0.94
Increasing breakout volume
Successful retest holding above former resistance
---
🐻 Bearish Scenario (Downside Breakdown)
Failure to hold the $0.72–0.75 flip zone would likely trigger a bearish continuation. Downside targets are:
🎯 Target 1: $0.67
🎯 Target 2: $0.59
🎯 Target 3: $0.45 (yearly low & major psychological support)
A confirmed breakdown could mean a -30% to -40% drop from current levels.
Bearish Confirmation Signals:
Daily close below $0.72
Strong selling volume
Retest rejection at $0.72 (new resistance)
---
⚖️ Trading Strategy & Risk Management
Conservative traders: Wait for a confirmed breakout + retest before entering.
Aggressive traders: Consider entries near triangle support (~$0.75) with tight SL below $0.70.
Risk control: Limit exposure to 1–3% of total capital per trade, use disciplined stop-losses, and take profits in stages at key levels.
Risk/Reward: Look for setups with at least a 2:1 or 3:1 ratio.
---
📌 Conclusion
SUSHI is at a critical crossroads. The symmetrical triangle suggests a powerful move is imminent. A breakout to the upside opens the door for a rally toward $1.72, while a breakdown could drag price back toward $0.45.
Traders should focus on confirmation signals before committing, as the next breakout will likely define the mid-to-long term trend.
---
#SUSHI #SUSHIUSDT #SushiSwap #CryptoAnalysis #TechnicalAnalysis #TrianglePattern #BreakoutTrading #SupportResistance #CryptoTrading #Altcoins
SUSHIUSDT Holding Strong Support — Bullish Ahead?"SUSHIUSDT Technical analysis update.
SUSHIUSDT has respected a strong horizontal support zone for several years, as shown by multiple successful retests. Every dip into this support area has triggered a notable bounce.
Currently, SUSHI is once again bouncing off this major support, and the price action suggests potential for a larger bullish move ahead. Before the big rally price could correct, if the rally continues, then the next target $2.80–$3.40 level.
