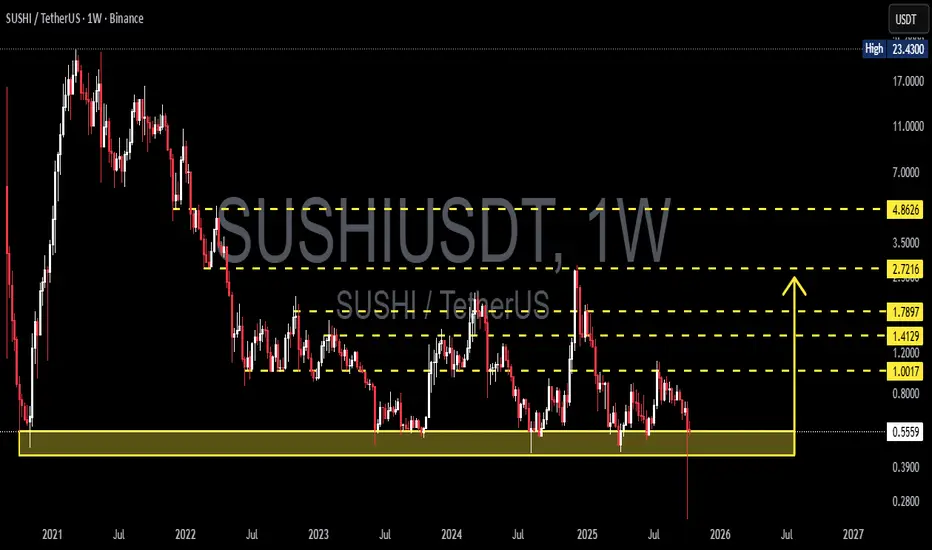
SUSHI/USDT — Decision Zone! Accumulation or Breakdown Oblivion?SUSHI has returned to its major historical support zone between 0.553 – 0.44 USDT, an area that has held firm since 2022.
Each time price has entered this block, the market has shown signs of a relief bounce and potential accumulation — but the more a level is tested, the weaker it tends to become.
Since its 2021 peak, SUSHI has remained in a long-term downtrend, forming consistent lower highs and lower lows.
However, the presence of deep long wicks beneath the current range indicates liquidity sweeps — a classic signature of hidden accumulation by strong hands preparing for a potential reversal.
---
📊 Pattern & Structure
Primary trend: Long-term downtrend (bearish structure)
Major Support Zone (yellow block): 0.553 – 0.44 USDT
Potential Pattern: Double Bottom or Spring Phase (if the price rebounds strongly from this zone)
Key Resistance Levels (target zones):
1.0017
1.4129
1.7897
2.7216
4.8626
---
Bullish Scenario
Price holds the yellow block and rejects any breakdown below 0.44.
A strong confirmation would come from a weekly close above 0.553 with rising volume.
Formation of a higher low would signal the start of structural reversal.
A decisive breakout and weekly close above 1.00 USDT would confirm a major trend shift.
Gradual bullish targets: 1.00 → 1.41 → 1.78 → 2.72 → 4.86 USDT.
Additional narrative:
This area could represent an institutional accumulation zone, similar to previous DeFi cycle reaccumulation phases.
If DeFi narratives regain momentum, SUSHI could emerge as one of the stronger comeback tokens.
---
Bearish Scenario
A weekly close below 0.44 would confirm a structural breakdown.
The 0.553–1.00 zone would flip into a strong supply area, likely acting as resistance on any retest.
Price could then slide further toward the psychological zone of 0.30–0.28 USDT or even lower if selling pressure continues.
---
Conclusion
SUSHI now stands at a make-or-break point in its multi-year cycle.
The yellow block at 0.553 – 0.44 is not just a support zone — it’s the final line of defense that has protected this structure since 2022.
If it holds, a major reversal could unfold.
If it breaks, a new phase of capitulation may begin.
The next weekly close will define SUSHI’s fate.
Traders should wait for clear confirmation before committing to any large directional move.
#SUSHI #SUSHIUSDT #Crypto #DeFi #TechnicalAnalysis #SupportResistance #SwingTrading
Sushiusdtlong
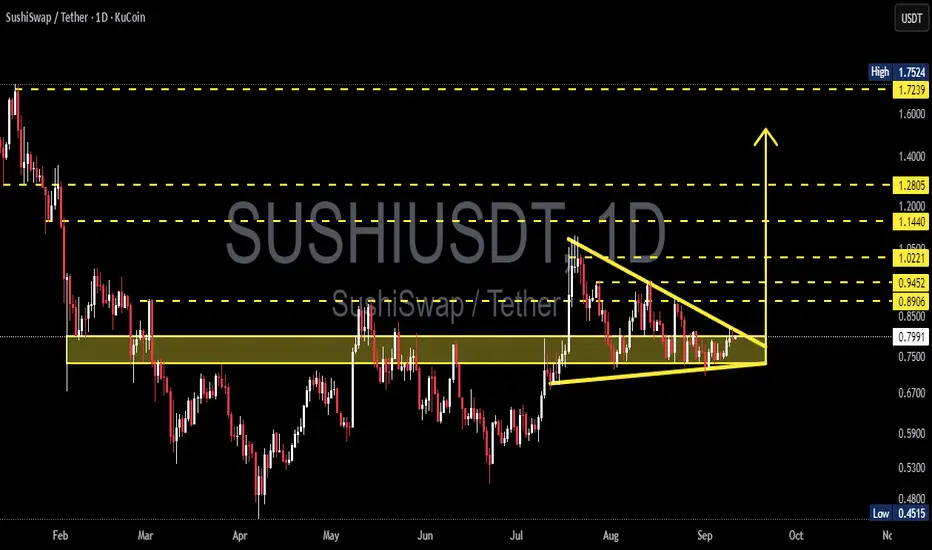
SUSHI/USDT – Symmetrical Triangle Compression Near Key Flip Zone🔎 Market Overview
SUSHI is currently trading around $0.799, consolidating within a symmetrical triangle pattern that has been forming since mid-July. This setup reflects a period of decreasing volatility and volume, where the market is accumulating energy for the next major move.
The $0.72–0.83 zone is acting as a critical support-resistance flip area, tested multiple times since March. This is the battlefield where bulls and bears are fighting for dominance. The eventual breakout from this zone will likely dictate the mid-term trend.
---
📐 Technical Pattern Breakdown
Symmetrical Triangle: Converging trendlines (lower highs + higher lows). Neutral by nature, direction depends on breakout.
Historical Context: Prior to the triangle, price rallied from $0.45 → $1.05, hinting this could be a bullish continuation pattern if an upside breakout occurs. Still, the broader macrotrend has been bearish since the start of the year, so both outcomes remain on the table.
Key Levels:
Major Supports: $0.72 → $0.67 → $0.45
Major Resistances: $0.89 → $0.94 → $1.02 → $1.14 → $1.28 → $1.72
---
🚀 Bullish Scenario (Upside Breakout)
If price manages to close a daily candle above the $0.85–0.89 resistance trendline with strong volume, upside potential is significant. Bullish targets include:
🎯 Target 1: $0.945
🎯 Target 2: $1.02
🎯 Target 3: $1.14
🎯 Target 4: $1.28
🎯 Extended Target: $1.72
This would represent a possible +100% upside if momentum builds.
Bullish Confirmation Signals:
Daily close above $0.89–0.94
Increasing breakout volume
Successful retest holding above former resistance
---
🐻 Bearish Scenario (Downside Breakdown)
Failure to hold the $0.72–0.75 flip zone would likely trigger a bearish continuation. Downside targets are:
🎯 Target 1: $0.67
🎯 Target 2: $0.59
🎯 Target 3: $0.45 (yearly low & major psychological support)
A confirmed breakdown could mean a -30% to -40% drop from current levels.
Bearish Confirmation Signals:
Daily close below $0.72
Strong selling volume
Retest rejection at $0.72 (new resistance)
---
⚖️ Trading Strategy & Risk Management
Conservative traders: Wait for a confirmed breakout + retest before entering.
Aggressive traders: Consider entries near triangle support (~$0.75) with tight SL below $0.70.
Risk control: Limit exposure to 1–3% of total capital per trade, use disciplined stop-losses, and take profits in stages at key levels.
Risk/Reward: Look for setups with at least a 2:1 or 3:1 ratio.
---
📌 Conclusion
SUSHI is at a critical crossroads. The symmetrical triangle suggests a powerful move is imminent. A breakout to the upside opens the door for a rally toward $1.72, while a breakdown could drag price back toward $0.45.
Traders should focus on confirmation signals before committing, as the next breakout will likely define the mid-to-long term trend.
---
#SUSHI #SUSHIUSDT #SushiSwap #CryptoAnalysis #TechnicalAnalysis #TrianglePattern #BreakoutTrading #SupportResistance #CryptoTrading #Altcoins
SUSHIUSDT at a Critical Pivot Golden Pocket Retest or Bull Trap?📊 Full Daily Chart Analysis (1D) — KuCoin
After months of dull sideways movement, SUSHI is finally showing signs of life! A strong breakout above a long-term consolidation range has pushed price up to the key resistance at $1.03, raising the possibility of a mid-term trend reversal.
However, the price is now entering a pullback phase. The key question:
Is this just a healthy correction before the next leg up—or the beginning of another downward move?
---
🔍 Structure & Pattern Breakdown:
Rounded Bottom Formation:
Formed from April to July 2025, this pattern signals a shift from accumulation to potential bullish expansion.
Confirmed Breakout:
A breakout above the neckline at $0.80, supported by increasing volume, suggests this move is legitimate—not a fakeout.
Golden Pocket Retest (Key Fibonacci Zone):
Price is currently pulling back into the Fibonacci Golden Pocket (0.5 at $0.7992 and 0.618 at $0.7295) — the most ideal technical zone for a bullish re-entry. This area also aligns with a strong historical demand zone.
---
📈 Bullish Scenario (Primary Case):
If daily candles hold above the $0.7295–$0.7992 zone and form a strong reversal signal (e.g. bullish engulfing or hammer):
Price is likely to retest $1.03 (minor resistance).
A successful breakout above $1.03 could lead to a rally toward:
🔸 $1.3374 – Previous horizontal resistance
🔸 $1.8307 – Key psychological level & March 2025 swing high
🔸 $2.6591 – Fibonacci extension target
🔸 $2.8195 – Major high from November 2024
This could mark the beginning of a mid-term bullish trend if volume continues to build.
---
📉 Bearish Scenario (Alternative Case):
If the price fails to hold above the Golden Pocket and breaks below $0.7295:
A deeper correction is likely, with price revisiting $0.60 or even retesting the bottom zone at $0.4515.
This would invalidate the bullish setup and confirm a bull trap.
---
🧠 Conclusion:
SUSHI is at a decisive moment. This retest of the Golden Pocket will determine whether this is simply a healthy pullback within a new uptrend, or the early sign of another bearish breakdown.
> Plan the trade, trade the plan. The $0.73–$0.80 zone is the battlefield for SUSHI’s next major move.
---
📌 Key Levels:
Level Description
$0.7295–$0.7992 Golden Pocket (Fibonacci Re-Entry Zone)
$1.03 Minor Resistance
$1.3374 Bullish Target 1
$1.8307 Bullish Target 2 (Mid Resistance)
$2.6591–$2.8195 Long-Term Bullish Targets
$0.60 / $0.4515 Bearish Supports if Breakdown Occurs
#SUSHIUSDT #CryptoBreakout #FibonacciTrading #GoldenPocket #AltcoinReversal #SushiSwap #CryptoSetup #TechnicalAnalysis #BullishScenario

Massive Upside for SUSHI from Key Demand Zone!CRYPTOCAP:SUSHI is bouncing strongly from a key multi-tested weekly support zone (~$0.42–$0.55), signaling a potential bottom formation. Price action shows a bullish structure with the possibility of a trend reversal. If momentum continues, we could see a rally first toward Resistance 1 at $1.25, followed by a larger move targeting Resistance 2 at $3.75.
Stop Loss: $0.43
Resistance 1:$1.25
Resistance 2:$3.75
BINANCE:SUSHIUSDT

SUSHIUSDT Forming Descending ChannelSUSHIUSDT is currently forming a classic descending channel pattern, a setup that often precedes strong bullish breakouts once price action moves beyond the upper trendline. This technical structure suggests that while the price has been under pressure, it has been consistently creating lower highs and lower lows within a confined range—typically a sign of consolidation rather than weakness. Now, with improving volume and investor sentiment, SUSHI appears poised for a potential reversal that could result in a 60% to 65% gain.
The descending channel pattern on SUSHIUSDT aligns with historical accumulation zones seen in previous market cycles. These periods often attract smart money and long-term investors looking to position themselves ahead of major uptrends. The recent uptick in trading volume and the price nearing the top of the channel suggest that bulls are beginning to regain control. If a confirmed breakout occurs, the first key resistance zone lies significantly higher, giving plenty of room for growth.
SushiSwap, the DeFi platform behind SUSHI, remains an integral player in the decentralized exchange (DEX) space. As the broader DeFi narrative gains traction again, ecosystem tokens like SUSHI are seeing renewed investor interest. Combined with bullish technical signals, the fundamentals support the possibility of a strong rally in the near term, especially if market-wide sentiment improves.
✅ Show your support by hitting the like button and
✅ Leaving a comment below! (What is You opinion about this Coin)
Your feedback and engagement keep me inspired to share more insightful market analysis with you!

SUSHI/USDT Reversal from Historical Demand ZoneThe SUSHI/USDT pair is showing strong potential for a bullish reversal from the long-term demand zone between $0.44 - $0.58, which has historically acted as a solid support area since 2021. Price has tested this zone multiple times and has bounced back, indicating significant buying interest.
🔍 Technical Overview:
Timeframe: Weekly (1W)
Key Support Zone: $0.44 - $0.58 (strong accumulation area)
Key Resistance Levels (Potential Targets):
$0.815
$1.392
$1.950
$2.765
$3.500+
Price Structure: Currently forming a possible double bottom or sideways accumulation near the macro support, often seen before bullish markup phases.
Bullish Signal: The yellow arrow illustrates a projected upward movement over the coming weeks/months if the support holds.
After a prolonged downtrend, SUSHI/USDT is now at a critical turning point, bouncing from a multi-year support zone. This accumulation phase may be the early stage of a major bullish trend. Traders should keep an eye on this setup as a breakout toward higher resistance levels could be imminent.
#SUSHI #SUSHIUSDT #CryptoAnalysis #Altcoins #CryptoReversal #TechnicalAnalysis #CryptoSupportResistance
#BullishReversal #CryptoSignals #PriceAction #ChartPattern

#SUSHI/USDT#SUSHI
The price is moving in a head and shoulders pattern on the 1-hour frame, adhering well to it, and is heading for a strong breakout upwards and retesting it, forming the right shoulder.
We have a bounce from the lower channel line to the right shoulder, which is support at 0.620.
We have a downtrend on the RSI indicator that is about to be broken and retested, supporting the upside.
We have a trend of consolidation above the 100 moving average.
Entry price: 0.629
First target: 0.637
Second target: 0.650
Third target: 0.666

#SUSHI/USDT#SUSHI
The price is moving within a descending channel on the 1-hour frame and is expected to break and continue upward.
We have a trend to stabilize above the 100 moving average once again.
We have a downtrend on the RSI indicator, which supports the upward move by breaking it upward.
We have a support area at the lower limit of the channel at 0.616, acting as strong support from which the price can rebound.
Entry price: 0.621
First target: 0.634
Second target: 0.643
Third target: 0.654

SUSHIUSDT 1W AnalysisSUSHI ~ 1W Analysis
#SUSHI This is the lowest support for now, buy from here with a short term target of at least 15%+ from here.

SUSHIUSDT Potentially BullishWe've seen some pretty significant move in the the crypto market in the last few days (maybe weeks) especially wiith BINANCE:BTCUSDT hitting the 104K area. It is more than expected that most coins will follow suit.
BINANCE:SUSHIUSDT is one of such coins and as it stands, it has broken a significant zone at the 0.7175 area and attempting a retest. If the zone holds as a new found support, we just might see another significant push phase targeting the 1.32 area. Until then, fingers crossed
Updates to follow!!!
Past results does not guarantee future results

SUSHIUSDT 1D AnalysisSUSHI ~ 1D Analysis
#SUSHI Buy when re -testing this support block with a short -term target of at least 10%+ from here.

SUSHIUSDT Holding Strong Support — Bullish Ahead?"SUSHIUSDT Technical analysis update.
SUSHIUSDT has respected a strong horizontal support zone for several years, as shown by multiple successful retests. Every dip into this support area has triggered a notable bounce.
Currently, SUSHI is once again bouncing off this major support, and the price action suggests potential for a larger bullish move ahead. Before the big rally price could correct, if the rally continues, then the next target $2.80–$3.40 level.

SUSHIUSDT 1WSUSHI ~ 1W Analysis
#SUSHI Buy gradually from here with a short -term target of at least 20%+. This is the lowest support for now.

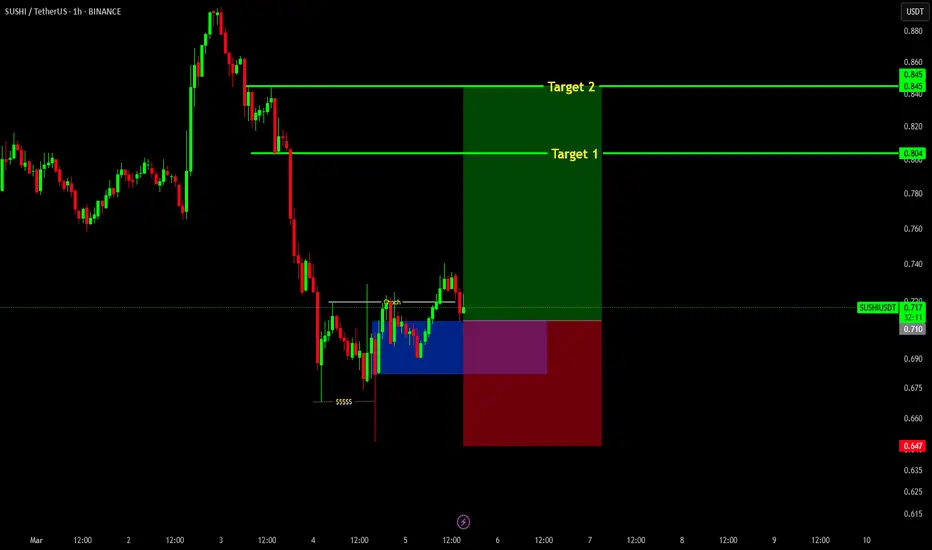
Sushi long trade setupSushi recently on 1hr time frame gave a proper ChOCh which is a bullish setup.
Entry region marked (blue box)
Stoploss at 0.647
Targets: 0.805, 0.845
#SUSHI/USDT#SUSHI
The price is moving in a descending channel on the 1-hour frame and is expected to continue upwards
We have a trend to stabilize above the moving average 100 again
We have a descending trend on the RSI indicator that supports the rise by breaking it upwards
We have a support area at the lower limit of the channel at a price of 0.850
Entry price 0.897
First target 0.924
Second target 0.947
Third target 0.980

SUSHIUSDT 1WSUSHI ~ 1W Analysis
#SUSHI This is the lowest support for now. Buy from here if you still have a Conviction on this coin with a minimum target of 20%+.

SUSHIUSDT 1WSUSHI ~ 1W
#SUSHI So far it continues to maintain its bullish structure. Buy in stages from here. with a minimum target of 20%++

#SUSHI/USDT Ready to go higher#SUSHI
The price is moving in a descending channel on the 1-hour frame and sticking to it well
We have a bounce from the lower limit of the descending channel, this support is at a price of 1.37
We have a downtrend on the RSI indicator that is about to be broken, which supports the rise
We have a trend to stabilize above the moving average 100
Entry price 1.45
First target 1.58
Second target 1.73
Third target 1.89

SUSHIUSDT 1WSUSHI Update ~ 1W
#SUSHI Retesting this support block,. If you still have Conviction on this coin,. Buy in stages from here. with a minimum target of 20%++

SUSHIUSDT Reversing from Major SupportSUSHIUSDT technical analysis update
SUSHI's price touched its major yearly support level this week, a zone it has bounced back from multiple times over the last four years. We can expect a bounce from this support level again.
Stop Loss: $0.45
Target :100%-300%
regards
Hexa

SUSHIUSDT 1WSUSHI ~ 1W
#SUSHI If you still have Conviction on the coin,. You need to pay attention to these support blocks,. So far this support Block continues to hold the price. Buy in stages and target at least 20%++


#SUSHIUSD 1 DAYSUSHIUSD 1-Day Analysis: Uptrend & Buy Opportunity
The SUSHIUSD pair is currently showing a robust upward trend on the daily chart, indicating strong bullish momentum. Recent price action suggests a solid support level has formed, providing a favorable entry point for potential buyers. Key indicators, including moving averages and RSI, further reinforce the uptrend, signaling increasing buying interest.
Market sentiment appears positive, driven by recent developments in the DeFi space and increased user engagement on the SushiSwap platform. This favorable environment presents a compelling buy opportunity for traders looking to capitalize on potential price appreciation.
As always, it’s crucial to consider risk management strategies and stay updated on market news to make informed decisions.
SLong
