#SXP/USDT looking extremely bullish#SXP
The price is moving in a descending channel on the 1-hour timeframe. It has reached the lower boundary and is heading towards breaking above it, with a retest of the upper boundary expected.
We have a downtrend on the RSI indicator, which has reached near the lower boundary, and an upward rebound is expected.
There is a key support zone in green at 0.0588. The price has bounced from this level multiple times and is expected to bounce again.
We have a trend towards consolidation above the 100-period moving average, as we are moving close to it, which supports the upward movement.
Entry price: 0.0612
First target: 0.0651
Second target: 0.0696
Third target: 0.0755
Don't forget a simple point: money management.
Place your stop-loss below the support zone in green.
For any questions, please leave a comment.
Thank you.
Sxpusd

#SXP/USDT looking extremely bullish#SXP
The price is moving in a descending channel on the 1-hour timeframe. It has reached the lower boundary and is heading towards breaking above it, with a retest of the upper boundary expected.
We have a downtrend on the RSI indicator, which has reached near the lower boundary, and an upward rebound is expected.
There is a key support zone in green at 0.0595. The price has bounced from this level multiple times and is expected to bounce again.
We have a trend towards consolidation above the 100-period moving average, as we are moving close to it, which supports the upward movement.
Entry price: 0.0630
First target: 0.0666
Second target: 0.0703
Third target: 0.0748
Don't forget a simple principle: money management.
Place your stop-loss below the support zone in green.
For any questions, please leave a comment.
Thank you.

#SXP/USDT looking extremely bullish#SXP
The price is moving within an ascending channel on the 1-hour timeframe and is adhering to it well. It is poised to break out strongly and retest the channel.
We have a downtrend line on the RSI indicator that is about to break and retest, which supports the upward move.
There is a key support zone in green at 0.0882, representing a strong support point.
We have a trend of consolidation above the 100-period moving average.
Entry price: 0.0907
First target: 0.0910
Second target: 0.0952
Third target: 0.0983
Don't forget a simple money management rule:
Place your stop-loss order below the green support zone.
Once you reach the first target, save some money and then change your stop-loss order to an entry order.
For any questions, please leave a comment.
Thank you.

#SXP/USDT looking extremely bullish#SXP
The price is moving within a descending channel on the 1-hour frame, adhering well to it, and is heading for a strong breakout and retest.
We have a bearish trend on the RSI indicator that is about to be broken and retested, which supports the upward breakout.
There is a major support area in green at 0.1205, which represents a strong support point.
We are heading for consolidation above the 100 moving average.
Entry price: 0.1282
First target: 0.1309
Second target: 0.1351
Third target: 0.1394
Don't forget a simple matter: capital management.
When you reach the first target, save some money and then change your stop-loss order to an entry order.
For inquiries, please leave a comment.
Thank you.

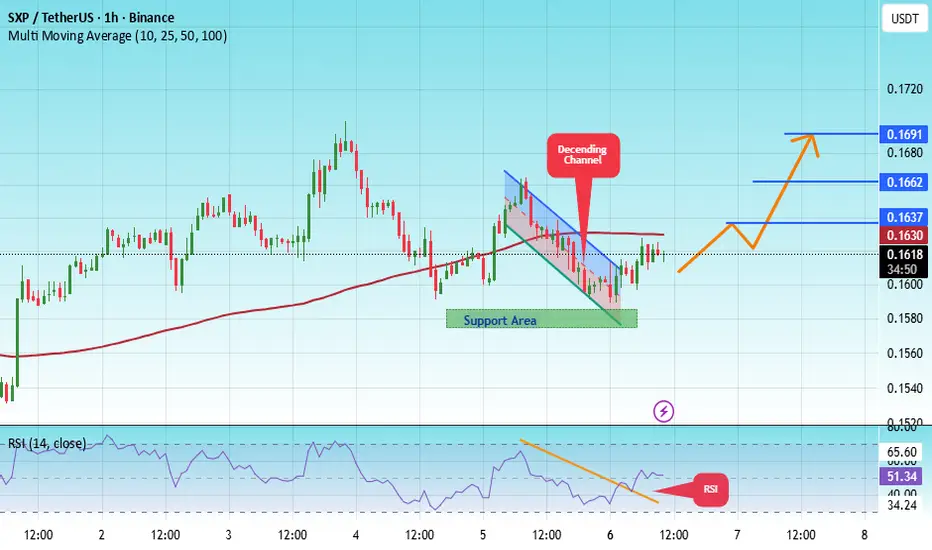
#SXP/USDT looking extremely bullish #SXP
The price is moving within a descending channel on the 1-hour frame, adhering well to it, and is heading for a strong breakout and retest.
We have a bearish trend on the RSI indicator that is about to be broken and retested, which supports the upward breakout.
There is a major support area in green at 0.1580, which represents a strong support point.
We are heading for consolidation above the 100 moving average.
Entry price: 0.1619
First target: 0.1637
Second target: 0.1662
Third target: 0.1691
Don't forget a simple matter: capital management.
When you reach the first target, save some money and then change your stop-loss order to an entry order.
For inquiries, please leave a comment.
Thank you.
SXP/USDT — Triangle Nearing Breakout, Bullish or Bearish?🔎 Summary
SXP/USDT is currently trading within a long-term contracting triangle pattern that has formed since late 2024. This setup indicates reduced volatility and energy build-up. As the price approaches the apex of the triangle, the probability of a strong breakout — either bullish or bearish — becomes increasingly high.
The latest close is around 0.1809 USDT, right at a critical decision zone.
---
🧩 Pattern & Key Technical Levels
Main pattern: Contracting triangle (lower highs + flat/slightly rising support).
Key support zone: 0.16–0.18 (highlighted yellow box).
Major structural low: 0.1416 USDT.
Step resistances (dashed lines):
0.2244 → 0.2536 → 0.2951 → 0.3836 → 0.4632 (with a major high at 0.4824).
Volume condition: Declining volume indicates market indecision. A confirmed breakout should come with a strong volume spike.
---
🚀 Bullish Scenario
Confirmation:
2D candle closes above 0.19–0.20.
Stronger confirmation once price breaks and holds above 0.2244 with notable volume.
Upside targets:
1. 0.2244 → first resistance.
2. 0.2536 → secondary psychological zone.
3. 0.2951 → major resistance, potential take-profit zone.
4. 0.3836 and 0.4632 → higher upside targets.
5. Measured move (aggressive target): Full triangle breakout could push price toward ~0.52 USDT.
---
🐻 Bearish Scenario
Confirmation:
2D close below 0.16 with failed retest.
Downside targets:
1. 0.1416 (major low).
2. If breakdown continues, market may seek new historical support below 0.13, though no clear structure is visible on this chart.
---
⚖️ Conclusion & Strategy
Neutral bias: As long as price remains inside the triangle, direction is undecided. Wait for breakout confirmation.
Bullish case: Safer entry above 0.2244 with strong volume.
Bearish case: Valid short setup if breakdown occurs below 0.16.
Note: Triangle breakouts often produce false moves (fakeouts) — always wait for candle close and volume confirmation.
---
📌 Key Notes for Traders
Apply risk management: risk only 1–3% of capital per trade.
Triangle breakouts tend to move fast and impulsively — use take-profit targets or trailing stops.
Keep an eye on overall crypto market sentiment, since SXP tends to follow BTC and ETH trends.
---
#SXP #SXPUSDT #Crypto #Breakout #TechnicalAnalysis #Altcoins #CryptoTrading #ChartAnalysis

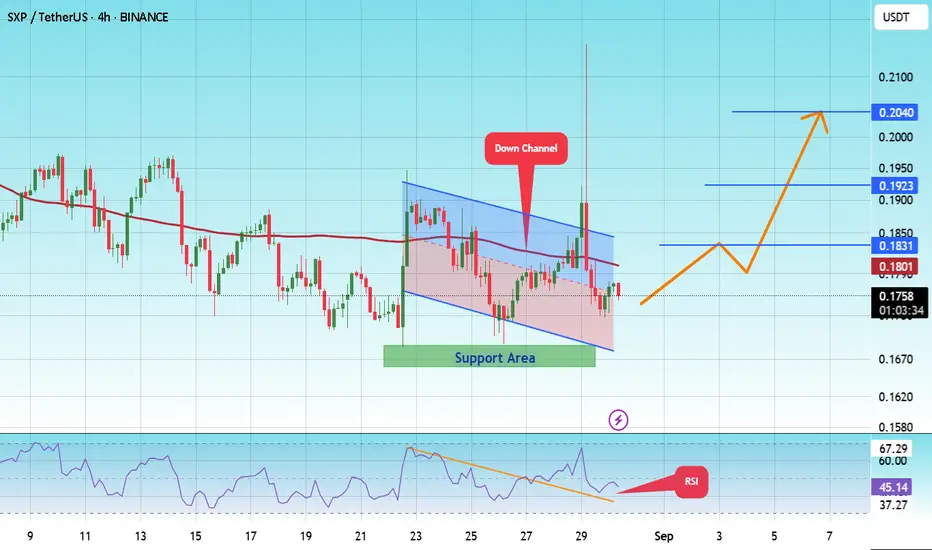
#SXP/USDT moment for try to Buy SXP .
#SXP
The price is moving within a descending channel on the 1-hour frame, adhering well to it, and is heading for a strong breakout and retest.
We have a bearish trend on the RSI indicator that is about to be broken and retested, supporting the upside.
There is a major support area (in green) at 0.1640, which represents a strong basis for the upside.
For inquiries, please leave a comment.
We are in a consolidation trend above the 100 moving average.
Entry price: 0.1772
First target: 0.1837
Second target: 0.1924
Third target: 0.2050
Don't forget a simple matter: capital management.
When you reach the first target, save some money and then change your stop-loss order to an entry order.
For inquiries, please leave a comment.
Thank you.
#SXP/USDT moment for try to Buy SXP.#SXP
The price is moving within a descending channel on the 1-hour frame, adhering well to it, and is heading for a strong breakout and retest.
We have a bearish trend on the RSI indicator that is about to be broken and retested, supporting the upside.
There is a major support area (in green) at 0.1640, which represents a strong basis for the upside.
For inquiries, please leave a comment.
We are in a consolidation trend above the 100 moving average.
Entry price: 0.1772
First target: 0.1837
Second target: 0.1924
Third target: 0.2050
Don't forget a simple matter: capital management.
When you reach the first target, save some money and then change your stop-loss order to an entry order.
For inquiries, please leave a comment.
Thank you.
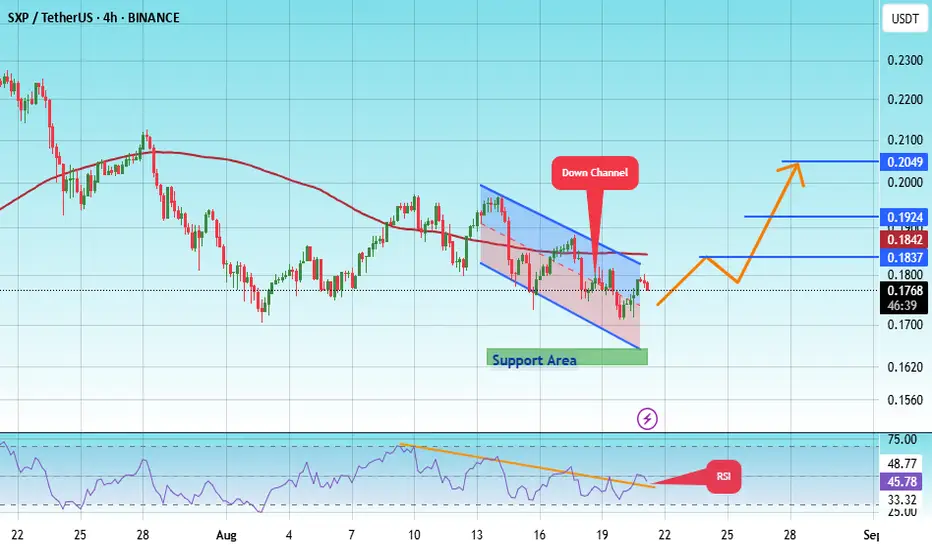
#SXP/USDT#SXP
The price is moving within a descending channel on the 1-hour frame, adhering well to it, and is heading for a strong breakout and retest.
We are seeing a rebound from the lower boundary of the descending channel, which is support at 0.1587.
We have a downtrend on the RSI indicator that is about to be broken and retested, supporting the upward trend.
We are looking for stability above the 100 Moving Average.
Entry price: 0.1624
First target: 0.1666
Second target: 0.1736
Third target: 0.1807

SXPUSDT 1W AnalysisSXP ~ 1W Analysis
#SXP This trade is very high risk. Buy if you still have confidence in this coin with a short term target of at least 20%+ from this support.

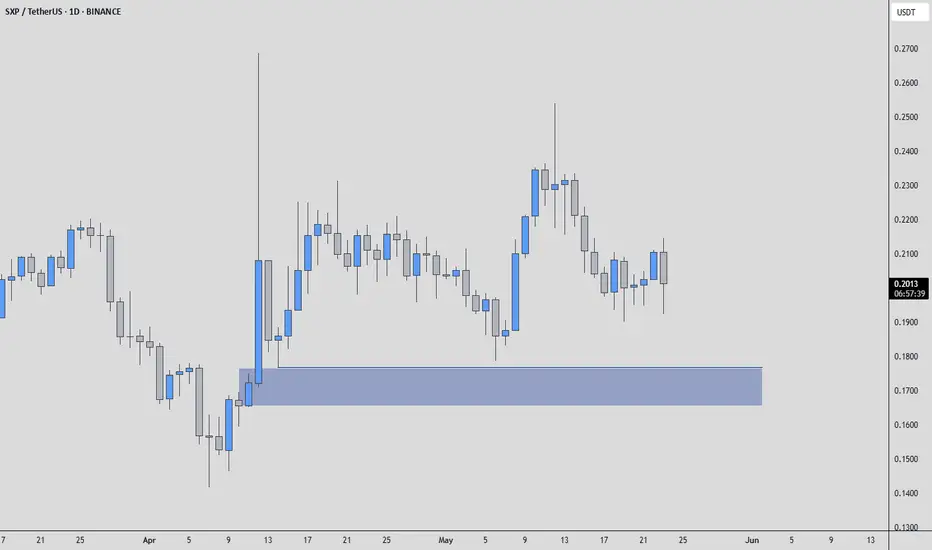
SXPUSDT | Clean Demand Zone BelowSXPUSDT is approaching a blue box that looks like a well-structured demand zone. The last reactions from this area were strong, and it may attract buyers again.
If price revisits that zone with low-timeframe confirmation, I’ll be watching closely. It’s not about predicting, it’s about reacting when the structure aligns.
“I will not insist on my short idea. If the levels suddenly break upwards and do not give a downward break in the low time frame, I will not evaluate it. If they break upwards with volume and give a retest, I will look long.”
Patience here could lead to precision. Let others rush. You wait with intent.
📌I keep my charts clean and simple because I believe clarity leads to better decisions.
📌My approach is built on years of experience and a solid track record. I don’t claim to know it all but I’m confident in my ability to spot high-probability setups.
📌If you would like to learn how to use the heatmap, cumulative volume delta and volume footprint techniques that I use below to determine very accurate demand regions, you can send me a private message. I help anyone who wants it completely free of charge.
🔑I have a long list of my proven technique below:
🎯 ZENUSDT.P: Patience & Profitability | %230 Reaction from the Sniper Entry
🐶 DOGEUSDT.P: Next Move
🎨 RENDERUSDT.P: Opportunity of the Month
💎 ETHUSDT.P: Where to Retrace
🟢 BNBUSDT.P: Potential Surge
📊 BTC Dominance: Reaction Zone
🌊 WAVESUSDT.P: Demand Zone Potential
🟣 UNIUSDT.P: Long-Term Trade
🔵 XRPUSDT.P: Entry Zones
🔗 LINKUSDT.P: Follow The River
📈 BTCUSDT.P: Two Key Demand Zones
🟩 POLUSDT: Bullish Momentum
🌟 PENDLEUSDT.P: Where Opportunity Meets Precision
🔥 BTCUSDT.P: Liquidation of Highly Leveraged Longs
🌊 SOLUSDT.P: SOL's Dip - Your Opportunity
🐸 1000PEPEUSDT.P: Prime Bounce Zone Unlocked
🚀 ETHUSDT.P: Set to Explode - Don't Miss This Game Changer
🤖 IQUSDT: Smart Plan
⚡️ PONDUSDT: A Trade Not Taken Is Better Than a Losing One
💼 STMXUSDT: 2 Buying Areas
🐢 TURBOUSDT: Buy Zones and Buyer Presence
🌍 ICPUSDT.P: Massive Upside Potential | Check the Trade Update For Seeing Results
🟠 IDEXUSDT: Spot Buy Area | %26 Profit if You Trade with MSB
📌 USUALUSDT: Buyers Are Active + %70 Profit in Total
🌟 FORTHUSDT: Sniper Entry +%26 Reaction
🐳 QKCUSDT: Sniper Entry +%57 Reaction
📊 BTC.D: Retest of Key Area Highly Likely
📊 XNOUSDT %80 Reaction with a Simple Blue Box!
📊 BELUSDT Amazing %120 Reaction!
📊 Simple Red Box, Extraordinary Results
I stopped adding to the list because it's kinda tiring to add 5-10 charts in every move but you can check my profile and see that it goes on..
#SXP/USDT#SXP
The price is moving within a descending channel on the 1-hour frame and is expected to break and continue upward.
We have a trend to stabilize above the 100 moving average once again.
We have a downtrend on the RSI indicator that supports the upward move with a breakout.
We have a support area at the lower boundary of the channel at 0.2030, which acts as strong support from which the price can rebound.
Entry price: 0.2115.
First target: 0.2190.
Second target: 0.2258.
Third target: 0.2357.

SXPUSDT 1D AnalysisSXP ~ 1D Analysis
#SXP Buy after successfully penetrating this resistant line or buy when re -testing this support block, with a short -term target of at least 10%+.

#SXP/USDT#SXP
The price is moving within a descending channel on the 1-hour frame, adhering well to it, and is on its way to breaking it strongly upwards and retesting it.
We are seeing a rebound from the lower boundary of the descending channel, which is support at 0.1915.
We have a downtrend on the RSI indicator that is about to break and retest, supporting the upward trend.
We are looking for stability above the 100 Moving Average.
Entry price: 0.1979
First target: 0.2016
Second target: 0.2065
Third target: 0.2121

SXPUSDT 1D AnalysisSXP ~ 1D Analysis
#SXP Buy after successfully penetrating this resistant line with a short -term target of at least 10%+ from here.

#SXP/USDT#SXP
The price is moving in a descending channel on the 1-hour frame and is expected to continue upwards
We have a trend to stabilize above the moving average 100 again
We have a descending trend on the RSI indicator that supports the rise by breaking it upwards
We have a support area at the lower limit of the channel at a price of 0.1970
Entry price 0.2094
First target 0.2147
Second target 0.2234
Third target 0.2320

SXPUSDT 1WSXP ~ 1W Analysis
#SXP Buy back gradually from here with a short -term target of at least 20%+ from here.

SXPUSDT | Today's Best Volume Gainer - Resistance AheadSXPUSDT has seen a significant volume surge today, making it one of the most actively traded coins. However, there is no reason to be bullish right now. Instead, we focus on key resistance zones for potential short opportunities.
🔴 Key Resistance Zones:
The red boxes mark strong resistance areas where sellers are likely to step in.
Low time frame breakouts will be closely monitored to confirm short opportunities.
⚠️ What Would Change My View?
If we regain these levels with strong volume and a proper retest, I might reconsider a bullish approach.
Until then, the smartest strategy is to wait for confirmation and short from resistance zones.
📌 Why You Should Pay Attention to This?
I don’t trade blindly - these levels are carefully calculated using volume footprint and time price opportunities. Most traders don’t even know about these advanced techniques, which is why my success rate is unmatched. You can check my profile and see the results for yourself.
👉 Stay disciplined, trade with confirmations, and don’t fall into emotional traps. The market will tell us what to do—we just need to listen!
📌I keep my charts clean and simple because I believe clarity leads to better decisions.
📌My approach is built on years of experience and a solid track record. I don’t claim to know it all but I’m confident in my ability to spot high-probability setups.
📌If you would like to learn how to use the heatmap, cumulative volume delta and volume footprint techniques that I use below to determine very accurate demand regions, you can send me a private message. I help anyone who wants it completely free of charge.
🔑I have a long list of my proven technique below:
🎯 ZENUSDT.P: Patience & Profitability | %230 Reaction from the Sniper Entry
🐶 DOGEUSDT.P: Next Move
🎨 RENDERUSDT.P: Opportunity of the Month
💎 ETHUSDT.P: Where to Retrace
🟢 BNBUSDT.P: Potential Surge
📊 BTC Dominance: Reaction Zone
🌊 WAVESUSDT.P: Demand Zone Potential
🟣 UNIUSDT.P: Long-Term Trade
🔵 XRPUSDT.P: Entry Zones
🔗 LINKUSDT.P: Follow The River
📈 BTCUSDT.P: Two Key Demand Zones
🟩 POLUSDT: Bullish Momentum
🌟 PENDLEUSDT.P: Where Opportunity Meets Precision
🔥 BTCUSDT.P: Liquidation of Highly Leveraged Longs
🌊 SOLUSDT.P: SOL's Dip - Your Opportunity
🐸 1000PEPEUSDT.P: Prime Bounce Zone Unlocked
🚀 ETHUSDT.P: Set to Explode - Don't Miss This Game Changer
🤖 IQUSDT: Smart Plan
⚡️ PONDUSDT: A Trade Not Taken Is Better Than a Losing One
💼 STMXUSDT: 2 Buying Areas
🐢 TURBOUSDT: Buy Zones and Buyer Presence
🌍 ICPUSDT.P: Massive Upside Potential | Check the Trade Update For Seeing Results
🟠 IDEXUSDT: Spot Buy Area | %26 Profit if You Trade with MSB
📌 USUALUSDT: Buyers Are Active + %70 Profit in Total
🌟 FORTHUSDT: Sniper Entry +%26 Reaction
🐳 QKCUSDT: Sniper Entry +%57 Reaction
📊 BTC.D: Retest of Key Area Highly Likely
📊 XNOUSDT %80 Reaction with a Simple Blue Box!
📊 BELUSDT Amazing %120 Reaction!
I stopped adding to the list because it's kinda tiring to add 5-10 charts in every move but you can check my profile and see that it goes on..

#SXP/USDT#SXP
The price is moving in a descending channel on the 1-hour frame and is adhering to it well and is heading to break it strongly upwards and retest it
We have a bounce from the lower limit of the descending channel, this support is at a price of 0.2050
We have a downtrend on the RSI indicator that is about to break and retest, which supports the rise
We have a trend to stabilize above the moving average 100
Entry price 0.2087
First target 0.2167
Second target 0.2247
Third target 0.2350

SXPUSDT 1WSXP ~ 1W Analysis
#SXP Buy gradually from here with a short -term target of at least 20%+
The reason, this is the lowest support for now.

SXPUSDT 1WSXP ~ 1W Analysis
#SXP This is the lowest support for now. buy gradually from here with a minimum target of 20%+

#SXP/USDT#SXP
The price is moving in a descending channel on the 1-hour frame and is expected to continue upwards
We have a trend to stabilize above the moving average 100 again
We have a descending trend on the RSI indicator that supports the rise by breaking it upwards
We have a support area at the lower limit of the channel at a price of 0.2870
Entry price 0.2913
First target 0.2984
Second target 0.3100
Third target 0.3213

SXPUSDT Analysis: Believe Me, It’s BigFolks, the blue boxes here? They’re incredible, just incredible. These are the kind of demand zones you dream about. Let me tell you, when we go below the green line , I’ll be ready. It’s all about patience and timing. Nobody knows this better than me.
Here’s What You Need to Know:
Blue Boxes: The best zones, carefully picked. Only winners here.
Trigger Point: Below the green line is where the action starts.
Top Tools: I’ll use CDV, liquidity heatmaps, volume profiles, and volume footprints. The best tools, the greatest strategies, total precision.
Want to Learn From the Best? Look, I can teach you how to use CDV, liquidity heatmaps, volume profiles, and volume footprints . Just DM me. You’ll be learning from someone who knows how to win, believe me.
Remember This: Big trades come from big levels. Don’t rush, wait for the best opportunities. Only the best, folks.
If this helped you, boost it, comment on it, share it far and wide. Let’s make trading great again together!
Let me tell you, folks, this is amazing. Nobody does analysis like I do. Believe me. If this helps you, don't forget to boost and comment! It’s a big deal, motivates me to share even more winning insights with you. Tremendous insights.
I keep my charts the best—clean, simple, and clear. You know it, I know it, clarity leads to better decisions. No question about it. My approach? Built on years of tremendous experience. Incredible track record. I don’t claim to know it all, but I spot high-probability setups like nobody else. Trust me.
Want to learn how to use the heatmap, cumulative volume delta, and volume footprint techniques I use to determine demand regions with stunning accuracy? Send me a private message—totally free, folks. That’s right. I help anyone who wants it, absolutely no charge. Unbelievable value.
Here’s the list—long list, great list—of some of my previous incredible analyses. Each one, a winner:
🎯 ZENUSDT.P: Patience & Profitability | %230 Reaction from the Sniper Entry
🐶 DOGEUSDT.P: Next Move
🎨 RENDERUSDT.P: Opportunity of the Month
💎 ETHUSDT.P: Where to Retrace
🟢 BNBUSDT.P: Potential Surge
📊 BTC Dominance: Reaction Zone
🌊 WAVESUSDT.P: Demand Zone Potential
🟣 UNIUSDT.P: Long-Term Trade
🔵 XRPUSDT.P: Entry Zones
🔗 LINKUSDT.P: Follow The River
📈 BTCUSDT.P: Two Key Demand Zones
🟩 POLUSDT: Bullish Momentum
🌟 PENDLEUSDT.P: Where Opportunity Meets Precision
🔥 BTCUSDT.P: Liquidation of Highly Leveraged Longs
🌊 SOLUSDT.P: SOL's Dip - Your Opportunity
🐸 1000PEPEUSDT.P: Prime Bounce Zone Unlocked
🚀 ETHUSDT.P: Set to Explode - Don't Miss This Game Changer
🤖 IQUSDT: Smart Plan
⚡️ PONDUSDT: A Trade Not Taken Is Better Than a Losing One
💼 STMXUSDT: 2 Buying Areas
🐢 TURBOUSDT: Buy Zones and Buyer Presence
🌍 ICPUSDT.P: Massive Upside Potential | Check the Trade Update For Seeing Results
🟠 IDEXUSDT: Spot Buy Area | %26 Profit if You Trade with MSB
📌 USUALUSDT: Buyers Are Active + %70 Profit in Total
🌟 FORTHUSDT: Sniper Entry +%26 Reaction
🐳 QKCUSDT: Sniper Entry +%57 Reaction
📊 BTC.D: Retest of Key Area Highly Likely
And that’s just the start. The list goes on and on, folks. It’s a tremendous list, the best. I stopped adding because, frankly, it’s tiring. So many wins. People are amazed. You can check my profile and see for yourself—winning moves, all the time. Believe me, nobody does it better.
