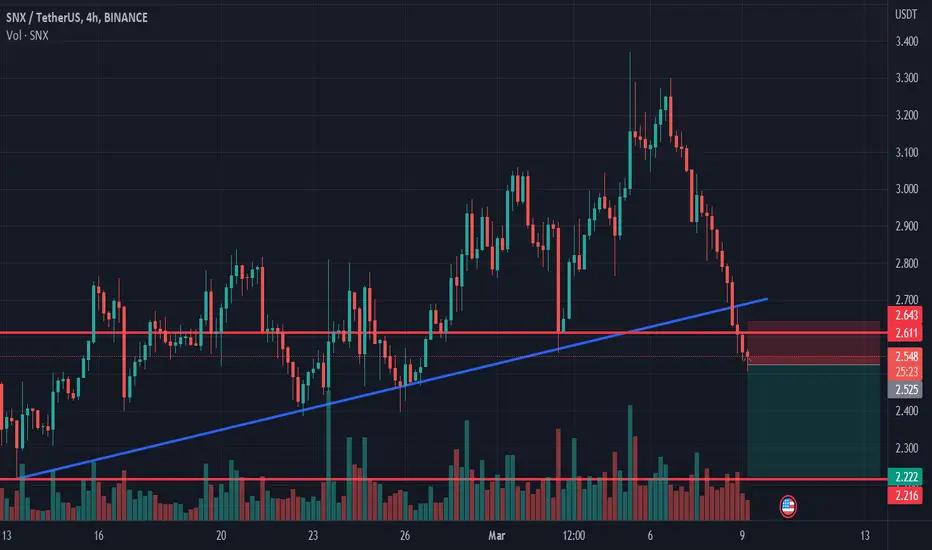
Syntetix longSynthetix bounced off the ascending trendline. Asset broke trough the resistance level. Bullish movement to resistance level at 3.2 is possible.
Synthetix

Synthetix longSynthetix broke trough the descending trendline. Asset broke trough the resistance level. Bullish movement to resistance level at 3.2 is expected to happen.

long SNX$SNX bounced off the support level. Bullish movement to resistance level at 3.32$ is likely to happen

#Synthetix in a Bull Flag after a 45% SurgePast Performance of Synthetix
Synthetix prices are firm, adding roughly 45% from last week's lows. Though prices are inside a bull flag, buyers are determined to press on. In the short term, resistance remains at around $3.3. Any surge above this reaction line may see the token break higher, printing new 2023 highs in continuation of buying pressure from Q4 2022.
#Synthetix Technical Analysis
The bull bars of March 12 and 13 define the current uptrend. Buyers may be in control from the daily chart, but prices are bound within the two bullish engulfing bars. Though this is positive from an effort versus result perspective, there needs to be a strong push above the flag and $3.3 for a trend continuation. Therefore, considering the setup in the daily chart, aggressive traders may load the dips above the base of the flag at around $2.5 with targets at $3.3. Meanwhile, conservative traders can wait for a clean, high-volume break above Q1 2023 highs before ramping up with targets at $3.6 and $4.2. In this way, they will align with the dominant trend established in Q4 2022.
What to Expect from #SNX?
Traders are positive, but there must be a clear trend definition in the short term, above or below the current consolidation. Any upswing may draw demand, pushing SNX to new levels.
Resistance level to watch out for: $3.3
Support level to watch out for: $2.5
Disclaimer: Opinions expressed are not investment advice. Do your research.

SNX price has growth prospects for at least x2-x3. Where to buy?Last week, buyers of SNX were very active and managed to organize a +70% increase.
This is a good result, but they still failed to break through the trend line that has been stretching since the beginning of 2021 and consolidating price above it.
(If you narrow the chart, you will see the entire trading history of SNXUSDT)
And although it was not possible to break above the trend line, this maneuver indicates that we need to monitor SNX more carefully.
If you asked us where it is safe to buy SNX in your medium or long-term investment portfolio, we would answer:
if the SNXUSDT price does not fall below $2.20 in the coming days/weeks, it is a strong long.
Or wait for SNX buyers to break through the upward trend line and gain a foothold above $3.15
The choice is yours)
_____________________
Did you like our analysis? Leave a comment, like, and follow to get more

SNXUSD Steady bullish breakoutSNXUSD crossed over the Bear market's Falling Resistance for the 2nd time this month on a clear long term bullish signal.
It is already 3 weeks after the Golden Cross (1d) formation.
Trading Plan:
1. Buy on the current market price.
Targets:
1. All Fibinacci retracement levels on by one up to 9.000 (Fibonacci 0.618, the Golden ratio).
Tips:
1. The MACD (1d) is on a Rising Support. Indicating a tend shift to long term bullish.
Please like, follow and comment!!

Upward Trend Despite Recent VolatilitySynthetix Network Token (SNX) is a digital asset currently trading at $2,850 per token. Looking at the daily timeframe, the Relative Strength Index (RSI) is now at 54.5, indicating that the asset is not overbought or oversold. The volume oscillator is at 5.67%, which suggests that there has been moderate trading activity in the asset.
When considering the Fibonacci levels, the 0 Fibonacci level is at 2.219, the 0.5 Fibonacci level is at 2.660, and the 1 Fibonacci level is at 3.100. These levels indicate possible support and resistance levels for the asset. The daily timeframe upper Bollinger band is at 3.239, the middle Bollinger band is at 2.720, and the lower Bollinger band is at 2.200. These bands provide additional information on the asset's volatility and potential trading ranges.
Looking at the Moving Average Convergence Divergence (MACD), the value is 0.008, indicating a bullish signal. The Stochastic Oscillators are at 62.11, suggesting that the asset is trending upward.
The price of SNX has fallen by 10.80% in the past seven days. However, there has been a recent increase in price by 32.82% in the last 24 hours, and in the past hour alone, the price has grown by 2.00%. Notably, the current $2.86 per SNX is 90.07% below the all-time high of $28.77.
Based on the given information, SNX is in an upward trend. However, it is important to remember the possible resistance levels provided by the Fibonacci levels and Bollinger bands. Additionally, the asset's recent history of volatility and drastic price changes should be considered when considering investments in SNX.

SNXUSDT(Synthetix) Daily tf Range Updated till 13-03-23SNXUSDT(Synthetix) Daily timeframe range. the daily candle trying to stay above #2.764 which open a way till #3.531. a big part depend on market sentiment and how far btc retrace as we had a lots of negative news recently. it needs a little bit of more volume here.

Synthetix shortSynthetix broke trough the ascending trendline. Asset broke trough the support level. Bearish movement to support level at 2.222 is possible.
SNX (Y23.P1.Video1). Bullish signsHi Traders,
#crytpo #snx #syntheticNetwork
As I explain the macro and current price range, I see opportunities which I explain.
So we plan and if conditions are met, we execute.
Please give me a like and share,
Regard,
S.SAri

long SNX$SNX broke through the resistance level. Bullish movement to the resistance level at 3.56$ is likely to happen.

✳️ Synthetix Bullish Continuation = Bullish Confirmation (80%+)Synthetix (SNXBTC) today confirms its bullish bias by producing a strong breakout above EMA300 and MA200.
Bullish continuation = bullish confirmation. 😉
It is now confirmed, once more, that the bulls own this market.
You can expect much more growth.
You can read the 'Related Ideas' below for the previous charts and also to find AGIXBTC which can help you determine how far up SNXBTC will go.
To know how far up the USDT pairs will go, check FETUSDT.
I hope that helps.
Namaste.

Synthetix shortSynthetix broke trough the support level. Asset broke trough the ascending trendline. Bearish movement to support level at 2.6 is possible.

long SNX$SNX is bouncin off the support level and the ascending trendline. Bullish movement to 2.91$ is likely to happen.

Synthetix shortSynthetix broke trough the support level. Asset broke trough the ascending trendline. Bearish movement to support level at 1.83 is possible.

Synthetix (SNX) formed bullish BAT | A good buy opportunityHi dear friends, hope you are well and welcome to the new update on Synthetix ( SNX ) token with BTC pair.
On a 4-hr time frame, SNX has formed a bullish BAT move.
Note: Above idea is for educational purpose only. It is advised to diversify and strictly follow the stop loss, and don't get stuck with trade

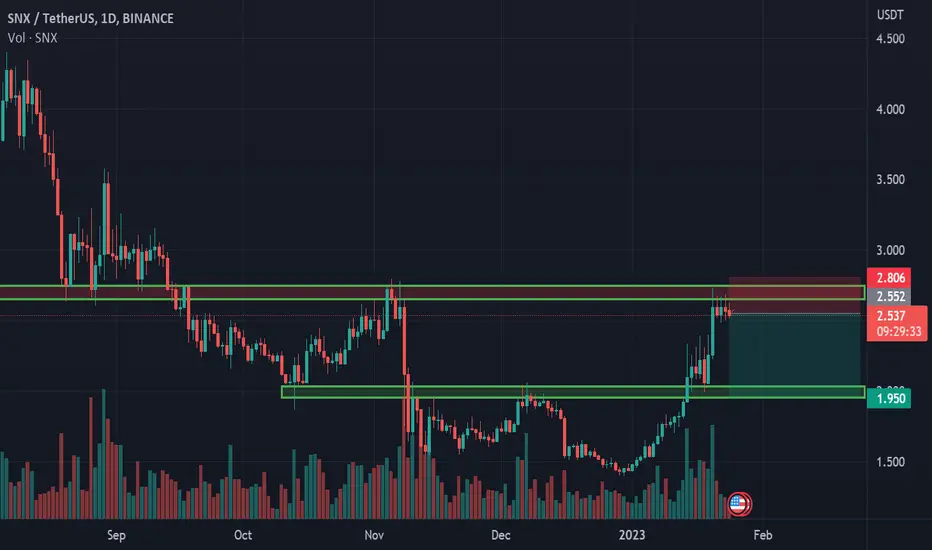
short SNX$SNX bounced off the resistance level. Decline to support level at $1.95$ is likely to happen.
SNXUSD About to test the mid-2021 Resistance!It was just 2 months ago when we called for a short-term bullish move on Synthetix (SNXUSD) and projected a major break-out in January 2023:
The projection was modelled out of the Lower High legs of the Bear Cycle since May 18 2021. All three fractals pointed to a break of the May 2021 Lower Highs trend-line by the end of January 2023, with the one that has come the closest in candle action being the black. As you see not only did it hold the Support Zone but at the same time matched perfectly the January rebound that followed.
Ideally we would like to see a weekly candle closing above the 1W MA50 (red trend-line) for the first time since September 2021, but the Lower Highs trend-line would be a significant break-out on its own.
The Fibonacci retracement levels can provide a fair target framework SNX marches its way into the new Bull Cycle.
-------------------------------------------------------------------------------
** Please LIKE 👍, FOLLOW ✅, SHARE 🙌 and COMMENT ✍ if you enjoy this idea! Also share your ideas and charts in the comments section below! This is best way to keep it relevant, support me, keep the content here free and allow the idea to reach as many people as possible. **
-------------------------------------------------------------------------------
💸💸💸💸💸💸
👇 👇 👇 👇 👇 👇


✳️ Synthetix vs Bitcoin Also Looks Good For Easy 100%SNXBTC has the same chart as everything else in this market... Follow me!
A long-term higher low, Dec. vs June 2022.
Strong RSI near support.
Trading above EMA10.
After the big altcoins grow, it is time for the small ones to follow.
We were expecting for everything to grow and these charts are pointing to just that.
Expect the BTC pairs to move ahead.
Not only this one, I saw many, many others with similar charts.
The growth can happen fast.
Big strong candles... Be prepared.
Set your sell order on target before the action starts.
Do not wait to sell manually, build a plan and deploy it.
Namaste.


#Synthetix Expanding with Rising Volumes, Resistance at $2.05Past Performance of Synthetix
Synthetix is up 46 percent from the December low and relatively stable, checking the performance in the daily chart. As asset prices soar, SNX is stagnant, trading below the $2.05 resistance level. Even so, the leg up in the past few days places buyers at a pole position for a breakout toward new Q1 2023 highs.
#Synthetix Technical Analysis
Traders are upbeat, expecting more. In the daily chart, SNX traders may look for more gains in the days ahead. Notice that losses of December 16 have been reversed at the back of increasing trading volumes. This is a net positive from an effort versus result perspective, a refreshing development after losses in 2022. Given that SNX bars align along the upper BB and the coin above December 16 highs, every low provides an opportunity for optimistic traders to load the dips, targeting $2.05. Unexpected contractions pushing SNX below $1.50 and the middle BB nullify this bullish outlook.
What to Expect from #SNX?
SNX prices are stable, but volatility is low. The upside momentum is strong, with signs that Synthetix could break above $2.05 in continuation of gains traced to late December. As it is, SNX is firm as long as prices are above the middle BB and $1.50.
Resistance level to watch out for: $2.05
Support level to watch out for: $1.50
Disclaimer: Opinions expressed are not investment advice. Do your research.

Synthetix (SNX) forming bullish BAT for upto 17% moveHi dear friends, hope you are well and welcome to the new update on Synthetix ( SNX ) token with BTC pair.
On a daily time frame, SNX is about to complete the final leg of bullish BAT move.
Note: Above idea is for educational purpose only. It is advised to diversify and strictly follow the stop loss, and don't get stuck with trade
