#SYS/USDT looks very bullish#SYS
The price is moving in a descending channel on the 1-hour timeframe. It has reached the lower boundary and is heading towards breaking above it, with a retest of the upper boundary expected.
We have a downtrend on the RSI indicator, which has reached near the lower boundary, and an upward rebound is expected.
There is a key support zone in green at 0.01738. The price has bounced from this level multiple times and is expected to bounce again.
We have a trend towards stability above the 100-period moving average, as we are moving close to it, which supports the upward movement.
Entry price: 0.01781
First target: 0.01810
Second target: 0.01858
Third target: 0.01910
Stop loss: Below the support zone in green.
Don't forget a simple thing: capital management.
For inquiries, please leave a comment.
Thank you.
SYSBTC

#SYS/USDT looks very bullish#SYS
The price is moving in a descending channel on the 1-hour timeframe. It has reached the lower boundary and is heading towards breaking above it, with a retest of the upper boundary expected.
We have a downtrend on the RSI indicator, which has reached near the lower boundary, and an upward rebound is expected.
There is a key support zone in green at 0.02100. The price has bounced from this level multiple times and is expected to bounce again.
We have a trend towards consolidation above the 100-period moving average, as we are moving close to it, which supports the upward movement.
Entry price: 0.02140
First target: 0.2170
Second target: 0.02211
Third target: 0.02262
Don't forget a simple principle: money management.
Place your stop-loss below the support zone in green.
For any questions, please leave a comment.
Thank you.

IS SYSCOIN DEAD OR NOT? A Deep Dive into the Potential RevivalI’ve recently found out some MC related stuff about SYSCOIN, that came to me as surprise. SYSCOIN was launched in 2014 and is one of the oldest coins still trading on BINANCE CEX. Coin once boasted a market cap of ~$730 M at its 2022 peak. Fast forward to March of last year (2024), it was still around ~$256 M MC. Now? We’re below $20 M. What happened???
On the weekly chart of SYS/BTC (or the coin/chart pair you’re using) I’m spotting a bullish divergence forming — this could be the sign of a reversal. My target zones are the EMA lines around 0.00000150 and 0.00000300 (light-blue = more believable). Coin support is around 0.00000020 (could still drop down there)
Fundamentally this coin looks stronger than ever: real-world adoption appears to be ramping up and its network hash rate has surged. Back in 2022 it was ~28 EH/s; now it’s reportedly closer to ~550 EH/s (~20× growth). So something is going on beneath the surface.
Source about Peru adopting SYSCOIN from the Syscoin official X channel: x.com
Maybe early holders got tired and exited, but the chart is suggesting that the bottom could be in—or at least very near. And if it reverses, what a reversal it could be.
Targets:
Short/mid-term: ~x4–x5 from current levels
Long-term: ~x10 if everything aligns
Let’s keep an eye on this one.

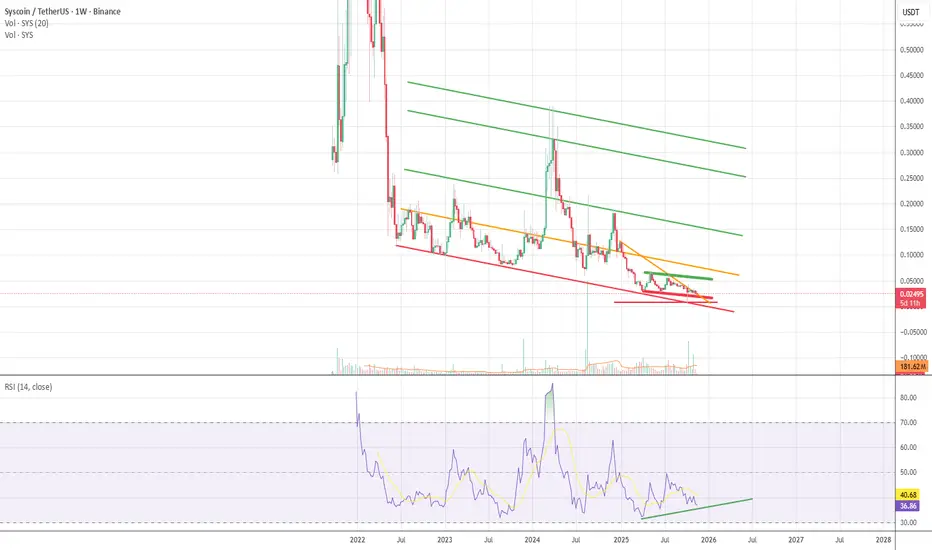
SYS Short Term Goals Still Apply🔵 SYSUSDT Long-Term Cycle Projection (Macro View)
1) Current Structure
SYS is sitting at the bottom of a multi-year descending channel.
Price is tapping long-term support while the RSI forms a clear bullish divergence
on the higher timeframes.
This is typically a bottoming pattern seen before new cycles begin.
2) Short term goals
Price range: 0.024–0.059
Market builds strength, volatility low, compression continues.
Reclaiming 0.059 = first bullish trigger.
Reclaiming 0.10 = confirmation of trend shift.
- Bullish divergence confirmed.
- Price at macro support.
- Accumulation phase likely ongoing.
- Break 0.10 to start the new cycle.
- Long-term structure supports strong upside potential across 2025–2027.
#SYS/USDT looks very bullish#SYS
The price is moving within an ascending channel on the 1-hour timeframe and is adhering to it well. It is poised to break out strongly and retest the channel.
We have a downtrend line on the RSI indicator that is about to break and retest, which supports the upward move.
There is a key support zone in green at 0.02790, representing a strong support point.
We have a trend of consolidation above the 100-period moving average.
Entry price: 0.03070
First target: 0.03200
Second target: 0.03330
Third target: 0.03500
Don't forget a simple money management rule:
Place your stop-loss order below the green support zone.
Once you reach the first target, save some money and then change your stop-loss order to an entry order.
For any questions, please leave a comment.
Thank you.

#SYS/USDT looks very bullish#SYS
The price is moving within an ascending channel on the 1-hour frame, adhering well to it, and is poised to break it strongly upwards and retest it.
We have support from the lower boundary of the ascending channel, at 0.04060.
We have a downtrend on the RSI indicator that is about to break and retest, supporting the upward move.
There is a key support area (in green) at 0.03980, which represents a strong basis for the upward move.
Don't forget one simple thing: ease and capital.
When you reach the first target, save some money and then change your stop-loss order to an entry order.
For inquiries, please leave a comment.
We have a trend of stability above the Moving Average 100.
Entry price: 0.04221
First target: 0.04356
Second target: 0.04483
Third target: 0.04635
Don't forget one simple thing: ease and capital.
When you reach the first target, save some money and then change your stop-loss order to an entry order.
For inquiries, please leave a comment.
Thank you.

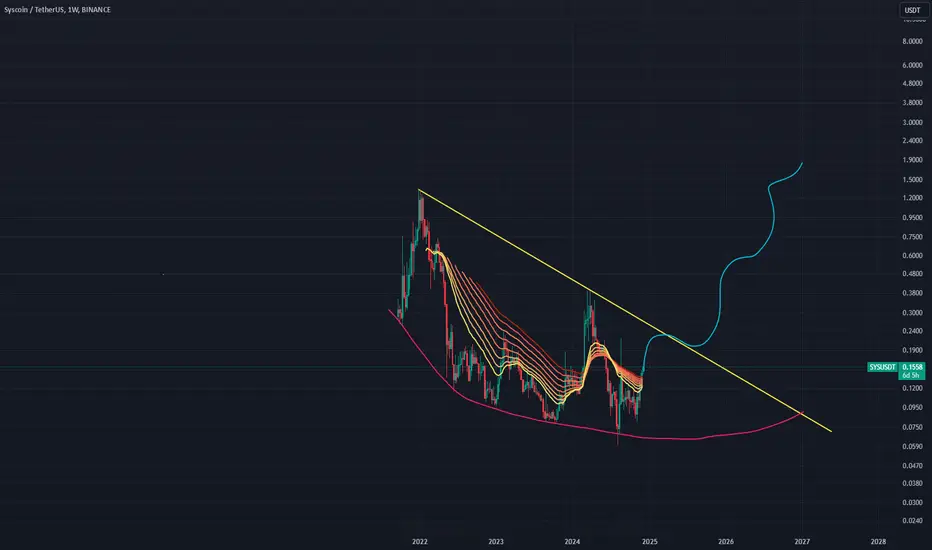
SYSUSDT idea - Bullish short/mid/long termThere’s quite a lot happening around Syscoin (SYS) lately, but from a trading perspective, I see strong potential for a 5x move by year-end, considering its relatively small market cap.
SYS aligns with several current market narratives — masternodes, zk-proofs, privacy, and “dino coin” appeal — which could attract renewed attention.
Technically, there’s a bullish divergence on the weekly chart, supporting a potential reversal. In my view, a 3x–5x short to mid-term move is realistic, with 10x long-term still on the table (that upper green line).
The only real issue right now seems to be low interest and awareness, but that can shift quickly once momentum picks up.
It’s also worth noting that Syscoin is one of the oldest listed coins on Binance, launched back in 2014 — it has survived multiple cycles, which is impressive in itself.

SYS — Perfect Retest & Dino Season Vibes Perfect retest of the red line at 0.006 (the recent flash crash level).
Next target zone is the orange line around 0.06–0.08.
After that brutal liquidation crash, price dipped deep — but SYS could be one of the few to turn it into an opportunity. Recent narratives around privacy coins (like ZCASH and ZEN) are heating up, and even DASH in the masternode category is performing solidly.
SYS, one of the OG coins (since 2014), still holds massive potential:
✅ Proof-of-Work
✅ Masternodes
✅ Privacy elements
It’s giving strong dino season energy — the old giants might rise again.
Final target: ~$0.3 (10x potential)**
But let’s stay modest — a 3–4x move by December looks realistic.

#SYS/USDT#SYS
The price is moving within a descending channel on the 1-hour frame and is expected to break and continue upward.
We have a trend to stabilize above the 100 moving average once again.
We have a downtrend on the RSI indicator, which supports the upward move by breaking it upward.
We have a support area at the lower limit of the channel at 0.0487, acting as strong support from which the price can rebound.
Entry price: 0.0500
First target: 0.0519
Second target: 0.0544
Third target: 0.0570

SYSUSDT | Still Weak, Resistance Holds at the Red BoxSYSUSDT continues to show fragile price action. Until the red‑boxed area is cleared with genuine volume support, every upward move remains suspect. Here’s how I’d approach it:
Expect Rejections at Resistance
The red box marks a zone where sellers have stepped in repeatedly. Unless SYS clears this level on strong volume, I’ll assume the path of least resistance remains downward.
Shorting on False Rallies
When price makes a pop toward the red box, I’ll wait for two key signals before entering a short:
Low‑Time‑Frame Breakdown: A clear shift in structure on a 5‑ or 15‑minute chart—think lower highs or breakdown of a minor support.
CDV Divergence: If cumulative delta volume fails to confirm the rally, it shows buying pressure is drying up.
Patience Is a Virtue
I won’t force trades when these conditions aren’t met. If SYSUSDT somehow breaks above the red box with conviction, I’ll reassess. Until then, I let the market’s own behavior guide each decision.
By focusing on volume‑backed breakouts and CDV confirmation, or the lack thereof—you avoid chasing moves and trade with genuine conviction.
📌I keep my charts clean and simple because I believe clarity leads to better decisions.
📌My approach is built on years of experience and a solid track record. I don’t claim to know it all but I’m confident in my ability to spot high-probability setups.
📌If you would like to learn how to use the heatmap, cumulative volume delta and volume footprint techniques that I use below to determine very accurate demand regions, you can send me a private message. I help anyone who wants it completely free of charge.
🔑I have a long list of my proven technique below:
🎯 ZENUSDT.P: Patience & Profitability | %230 Reaction from the Sniper Entry
🐶 DOGEUSDT.P: Next Move
🎨 RENDERUSDT.P: Opportunity of the Month
💎 ETHUSDT.P: Where to Retrace
🟢 BNBUSDT.P: Potential Surge
📊 BTC Dominance: Reaction Zone
🌊 WAVESUSDT.P: Demand Zone Potential
🟣 UNIUSDT.P: Long-Term Trade
🔵 XRPUSDT.P: Entry Zones
🔗 LINKUSDT.P: Follow The River
📈 BTCUSDT.P: Two Key Demand Zones
🟩 POLUSDT: Bullish Momentum
🌟 PENDLEUSDT.P: Where Opportunity Meets Precision
🔥 BTCUSDT.P: Liquidation of Highly Leveraged Longs
🌊 SOLUSDT.P: SOL's Dip - Your Opportunity
🐸 1000PEPEUSDT.P: Prime Bounce Zone Unlocked
🚀 ETHUSDT.P: Set to Explode - Don't Miss This Game Changer
🤖 IQUSDT: Smart Plan
⚡️ PONDUSDT: A Trade Not Taken Is Better Than a Losing One
💼 STMXUSDT: 2 Buying Areas
🐢 TURBOUSDT: Buy Zones and Buyer Presence
🌍 ICPUSDT.P: Massive Upside Potential | Check the Trade Update For Seeing Results
🟠 IDEXUSDT: Spot Buy Area | %26 Profit if You Trade with MSB
📌 USUALUSDT: Buyers Are Active + %70 Profit in Total
🌟 FORTHUSDT: Sniper Entry +%26 Reaction
🐳 QKCUSDT: Sniper Entry +%57 Reaction
📊 BTC.D: Retest of Key Area Highly Likely
📊 XNOUSDT %80 Reaction with a Simple Blue Box!
📊 BELUSDT Amazing %120 Reaction!
📊 Simple Red Box, Extraordinary Results
I stopped adding to the list because it's kinda tiring to add 5-10 charts in every move but you can check my profile and see that it goes on..

#SYS/USDT#SYS
The price is moving in a descending channel on the 1-hour frame and is adhering to it well and is heading to break it strongly upwards and retest it
We have a bounce from the lower limit of the descending channel, this support is at a price of 0.0474
We have a downtrend on the RSI indicator that is about to break and retest, which supports the rise
We have a trend to stabilize above the moving average 100
Entry price 0.0540
First target 0.0588
Second target 0.0624
Third target 0.0666

SYS looks very bullish (1D)It seems that a diametric pattern has completed, and the price has reclaimed a key level. A pullback to this level is expected to hold as support, potentially leading the price toward higher zones.
The targets are marked on the chart, and as long as the green zone is maintained, a move toward those targets is expected.
A daily candle closing below the invalidation level would invalidate this analysis.
For risk management, please don't forget stop loss and capital management
When we reach the first target, save some profit and then change the stop to entry
Comment if you have any questions
Thank You

#SYS/USDT#SYS
The price is moving in a descending channel on the 1-hour frame and is adhering to it well and is heading to break it strongly upwards
We have a bounce from the lower limit of the descending channel, this support is at a price of 0.0583
We have a downtrend on the RSI indicator that is about to be broken, which supports the rise
We have a trend to stabilize above the moving average 100
Entry price 0.0646
First target 0.0732
Second target 0.0800
Third target 0.0905

funny lines say syscoin 2 dollarsSYS is one of the oldest coins in the world and the chart is definitely one of the most messed up. Nevertheless at ETF we can reasonably expect a push to 2 dollars per SYS this cycle.

Bullish Continuation for SYS USDT on the cardsSYS has maintained its freshly claimed levels of 0.17-0.18 cents and has consolidated at these levels even with RSI cooling off, suggesting little if any sell-offs. Given the coin's history dating back to 2014, it is feasible to assume that vast quantities of coin are lost and the remaining community may be diamond handed. Despite doing a 2x no sell volume. Next target around 0.29 cents where we reassess.

SYS USDT parabolic growth approachingSYS USDT pair are entering a parabolic growth stage. Upward movement can be violent and reach its prior ATH at 1.35 USD after which SYS can head into price discovery
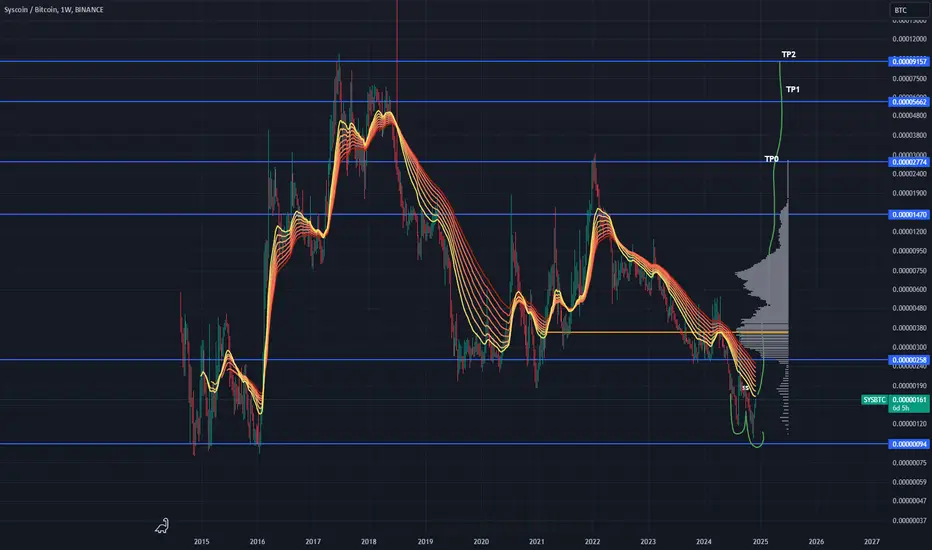
SYS BTC key levels to watch during upward movementSYS has reached the lowest levels against BTC since late 2015, a 9-year minimum (deviation). If it successfully reenters a range of 250-350 sats, the marked levels are key levels to watch and take profit.
Top target 8000 sats.
Not financial advice.
SYS USD long term bullish trend establishedAfter a tough bear market during which SYS went sub 10 cents, it has performed a recovery from the deviation at the bottom and has now switched bullish long-term

SYS Gold Buy opportunity, same Cycle with 0.22XX is loading SYSCOIN (SYS) has recently experienced a bounce from the bottom, but it's important to be cautious about its future direction.
Key Technical Analysis:
* Fakeout: The last pump was above the $0.117X level could be considered a fakeout, as the price has since retraced to the $.0970 Monthly support level.
* Potential Correction: A deeper correction towards the 0.08XX support levels is possible.
Remember:
* Do Your Own Research: Always conduct thorough research before making any investment decisions.
* Risk Management: Use stop-loss orders to protect your investments from potential losses.
* Diversification: Spread your investments across different assets to reduce risk.
Stay tuned for more updates on Radicle and other cryptocurrencies!
Disclaimer: This is not financial advice. Please do your own research before making any investment decisions.
TRY TO HAVE AN ADVENTAGE And DCA from here

SYS buy/long setupWe have a bullish QM on the chart. Bullish QM features are well observed on the chart.
By maintaining the green range, it can move towards the targets.
Closing a daily candle below the invalidation level will violate the analysis
For risk management, please don't forget stop loss and capital management
When we reach the first target, save some profit and then change the stop to entry
Comment if you have any questions
Thank You

#SYS/USDT#SYS
The price is moving within a bearish channel pattern on a 4-hour frame and broke it upward after adhering to it significantly.
We have a downtrend on the RSI indicator, and it has been broken to the upside, and we have a trend to hold above
We have a major support level in green at 0.1020
We have a trend of domes above the Moving Average 100
Entry price is 0.1050
The first target is 0.1116
The second target is 0.1170
The third goal is 0.1220

#SYS/USDT#SYS
The price is moving in a descending channel on a 1-hour frame, about to break to the upside
With a strong support area in green at 0.2000, from which the price has already rebounded
We have a trend to touch the Moving Average 100
We also have an uptrend on the RSI on which the price rests and pushes it upward
Entry price is 0.2066
The first target is 0.2200
The second target is 0.2400
The third goal is 0.2567

SYS BUY SETUPIt seems that we have an ABC that the wave B is a diametric. There is only one G wave left from Diametric. The low risk place to buy is the lower green box. Wave C can advance up to supply
For risk management, please don't forget stop loss and capital management
Comment if you have any questions
Thank You
