Syscoin (SYS) Bullish Consolidation (Strong Move Possible)Syscoin (SYSBTC) is now moving above EMA200 (brown line on the chart) on the daily timeframe, this can turn into really good news.
We have been seeing slow and steady growth, some sort of bullish consolidation take place... This is only the beginning.
As momentum builds up, when the last resistance is taken out around EMA300 and MA200, we can see a strong jump... The target is marked light green on the chart.
Namaste.
SYSBTC

SYSBUSD create hidden Bullish DivergenceSYSBUSD create hidden bullish divergence, recently SYSCOIN launch 4.2 #mainnet launch is just around the corner. As it is quite a substantial upgrade, we have given it a name!
Introducing Syscoin LUX!
TP will 0.2725

Scalping idea for SYSBTCIf BTC lets and SYS breaks the minor downtrend, it may go up to its nearest resistance zone.


$SYS seeking 200 daily average within the bullish channel$SYS seeking 200 daily average within the bullish channel.

SYSBTC Gonna PUMP SYSBTC gonna pump, bcz, now its create hidden bullish divergence!
1st TP 0.00000438
2nd TP 0.00000508


Syscoin lovers how does $25 sound?Oh man, wouldn't that be amazing. The team is still active as ever and the charts look amazing, hard to believe but I think we could get there.

pay attention... price will soon break trendline ... pay attention when price break gren trendline and EMA 20 cross EMA 50... it will be soon


PullbackAccording to Istanbul indicator, SYS get back to support. May be its a good level to try long.

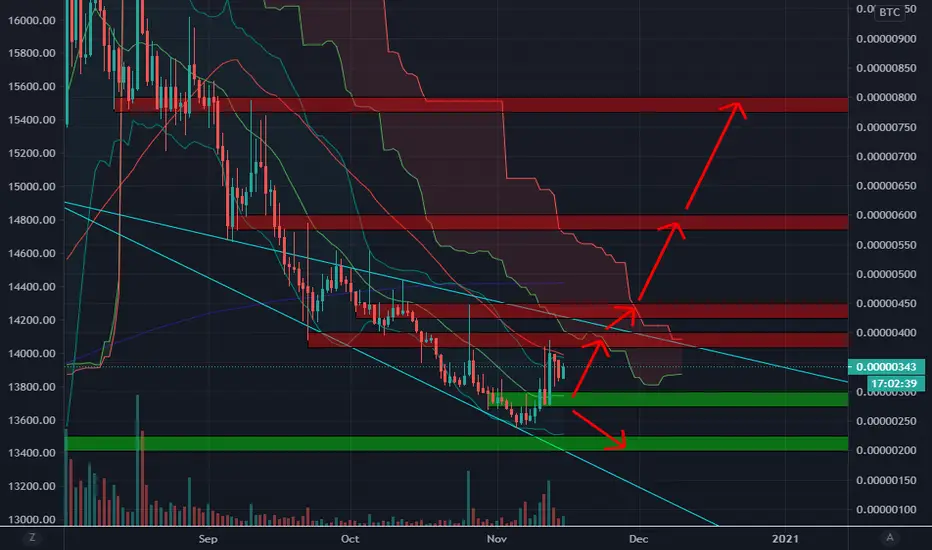
✳️Syscoin/BTC (2/12) View + Trading Plan #SYS $SYSSYS is in a fairly strong uptrend and is correcting to 450sts, which is a reliable support zone that we can buy here and wait for SYS to break the 600sts to strongly increase to the 800sts, 900sts and so on 1100sts
02 December, SYS will have some announcement that I think it will be a positive sign.
But if it closes a 1D candle below 425sts, that would be a bearish sign
📈BUY- LONG
-Buy: 425-450sts if A.SL if B
📉SELL-SHORT
-Sell: 575-600sts if B.SL if A
-Sell: 775-800sts if B.SL if A
-Sell: 900-950sts if B.SL if A
-Sell: 1100-1150sts if B.SL if A
♻️BACK-UP
-Sell: 425-450sts if B.SL if A
-Buy: 300-325sts.SL if B
❓Details
Condition A : "If 1D candle closes ABOVE this zone"
Condition B : "If 1D candle closes BELOW this zone"


✳️Syscoin/BTC (15/11) View + Trading Plan #SYS $SYSSYS is a coin with very strong volatility and pumps are often unstable, but during this rally, SYS has strong 1D candles and closes very high. So we can see that the money is flowing into SYS very strongly.
📈BUY- LONG
-Buy close to 275-300sts. Stoploss if B
-Buy more: 375-400sts if A. Stoploss if B
📉SELL-SHORT
-Sell: 425-450sts. Stoploss if A
-Sell: 575-600sts. Stoploss if A
-Sell: 775-800sts. Stoploss if A
♻️BACK-UP
-Sell close to 275-300sts if B. Stoploss if A
-Buy: 200-225sts. Stoploss if B
❓Details:
Condition A : "If 1D candle closes ABOVE this zone"
Condition B : "If 1D candle closes BELOW this zone"
SYS Syscoin Breakout and Correction - sysbtc sysusdt sysusdSYS Syscoin Breakout and Correction - sysbtc sysusdt sysusd

Syscoin (SYS) Weekly Bullish Bias Comes Forth (300.00%)The low for Syscoin (SYSBTC) was hit back in August 2019.
Many altcoins that are now growing strong hit new lows, a sign of weakness yet, these are making huge jumps.
Now, SYSBTC continues with higher lowers for years, signaling that its bullish move might be stronger than these other altcoins (you can find them by visiting my profile).
As for the chart, we have all the classic bullish signals we normally look at and chart patterns.
The next target and additional information can be found on the chart.
Thanks a lot for reading.
Namaste.

Sys/btc just broke gaint falling wedgeSys/btc
Was in the downtrend inside gaint falling wedge since 96 days
Today sys come with strong bullish green candel and just broke the falling wedge
If you are looking for buy then the best area
Will be after retest the trendline or horizontal support (previous accumulation zone) between
370-345 sat
the target will be around 580 sat or more
This is not financial advice
Trade at your own risk
Please support us by like And follow
Show your opinion in comments
Good luck

SYSBTC Intraday Trading OpportunityDear Subscribers,
today, we detected the new local SYSBTC price growth opportunity with the Automatic Engulfing Strategy.
The price broke the descending downward trend channel, which usually means it's consolidation with the further growth. The RSI Indicator also confirmed this assumption: the price bounced off the support line.
We expect the 4.1% price growth from 0.00000326 to 0.00000339. The alert was automatically executed by SkyRock Signals trading bot.

SYS Heading to Strong SupportSYS is Going to The Strong Support Zone and a Breakout
Strong Support Level : 212 - 276
Its a Good Buy Zone For Us. I Doubt That It Will Break Support Because RSI is Oversold.
Targets are : 350-400-450-500+
My Stop loss is at -7% From Buy / Support.
✅RSI : BULLISH
✅MOM: Bullish Momentum
❌SMA: Price Below SMA Bearish
✅ADI: +DI >DI BULLISH
✅MACD: Bullish
✅PSAR: Bullish
Like my Idea? Feel Free to Follow Me and If you like Please Hit That Like Button!, It Will Help Me A lot. <3 Bye!
