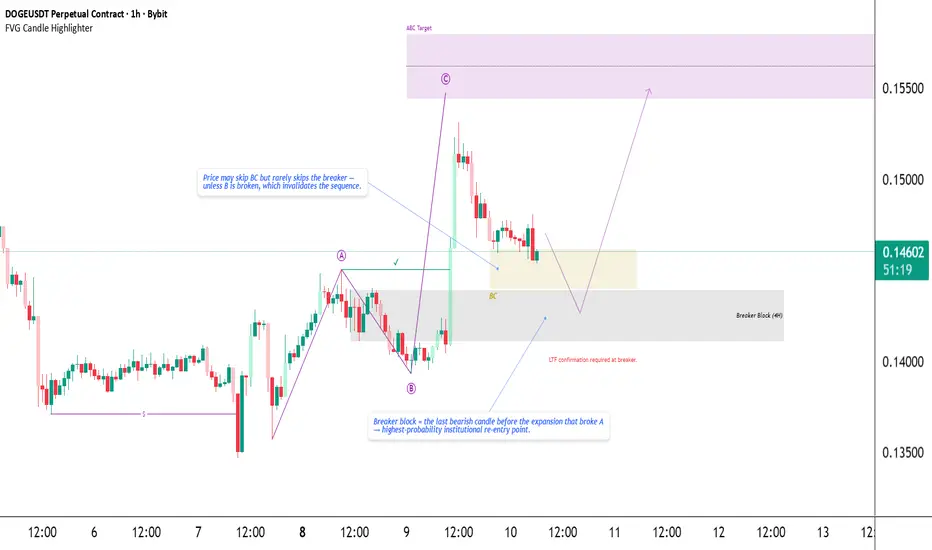
DOGE — SK Structure Breaker Block Re-Entry Toward C-TargetDOGE has completed a clean SK bullish sequence :
• A → B → C , with C breaking above A and confirming bullish intent.
• This expansion created two important reaction zones:
— BC zone → structural strength (broader discount area)
— Breaker Block → precision re-entry (highest probability)
From testing across assets, price may skip BC entirely, but it almost always respects the breaker block , as long as swing B remains protected.
➡️ If B breaks, the sequence is invalid.
Trade Plan
I’m waiting for price to retrace into the Breaker Block (4H) .
Inside that zone, I will look for LTF confirmation before entering — ideally a small BOS/MSS or shift in delivery.
Targets & Invalidation
• Target : The projected C-Target zone above
• Invalidation : ➡️ Any wick through B instantly invalidates the SK sequence — setup is dead.
This setup reflects my current blueprint:
Structure → Breaker → LTF confirmation → Ride back to C-Target.
Not financial advice.
System
SYS — Swing Trade SetupSystem Price is showing strong bullish momentum after holding the key support zone around 146–152 PKR.
The recent volume spike and RSI moving above 60 confirm positive momentum.
Ideal buying zone: Between CMP 156.39 and 152 PKR.
Stop Loss (SL): 145 PKR (closing basis) to protect downside risk.
Targets (TP):
• 165 PKR (first target)
• 171 PKR (second target)
• 180 PKR (extended target)
Structure favors continuation as long as the price stays above SL zone. Good swing trading opportunity with clear risk-reward levels.

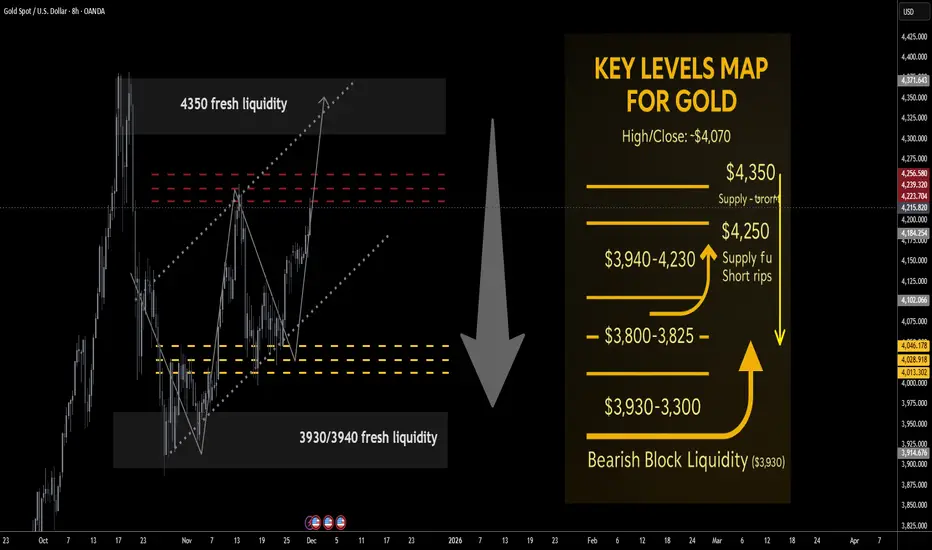
Gold next week Key S/R Levels and Outlook for Traders🔥 GOLD WEEKLY SNAPSHOT — BY PROJECTSYNDICATE
🏆 Swing High / Swing low:
$4,350 → ~$3,930 — clean rejection from the $4,350 bear-liquidity pocket, weekly close back inside prior range and below $4.1k.
📈 Trend:
Structural uptrend still intact above ~$3,900, but near-term momentum has flipped distributive: rallies into $4,250–$4,350 look like supply, not fresh markup. Upside is seen as asymmetric to the downside from overhead resistance.
🛡 Supports:
• $4,060–$4,020: first demand / reaction band below the close.
• $4,000–$3,960: psychological shelf; first downside target on failed rallies.
• $3,940–$3,930: bullish block liquidity — key structural demand; loss of this area risks a deeper de-leveraging leg.
🚧 Resistances:
• $4,200–$4,230: immediate supply from the weekly close; first “sell-the-rip” area.
• $4,250–$4,280: primary bearish liquidity / core short zone.
• $4,300–$4,350: exhaustion band; $4,350 = recent swing high / bear block.
• Stretch: $4,380 prior spike; only expected on an overshoot / stop run.
🧭 Bias Next Week:
Fade strength rather than chase upside.
Base idea: short rips into $4,220–$4,320, scale adds toward $4,350, looking for reversal back into $4,060 → $4,000–$3,960.
• A weekly close above $4,380 would invalidate the short-the-rip bias and open room toward the higher Street targets.
________________________________________
🔝 Key Resistance Zones Short-Side Focus
• $4,200–$4,230: first supply from the weekly close; good area for initial probe shorts.
• $4,250–$4,280: primary bearish liquidity / main take-profit area for trapped late longs.
• $4,300–$4,350: extension / exhaustion band; includes the $4,350 swing high and core “blow-off” liquidity pocket.
• $4,380: prior spike high / stretched stop-run; only expect in a squeeze.
________________________________________
🛡 Support Zones Downside Objectives / Where Shorts Start Covering
• $4,060–$4,020: first reaction band below; scale out partial profits here.
• $4,000–$3,960: key psychological shelf; second profit zone and likely area of responsive dip-buyers.
• $3,940–$3,930: bullish block liquidity; final target for aggressive shorts, and the spot where higher-timeframe bulls are expected to defend. A sustained break below would be a regime change.
________________________________________
⚖️ Base Case Scenario
• Rallies into $4,220–$4,320 encounter selling as late longs de-risk and fresh shorts engage.
• Price fails to sustain above $4,300–$4,350, leaving a wick / rejection on the higher timeframes.
• From there, rotation lower toward $4,060, then $4,000–$3,960 as the primary downside objective.
• Only if the $3,960–$3,930 block cracks cleanly do we start talking about a deeper flush into $3,880–$3,850 as a secondary scenario.
________________________________________
🚀 Breakout / Invalidation Trigger
• Bearish framework invalidation:
o A strong daily/weekly acceptance > $4,380 would suggest bears are trapped and open the door toward $4,450+, in line with the newly raised Street forecasts.
o In that case, shift from short-the-rip to neutral / buy shallow pullbacks until a new top structure forms.
________________________________________
💡 Market Drivers to Watch This Week
• Fed communication and front-end real yields – any hawkish surprise or delay in cuts could extend the correction; dovish surprise risks another squeeze.
• USD index swings around data / politics – sharp dollar bounces favour your short bias from resistance.
• Central-bank headlines (reserve diversification, sanction risk) – supportive in the background but less impactful intraday; use them as context, not trade triggers.
• Geopolitical flare-ups – can create squeezes into your sell zones; be ready for fast spikes into $4,300–$4,350 rather than waiting for slow grinds.
________________________________________
🔓 Bull / Bear Trigger Lines
• Structural bull line:
• Above $3,930–$4,000: long-term bull structure intact; even if you’re tactically shorting rips, treat deep flushes into this band with respect — this is where bigger players are likely accumulating.
• Bear expansion line:
• Below $3,930: opens scope for a faster liquidation wave toward $3,880–$3,850; would indicate that the 2025 blow-off is transitioning toward a broader consolidation or mean-reversion phase.
________________________________________
🧭 Strategy
Use overhead resistance as a place to sell strength, not initiate fresh longs. Expect limited upside and a reversal from liquidity above the market.
1️⃣ Primary Short Setup – Fade the Rips
• Entry zones:
o First scale: $4,220–$4,250
o Add / build: $4,250–$4,280 (primary bear-liquidity block)
o Final add / exhaustion: $4,300–$4,350 (only if tape shows blow-off / stop-run behaviour).
• Stops / invalidation:
o Tactical: hard stop above $4,380.
o More conservative traders can run a soft line at $4,350 and hard stop just beyond $4,380.
• Targets:
o TP1: $4,060–$4,020
o TP2: $4,000–$3,960
o Stretch TP3 (runner): $3,940–$3,930 bullish block.
________________________________________
🌍 Macro Tailwinds
• • Policy / Real Yields
Markets are leaning into lower US real rates and more cuts through 2026, with talk of “fiscal dominance” and persistent deficits. This keeps the medium-term backdrop supportive for gold even after the parabolic run.
• • FX / USD Dynamics
A softer, more volatile dollar driven by rate-cut expectations and concerns over US fiscal sustainability continues to underpin gold on dips, even if short-term dollar squeezes can trigger sharp pullbacks.
• • Flows: Central Banks Still the Backbone
Central banks remain heavy net buyers, with H1 and Q3 data showing robust additions and EM reserve managers diversifying away from sanction-risk USD assets. Recent commentary links record highs to this central-bank bid plus tight physical markets.
• • Flows: ETF & Investor Participation
After several years of outflows, ETF demand has turned back to net inflows, adding to central-bank buying and reinforcing the idea of a higher structural floor in the ~$3.9k area even after corrections.
• • Geopolitics & Safe-Haven Premium
Gold’s 2025 surge is still anchored in elevated geopolitical risk (Russia–NATO tensions, US–China frictions, tariff headlines), plus anxiety about frozen reserves and sanctions. This keeps the safety bid sticky even when positioning looks crowded.
• ________________________________________
#SYS/USDT looks very bullish#SYS
The price is moving in a descending channel on the 1-hour timeframe. It has reached the lower boundary and is heading towards breaking above it, with a retest of the upper boundary expected.
We have a downtrend on the RSI indicator, which has reached near the lower boundary, and an upward rebound is expected.
There is a key support zone in green at 0.02100. The price has bounced from this level multiple times and is expected to bounce again.
We have a trend towards consolidation above the 100-period moving average, as we are moving close to it, which supports the upward movement.
Entry price: 0.02140
First target: 0.2170
Second target: 0.02211
Third target: 0.02262
Don't forget a simple principle: money management.
Place your stop-loss below the support zone in green.
For any questions, please leave a comment.
Thank you.

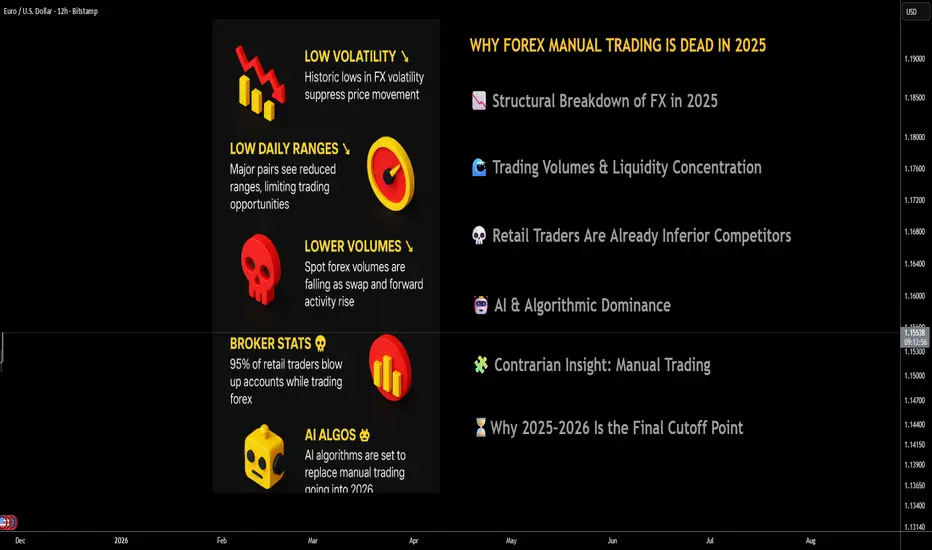
Why Manual Forex Trading Is Officially Dead 📘 Why Manual Forex Trading Is Officially Dead — And AI Will Bury It in 2026
________________________________________
1. 🚨 Executive Summary
Manual FX trading is not merely declining—it is entering its terminal phase. As of 2025, the confluence of record-low volatility, crushed daily ranges, shrinking spot volumes, and hyper-efficient AI execution frameworks has dismantled the edge discretionary traders once possessed.
Regulators report that 74–89% of retail CFD/FX traders lose money, with internal broker statistics showing even higher failure rates—often pushing the informal industry estimate of 90–95% account blow-up rates. The structural market environment now exacerbates those figures: less movement, tighter spreads, and faster AI-driven price formation leave no oxygen for manual decision-making.
The verdict is clear: manual FX trading is no longer a competitive activity—it's an anachronism.
________________________________________
2. 📉 Structural Breakdown of FX in 2025: A Market That No Longer Moves
The fundamental requirement for profitable manual FX trading—price movement—has been suppressed. According to multiple 2023–2024 analyses (Reuters, BIS), FX markets entered a multi-year period of historically subdued volatility, with the CVIX (Currency Volatility Index) sitting near multi-cycle lows.
Major pairs like EUR/USD and USD/JPY are posting 1/3 to 1/2 of their historical daily ranges, compressing intraday opportunity. What used to be 80–120 pip swings are now 30–50 pip oscillations dominated by micro-structure noise rather than directional moves.
In this environment, manual traders have insufficient statistical runway to generate returns, while AI systems can still monetize tiny dislocations at millisecond speed.
________________________________________
3. 🌊 Trading Volumes & Liquidity Concentration: The Game Has Moved On
The 2022 BIS Triennial Survey already documented a shift: spot FX volumes stagnated while swap and forward activity increased, driven by hedging and treasury optimization rather than speculative flows.
By 2025, institutional venues show continued softness in spot volumes, and even the leading eFX platforms reported lower activity during prolonged volatility droughts. This matters because:
• Lower volume = fewer sustained directional trends
• More volume concentrated among algos = fewer exploitable inefficiencies
• Liquidity providers internalize flow before it ever becomes visible to retail charts
Manual trading can’t survive structural liquidity centralization reinforced by machine execution.
________________________________________
4. 💀 Retail Traders Are Already Inferior Competitors and the Data Shows It
Manual traders are not just competing against the market—they are competing against:
• Prime brokers running internal AI risk engines
• HFT firms reading order books at microsecond resolution
• Banks using reinforcement-learning execution algos
ESMA’s regulatory disclosures show 74–89% of retail FX/CFD accounts lose money, but internal broker studies often cite 90–95% destruction rates, especially when volatility is muted.
The brutal truth: manual traders blow up because the game is no longer designed for human reaction speed or intuition.
________________________________________
5. 🤖 AI & Algorithmic Dominance: The 2026 Regime Shift
By 2026, FX will be AI-first, not human-first. Institutional adoption of AI execution is growing double digits annually (per GMI, GrandView), and retail brokers are already rolling out AI-assisted trade generation, AI signal clusters, and AI risk models.
AI advantages include:
• Predictive ability using LSTM/transformers trained on terabytes of tick data
• Zero-latency execution across fragmented liquidity pools
• Ability to profit in low-volatility regimes via microstructure edge
• Adaptive models that rewrite themselves every 24 hours
• No fatigue, no bias, no emotional degradation
In contrast, manual traders operate on slow cognition, subjective pattern recognition, and outdated chart heuristics. This is not a fair fight. Manual trading is no longer a skill—it's an obsolete hobby.
________________________________________
6. 🧩 Contrarian Insight: Manual Trading Isn't Just Dying—It’s Being Engineered Out
Here are non-obvious, high-conviction insights that institutional investors should consider:
(1) Market makers WANT low volatility
Low volatility increases internalization efficiency and reduces hedging costs. Human traders thrive on chaos; AI thrives on order. Who does the system favor?
(2) AI reduces liquidity available to humans
Liquidity is increasingly “dark” inside internal matching engines, meaning price discovery happens before retail traders ever see the candle.
(3) Manual trading can’t survive the “fractionalization” of edge
AI doesn’t need large moves—it monetizes micro-micro-inefficiencies in ways humans never could.
(4) Spread compression kills human R:R ratios
With 0.1–0.3 pip spreads on majors, AI can scalp micro-spreads—humans cannot.
(5) Behavioral inefficiencies have been minimized
Classic manual strategies—breakouts, fib levels, candlestick patterns—worked because humans created predictable behavioral cycles.
Now? AI models detect and arbitrage those behaviors instantly.
The most contrarian conclusion?
Manual trading didn’t die naturally—the market evolved to eliminate it.
________________________________________
7. ⏳Why 2025–2026 Is the Final Cutoff Point
Three forces collide in this window:
1. Volatility compression (structure-driven, not temporary)
2. AI adoption exceeding human adaptability
3. Retail traders facing the worst statistical environment in 15 years
This is the first time in FX history where:
• Human intuition has zero measurable edge
• AI dominance is irreversible
• Market conditions structurally reject manual trading
The past cycles always argued “vol will return.”
In 2025–2026, that is no longer a credible investment thesis.
________________________________________
8. 📈 Implications for Investors & Brokers
Investors should allocate to:
• AI-driven FX funds
• ML-enhanced macro strategies
• Data infrastructure feeding predictive FX models
Brokers should:
• Pivot to AI-based trading tools
• Monetize analytics subscriptions
• Shift away from promoting discretionary trading education
The firms that expect a retail manual trading revival will be structurally misaligned with market evolution.
________________________________________
________________________________________
🔥 Final Conclusion: Manual Traders Will Be Left Behind in 2026
The logic is now overwhelming:
low volatility + low ranges + reduced volumes + AI dominance = endgame for manual FX trading.
Human discretionary trading cannot survive in a marketplace designed for—and increasingly ruled by—data-driven, sub-millisecond, self-learning AI engines.
Manual traders in 2026 will not fight the bots.
They will simply be trading inside a system architected by the bots, reacting slowly to patterns that no longer exist.
The era is over.
The market has moved on.
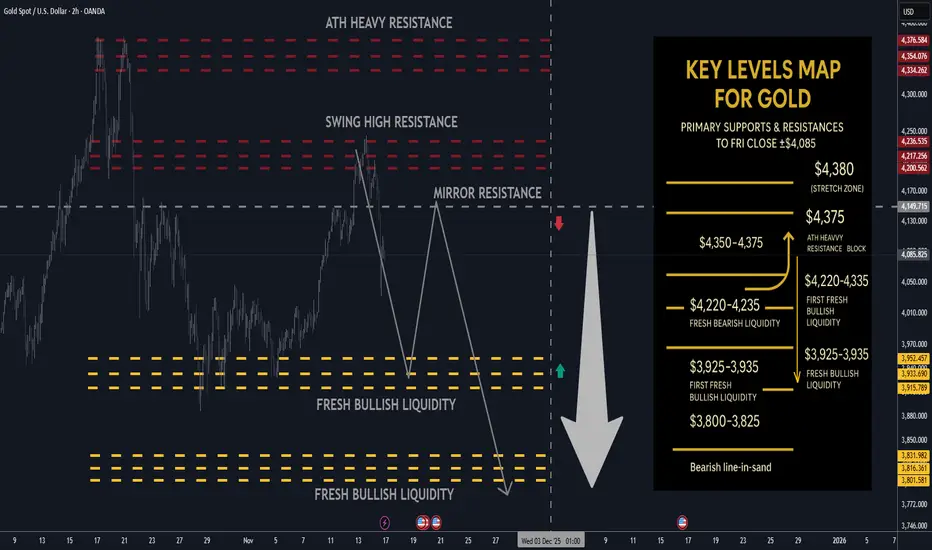
Gold next week: Key S/R Levels and Outlook for Traders🔥 GOLD WEEKLY SNAPSHOT — BY PROJECTSYNDICATE
🏆 High/Close: ~$4,244 → ~$4,085 — buyers punched through $4.20k but sellers defended the $4,220–4,250 band; weekly close is soft but still comfortably above $4k and mid-range.
📈 Trend: Bullish but in corrective / two-way mode ; treating current tape as range-trade while below the $4,350–4,375 ATH supply block.
🛡 Supports: $3,925–3,935 fresh bullish liquidity → $3,800–3,825 deeper demand pocket— key shelves where dip-buying is expected.
🚧 Resistances: $4,220–4,230 short-term fade zone → $4,350–4,375 (ATH heavy resistance block).
🧭 Bias next week: Preference to fade strength into $4,220–4,230, targeting a rotation back into $3,925–3,935. Alternative is to buy dips into $3,925–3,935 and ride the range back toward $4,220–4,230. Invalidation on sustained acceptance above $4,350–4,375; loss of $3,800–3,825 risks deeper mean reversion.
________________________________________
________________________________________
🔝 Key Resistance Zones
• $4,220–4,230 — immediate weekly ceiling; aligns with your noted resistance block, attractive area to initiate shorts on first tests.
• $4,350–4,375 — prior ATH / “heavy resistance block”; any spike here is a fade candidate unless price accepts above it on strong volume.
🛡 Support Zones
• $3,925–3,935 — fresh bullish liquidity; preferred first take-profit for shorts and primary dip-buy zone.
• $3,800–3,825 — deeper fresh liquidity; failure here would signal a more meaningful correction, not just a pullback in an uptrend.
________________________________________
⚖️ Base Case Scenario
Range/consolidation between roughly $3,800–$4,230:
• First pushes into $4,220–4,230 are sellable for rotations toward $3,925–3,935.
• As long as weekly closes keep rejecting the ATH block $4,350–4,375, bias stays “sell strength, buy clean liquidity dips.”
🚀 Breakout / Breakdown Triggers
• Bull trigger: Sustained acceptance above $4,350–4,375 multiple sessions holding above and using that band as support would shift tone back to full-on trend and reopen the path toward and beyond prior extremes (~$4,400+).
• Bear trigger: A decisive daily close below $3,800 turns the current “healthy pullback” into a deeper correction, opening room toward prior lower shelves sub-$3,750 and likely volatility expansion.
________________________________________
💡 Market Drivers to Watch
• Fed & real yields: Odds of a December cut have ramped up again; any hawkish pushback or hotter data could cap rallies near resistance.
• U.S. fiscal/political risk: Shutdown and fiscal brinkmanship are still in the background; resolution headlines could briefly pressure gold, while renewed instability supports the bid.
• Flows & positioning: ETF and central-bank demand remain supportive, but after a 60% YTD run, fast money is quick to take profits into strength.
• Cross-asset behavior: Watch that equity–gold correlation; if risk-off hits and gold still sells with stocks, dips could run further before strategic buyers step in.
________________________________________
🔓 Bull / Bear Trigger Lines
• Bullish above: $4,350–$4,375 (sustained acceptance; ATH block reclaimed as support).
• Bearish below: $3,800 (opens risk of deeper liquidation below the current liquidity shelves).
________________________________________
🧭 Strategy for this week
Primary plan – short from resistance (your core idea):
• Entry zone: Scale into shorts around $4,220–4,230 front edge of the resistance block.
• TP #1: $3,925–3,935 fresh bullish liquidity; consider closing most size here.
• Runner / extension: If momentum extends lower, watch $3,800–3,825 for final profit-taking; below here the profile shifts into deeper correction mode.
• Risk: Hard invalidation if price accepts above $4,350–4,375 daily closes holding above and successful retests.
Alternative plan – buy the dip into liquidity:
• Entry zone: Stagger bids around $3,925–3,935 and, for more aggressive positioning, into $3,800–3,825.
• Exit zone: First target back into $4,220–4,230; consider de-risking heavily as you approach that resistance band.
• Risk: Cut or reduce if price fails to hold above $3,800 on a daily closing basis or if selling accelerates on high volume through that shelf.
#SYS/USDT looks very bullish#SYS
The price is moving within an ascending channel on the 1-hour frame, adhering well to it, and is poised to break it strongly upwards and retest it.
We have support from the lower boundary of the ascending channel, at 0.04060.
We have a downtrend on the RSI indicator that is about to break and retest, supporting the upward move.
There is a key support area (in green) at 0.03980, which represents a strong basis for the upward move.
Don't forget one simple thing: ease and capital.
When you reach the first target, save some money and then change your stop-loss order to an entry order.
For inquiries, please leave a comment.
We have a trend of stability above the Moving Average 100.
Entry price: 0.04221
First target: 0.04356
Second target: 0.04483
Third target: 0.04635
Don't forget one simple thing: ease and capital.
When you reach the first target, save some money and then change your stop-loss order to an entry order.
For inquiries, please leave a comment.
Thank you.

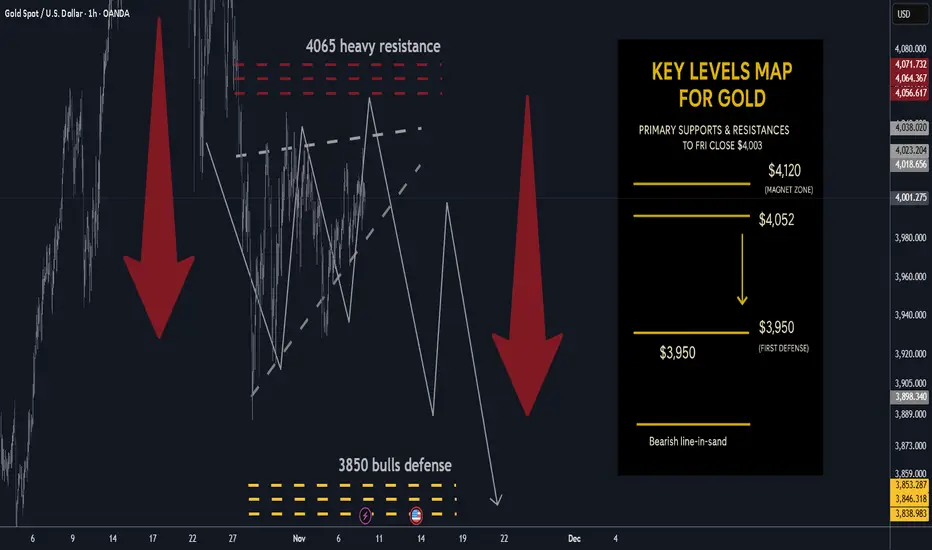
Gold next week: Key S/R Levels and Outlook for Traders🔥 GOLD WEEKLY SNAPSHOT — BY PROJECTSYNDICATE
🏆 High/Close: $4,024.9 → ~$4,003 — sellers faded upticks; weekly close soft but back above the round $4k.
📈 Trend: Neutral / mild correction inside range; not expecting immediate new highs while <$4,080–4,120.
🛡 Supports: $3,950 → $3,900 → $3,850 — pivotal shelves for bears’ take-profit and control.
🚧 Resistances: $4,040 / $4,080 / $4,120 — repeated supply zones; first taps favored for fades.
🧭 Bias next week: Short sells into $4,040–$4,120; TP $3,950 then $3,850 (your plan). Invalidation on sustained reclaim > $4,120–$4,175; loss of $3,850 risks extension lower.
🌍 Macro tailwinds/headwinds (this week’s tape):
• Narrative tone: Kitco flagged “razor’s edge” near $4,000 with mixed views (bubble vs. consolidation), while another Kitco piece framed the stall as a “healthy pause.”
• WSJ flow: Headlines oscillated between “slips below $4,000” and modest up-days; net read is consolidation around $4k with quick two-way trade.
• Levels: Spot finished the week essentially on $4k; intrawEEK high couldn’t clear early-week $4.02–4.03k cap.
🎯 Street view: After last month’s print above $4,000 (first ever), WSJ tone shifted to digestion; rallies still attract supply until a decisive reclaim of upper resistance.
________________________________________
🔝 Key Resistance Zones
• $4,040 — immediate ceiling; weekly high proximity, likely to cap first tests.
• $4,080 — secondary supply ledge from recent failures.
• $4,120 — upper band; acceptance above here starts to neutralize the correction.
🛡 Support Zones
• $3,950 — first defense / first TP.
• $3,900 — round-number shelf; loss invites momentum probes.
• $3,850 — critical structural base and second TP; break risks downside acceleration.
________________________________________
⚖️ Base Case Scenario
Compression within a rising-wedge-like structure, ranging $3,850–$4,120. First pushes into $4,040–$4,120 are sellable for rotations toward $3,950 → $3,850 while the market respects weekly lower highs.
🚀 Breakout / Breakdown Triggers
• Bull trigger: Sustained acceptance > ~$4,120–$4,175 turns the tone constructive again and reopens $4,200+.
• Bear trigger: Daily close < $3,900 increases odds of full $3,850 test; failure of $3,850 risks momentum spill.
💡 Market Drivers to watch
• Fed path / real yields (rate-cut odds vs. sticky inflation narrative in WSJ copy).
• USD swings (no broad USD weakness → upside attempts stall).
• ETF/CB flows (Kitco interviews highlight split sentiment; dip-buyers active, momentum players cautious).
• Event risk (headline sensitivity remains high; quick squeezes into resistance possible).
🔓 Bull / Bear Trigger Lines
• Bullish above: $4,120–$4,175 (sustained).
• Bearish below: $3,900 → $3,850 (risk expands under $3,850).
🧭 Strategy for this week
Short from resistance: Scale in around $4,040 → $4,080 → $4,120;
TP #1: $3,950; TP #2: $3,850;
Risk: Hard stop on a daily close above $4,120 (or intraday breach that holds on retest). Consider trimming if a news-driven squeeze tags $4,175 and fails.
The Tension Between Trust and ControlNOTE – This is a post on mindset and emotion . It is not a trade idea or system designed to make you money. My aim is to help you protect your capital, energy, and composure, so you can trade your own system with clarity and confidence. This is a shorter post than normal with a challenge embedded. If you choose to follow, let me know how you get on.
Imagine the scenario
BTCUSD - you’re in.
The trade has moved your way and you KNOW you ought to trail
Afterall...
You’ve built the system and you have rules to follow
You’ve tested them.
They have an edge. You know you ought to trust the edge
And yet… in the middle of a live trade, your hand drifts toward the mouse.
You want to tweak the stop.
Take profit early.
Do something .
You tell yourself it’s prudence.
But what’s really happening is a tug-of-war between trust and control .
Your system says: Stay put. Let it play out.
Your instinct says: Take it and run.
The more you interfere, the more you teach your brain one thing:
“I can’t trust myself.”
That interference doesn’t protect you.
It keeps you trapped in a loop of doubt and micromanagement
In reality, it erodes self-trust, trade by trade.
So here’s your challenge:
Sit through 30 trades, a statistically significant data set. Follow your rules with a position size that is big enough so you pay attention but not so big to cause you to interfere. Once you’ve entered - follow your rules to a T. No adjusting. No tinkering. By all means, makes notes in a journal.
When the urge to step in comes up for you, pause and ask:
💭 What emotion is this?
Notice it.
Name it.
Then let the system do its job, while you practice doing yours: staying disciplined.

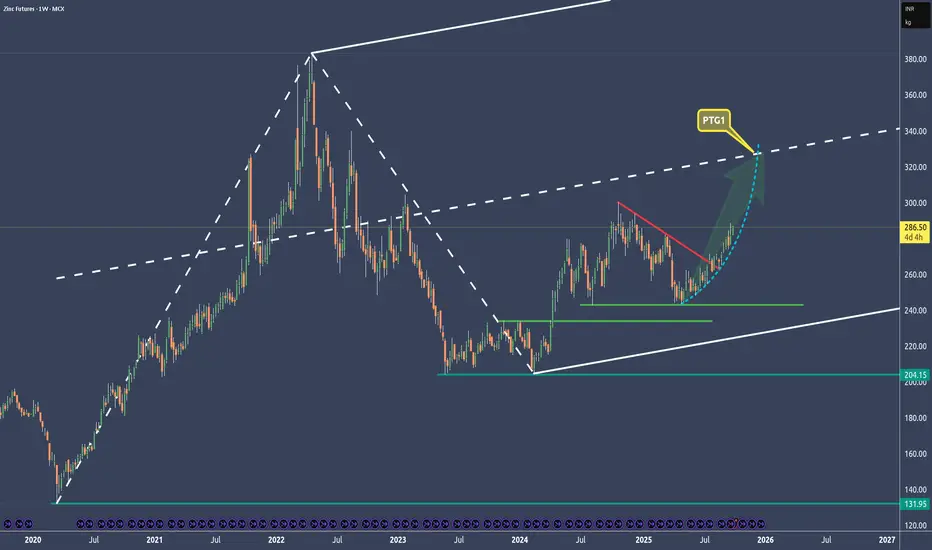
Zinc - Exponential Move To Profit Along With Copper🔱 I posted about copper and zinc on Sep 17. 🔱
Both are closely correlated, and now zinc is moving exponentially.
The target is at the centerline of course with around an 80% probability.
👉 If you think that these forks are doing a good job, then throw me booster please and check out my links. §8-)
September 2025 Market Summary Gold and ForexProjectSyndicate Market Summary September 2025
📊 MTD performance
🟡 GOLD (XAUUSD): 3,759.65 | +286.65 (+8.31%)
💶 EURUSD: 1.1702 | +16 pips (+0.14%)
💷 GBPUSD: 1.3392 | −112 pips (−0.83%)
💴 USDJPY: 149.19 | +211 pips (+1.43%)
📈 SPX: 6,637.97 | +236.46 (+3.69%)
📈 NDX: 24,503.57 | +1,483.10 (+6.44%)
________________________________________
🗞 September overview
• 🇺🇸 The Fed cut 25 bps on September 17 and flagged the possibility of further cuts this year, reinforcing a softer USD bias and boosting gold demand.
• 🇪🇺 The ECB held rates on September 11, though left the door open for easing later.
• 🇬🇧 The Bank of England held rates and slowed quantitative tightening on September 18.
• 🇯🇵 The BoJ maintained a “hawkish hold” on September 19, started unwinding ETF/REIT holdings, and signaled possible rate risks into October — supporting JPY on abrupt USD strength.
• 🟡 Gold made a fresh intramonth high near ~$3,790, before settling slightly lower.
• Stronger U.S. economic data mid-month (jobs, yields) briefly undercut rate cut expectations, leading to a temporary gold dip, but the momentum has largely resumed.
• Tariff announcements and trade-policy uncertainty added safe-haven tailwinds to gold.
________________________________________
🟡 Gold Market Overview – September 2025
✨ Key Highlights & Drivers
• All-time high revisit: Spot gold pushed toward $3,790 mid-month on renewed enthusiasm for Fed easing and weaker USD.
• Volatility around economic surprises: Upside surprises in US data (jobs, GDP) triggered brief USD strength that pressured gold, but the downside was limited.
• Fed narrative remains gold’s ally: The dovish pivot (25 bps cut + future cuts flagged) continues to lend structural support to gold.
• ETF & institutional flows: Inflows into gold ETFs have reaffirmed investor appetite for safe-haven exposure.
• Risk / geopolitical spillovers: Oil price jitters, trade frictions, and general macro uncertainty underpin demand for non-correlated assets.
• Technical posture: After surging, gold has found interim support in the region of ~$3,650–3,700, with resistance clustering near $3,800. A sustained break above the latter could open targets toward $3,900+.
📊 Performance Recap
Gold has posted one of its strongest monthly performances of 2025, currently up ~8.7 % MTD.
Stronger parts of the rally were clustered around rate cut confirmation and safe-haven demand spikes.
🔍 Risks & Watch-Outs
• A surprise resurgence in U.S. economic strength (inflation, jobs) could push rate markets back toward dovish skepticism, pressuring gold.
• A re-strengthening USD (driven by rates or yield spreads) will be headwind for dollar‐priced gold.
• Central bank actions: further buying or selling by official sectors could tilt balance.
• Technical overextension: short-term pullbacks or consolidations are plausible given the sharp run-up.
________________________________________
💱 FX Landscape – September 2025
• EURUSD: The pair remains stuck under ~1.1700, recovering modestly from USD spikes but lacking strong directional conviction.
• GBPUSD: Under pressure through the month, sliding toward 1.3350 as sterling weakens on yield differentials and global risk dynamics.
• USDJPY: Strength in yields and risk dynamics have nudged USDJPY higher, though BoJ vigilance and intervention risk temper runaway moves.
Broader theme: while risk sentiment supports carry / USD strength, central bank policy cycles and macro surprises are injecting volatility and preventing runaway trends.
________________________________________
📝 Summary & Key Takeaways
✅ What Worked in September
• Gold leveraged dovish central bank messaging and USD softness to consistently outperform across risk regimes.
• Positioning toward safe havens paid off in a month marked by macro surprises and geopolitical noise.
• FX markets remained choppy, with no clear trending momentum — caution was rewarded.
⚠️ What to Watch Going Forward
• U.S. data flow — especially inflation, jobs, and PCE — could reshape Fed expectations and thus gold/FX direction.
• USD momentum — a reversal in dollar strength could compress gold gains; sustained USD weakness could accelerate the bull run.
• Intervention / central banks — any surprises from BoJ, PBoC, or central banks stepping into gold or FX markets could upend positioning.
• Technical zones — if gold can break and hold above $3,800, it may open new leg toward $3,900+; failure may invite a pullback toward $3,650–3,700.

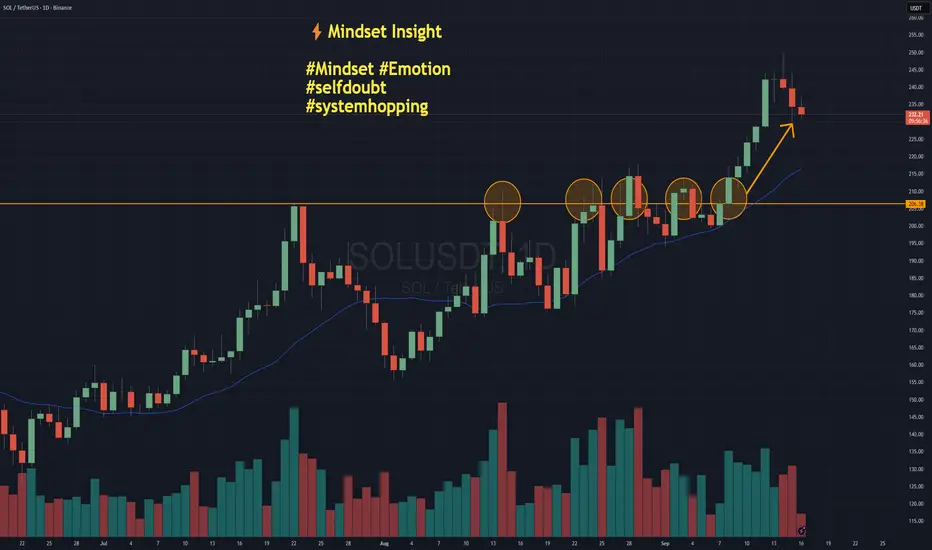
System Hopping - The Hidden Cost of Self-DoubtNOTE – This is a post on Mindset and emotion. It is NOT a Trade idea or strategy designed to make you money. If anything, I’m taking the time here to post as an effort to help you preserve your capital, energy and will so that you are able to execute your own trading system as best you can from a place of calm, patience and confidence.
Here’s a scenario:
You take a loss.
Then another.
Suddenly, the system you trusted yesterday feels broken today.
On this chart of Solana, imagine you were trading a breakout system. You may have had four false breaks that didn’t really follow through before the market finally broke higher. When do you give up on the idea or the system altogether?
How self-doubt shows up:
You start thinking: “Maybe another system would have worked better…”
You switch, tweak, reinvent mid-cycle.
You lose patience with the method you worked so hard to design.
You are in danger of system hopping.
Emotional side:
Self-doubt often disguises itself as “rational analysis,” but underneath it’s uncertainty, frustration, even a tightening in the chest. You hesitate to pull the trigger, second-guess your plan, or overcorrect with a brand-new approach.
It’s rarely your system that’s broken.
It’s the lack of trust in yourself to see it through.
Shift your mindset
Every system has drawdowns. If you abandon yours too soon, you never let it prove itself. So the task really is to find a way to collect the data without blowing out / over extending yourself.
Practical tips … the How:
Write down your system rules and keep them visible, so you trade what’s planned, not what you feel.
Track results over a proper sample size (50–100 trades) before judging performance.
Make sure you are position sizing sensibly. This is an art in and of itself. The key being - do not risk what you can not afford on any one trade / series of trades. Paper trade if you need to to start with just to collect the data on the system.
Journal emotions separately from trade outcomes — so you see when doubt is about you, not the system.
Set a “no system changes” rule during drawdowns. Only review at scheduled intervals.
Closing thought:
Your edge doesn’t come from finding the perfect system.
It comes from trusting a good one long enough to let it work.
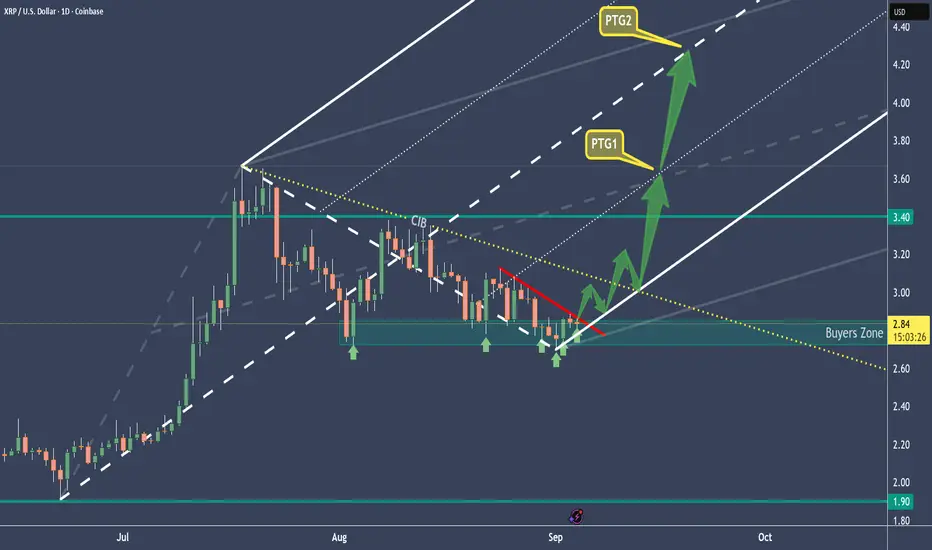
XRPUSD - How Ripple is preparing for a potential big moveThe white Fork marks the most probable path of price.
There is currently no indication, that Ripple really want's to take off to the upside, but: We have some potential points that could give us a clue:
1. Price seems to stabilize at the L-MLH.
2. There's a clear pressing going on (red line), which mostly will vanish when price pops above.
3. The L-MLH and the yellow CIB are pullback levels where price pauses
If we trade below the Support Zone, the idea is thrown in the bin.
Let's hold the water and see what happens .
Reddit - Impressive But I Stalk A ShortReddit is currently delivering excellent figures – revenue and user base are booming, profits have returned, and AI partnerships are creating strong conditions for growth. However, the current share price reflects this upward momentum with (over-)enthusiasm. Exciting for speculative investors, but those focused on value should wait for a pullback.
And that’s exactly the hook for why I’m lying in wait for a short trade.
Let’s take a look at the technical side – the chart analysis:
We can see that several CIB lines (Change in Behavior) have been broken.
And bam! – the market hits our 80%-probability profit target.
We know what that means: the market is in equilibrium.
And when the market acts like a couch potato, we also know it can’t stay that way for long.
So, what are the options?
Up or down.
Up?
Could happen – human greed is boundless and goes further than the moon, as we’re currently seeing.
Down?
If we take the fundamental analysis into account, and our common sense also tells us that Reddit is overheated, then this short idea is definitely worth investigating.
I see two possibilities:
1. Speculative short:
Here I would go with options, since shorts are always trickier than longs. You simply have more time to be right.
2. Wait for a trigger signal:
If we see the market leave the couch (the CL), we look at the bars and find a good entry with a sensible risk/reward, targeting:
a) the 1/4 line
b) the L-MLH
Happy hunting!

#SYS/USDT#SYS
The price is moving within a descending channel on the 1-hour frame and is expected to break and continue upward.
We have a trend to stabilize above the 100 moving average once again.
We have a downtrend on the RSI indicator, which supports the upward move by breaking it upward.
We have a support area at the lower limit of the channel at 0.0487, acting as strong support from which the price can rebound.
Entry price: 0.0500
First target: 0.0519
Second target: 0.0544
Third target: 0.0570

#SYS/USDT#SYS
The price is moving in a descending channel on the 1-hour frame and is adhering to it well and is heading to break it strongly upwards and retest it
We have a bounce from the lower limit of the descending channel, this support is at a price of 0.0474
We have a downtrend on the RSI indicator that is about to break and retest, which supports the rise
We have a trend to stabilize above the moving average 100
Entry price 0.0540
First target 0.0588
Second target 0.0624
Third target 0.0666

EUR/GBP 30M Order Block Mitigation -Waiting for sweep then EntryDescription:
EUR/GBP is following my 30M bullish bias after mitigating a key order block. Initially, I dropped to the 5M timeframe for entry and spotted a clean CHoCH confirmation, but price moved too fast before I could execute.
Instead of chasing, I followed price action and noticed it mitigated a few inducements (IDM) on the way up. Now, I’m patiently waiting for a fresh liquidity sweep to confirm re-entry for the next 30M continuation to the highs.
Key Observations:
✅ 30M Mitigated Order Block – Confirms bullish bias.
✅ 5M CHoCH Formed – Entry was possible but moved too fast.
✅ Inducements Mitigated – Following price to see a fresh sweep for better entry.
📌 Next Step: Watching for a clean liquidity grab before confirming my entry.
Let me know what you think—are you seeing the same liquidity moves?
Bless Trading!

#SYS/USDT#SYS
The price is moving in a descending channel on the 1-hour frame and is adhering to it well and is heading to break it strongly upwards
We have a bounce from the lower limit of the descending channel, this support is at a price of 0.0583
We have a downtrend on the RSI indicator that is about to be broken, which supports the rise
We have a trend to stabilize above the moving average 100
Entry price 0.0646
First target 0.0732
Second target 0.0800
Third target 0.0905

NZDJPY BUTTERFLYHarmonic Pattern Trading Strategy:
1. Combine patterns with 2-3 confirmations (e.g., MA, BB, RSI, Stoch) for increased accuracy.
2. Implement proper risk management.
3. Limit exposure to 3% of capital per trade.
4. Exercise caution: Not every Harmonic Pattern presents a good trading opportunity.
5. Conduct thorough diligence and analysis before trading.
Disciplined approach = Enhanced edge.

WIF SK Top Down AnalysisAnalysed on SK Australia's call 23/12/2024
- Brady said "no financial advise", but no not invest in WIF XD

Go LongIm long on XAU, target is last Sunday opening. SL at the 110. May come back to Thurs opening and there is reason to drop farther. My pattern is there I'm long. 'The move is more valuable than the money." The Profitable Loser. See him on YT also Dave teaches fx. No chart is safe!

Gold still trying to go higher so far .Gold still trying to go higher so far .
targeting 2720-22 zone
- stop looking for longs by breaking 2621.194

"Marseilia Egyptian Gulf" Stock (MAAL) Analysis Based on SKThis analysis is based on the SK Strategy, focusing on corrective price patterns like ABC and Fibonacci retracement levels to identify support and resistance. Currently, the stock is trading at 3.09 EGP, with a correction pattern indicating potential upward movement towards 3.60-3.70 EGP. The 2.99 EGP (78.6% Fibonacci level) acts as support, while breaking below 2.98 EGP might signal further declines.
