TTWO - Major CorrectionLet’s continue breaking down the corrective structure in Take-Two Interactive Software.
The peak was set back in January 2021, and the move since then is part of a broader correction.
Wave A finished in November 2022, and Wave B followed.
By October 2025, Wave B ended, a new high was made within the correction, and Wave C has kicked off.
This is an expanded flat correction.
Wave C is a five -wave impulse, which we are now tracking.
Here’s a look at the previous idea:
The start of the impulsive moves was marked correctly.
Current structure:
The move from October 2025 is the main impulsive wave
The move from late December 2025 is Wave 3 within that impulse
Right now, within wave 3 , a local pullback of 8-12% from the current level is possible:
After that, the impulse should continue:
Next comes a subwave correction:
Finally, the main impulse should complete:
The plan assumes 50-60% retracements, but in reality pullbacks can be smaller, around 38% .
Keep in mind: down moves are usually faster than up moves.
Key level to watch: 171
If it holds, the stock could still push higher and make new significant highs.
Conclusion:
Wave C is moving down
We’re navigating between the described corrections and targets.
Key targets:
128
105
Potential move from the current level: 33-46%
---
Subscribe and leave a comment.
You’ll get new ideas faster than anyone else.
---
Taketwo

TTWO - Two CorrectionsWe are analyzing the move starting from August 2024.
The five-wave upward move is complete, and we are now in the corrective phase, which we consider a regular flat .
Wave A is complete. Wave B is also considered complete; a return to the 264 level is possible but unlikely. Wave C is now being drawn.
Key targets:
234 - local correction level
224 / 219 - potential reversal zones
This correction is part of wave 5 .
A second, deeper /b] correction of the entire move is expected later, but that will be covered in future ideas.
---
Please subscribe and leave a comment!
You’ll get new information faster than anyone else.
---

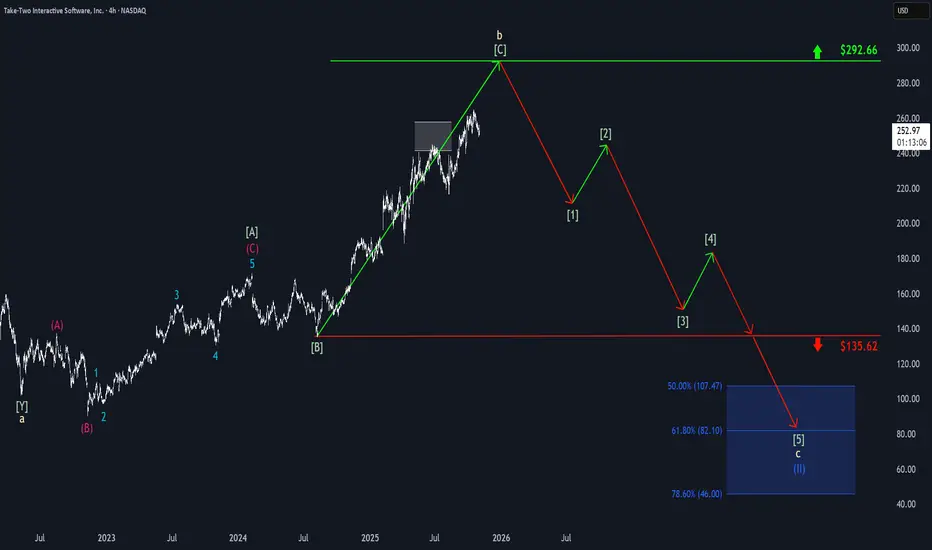
Take-Two: Momentum Fades, but Recovery ExpectedTake-Two’s upward momentum has faded recently, leading to a noticeable pullback. However, we expect the stock to rebound soon and resume the corrective advance of beige wave b, moving closer to resistance at $292.66. At that point, the stock is likely to reverse course and begin a green downward impulse, which should ultimately finalize the correction of blue wave (II). We have identified a blue Target Zone between $107.47 and $46 for this significant bottom.
Take-Two: Keep at It!Take-Two recently hit a new all-time high but quickly pulled back. While the stock tried to recover, it encountered renewed selling pressure. With that all-time high, it came close to the lower edge of our beige Target Zone between $241.59 and $257.87. In our primary scenario, we still expect this zone to be reached as part of the beige wave b. However, there’s a 33% chance the stock will fail to make it there and instead turn lower early—forming a premature corrective low for the blue wave alt.(II) within the blue Target Zone between $107.47 and $46.

Take-Two: Continued Sideways MovementSince the beginning of February, Take-Two Interactive has been moving mostly sideways with a slight downward bias. Currently, the ongoing beige wave b should continue upward, driving the stock into the beige Target Zone between $241.59 and $257.87. There, this corrective rally should conclude, setting the stage for a sharp downward move. However, if the stock breaks below the support at $135.62, this will signal a premature correction low of the blue wave alt.(II) in the blue Target Zone between $107.47 and $46. We assign this scenario a 33% probability.

Take-Two: Target Zone in Focus!Although a slight downward tendency has been observed in TTWO’s sideways phase, the stock has recently shown new motivation on the upside. While short-term pullbacks cannot be ruled out, we still expect the beige b-wave to extend into our beige Target Zone (coordinates: $241.59 – $257.87), where we anticipate a significant trend reversal. This outlook remains intact as long as the support at $135.62 holds fast. An early sell-off below this level would trigger our alternative scenario of a premature correction low within our blue Target Zone between $107.47 and $46 (33% probability).

Take Two to Move Higher? Take-Two Interactive - Short Term - We look to Buy a break of 174.44 (stop at 168.88)
Daily signals are bullish. A bullish reverse Head and Shoulders has formed. Buying continued from the 61.8% pullback level of 164.18. The trend of higher lows is located at 163.50. The bias is still for higher levels and we look for any dips to be limited. A move through 174.00 will confirm the bullish momentum.
Our profit targets will be 187.22 and 193.96
Resistance: 178.13 / 195.00 / 200.00
Support: 171.00 / 164.00 / 150.00
Disclaimer – Saxo Bank Group. Please be reminded – you alone are responsible for your trading – both gains and losses. There is a very high degree of risk involved in trading. The technical analysis, like any and all indicators, strategies, columns, articles and other features accessible on/though this site (including those from Signal Centre) are for informational purposes only and should not be construed as investment advice by you. Such technical analysis are believed to be obtained from sources believed to be reliable, but not warrant their respective completeness or accuracy, or warrant any results from the use of the information. Your use of the technical analysis, as would also your use of any and all mentioned indicators, strategies, columns, articles and all other features, is entirely at your own risk and it is your sole responsibility to evaluate the accuracy, completeness and usefulness (including suitability) of the information. You should assess the risk of any trade with your financial adviser and make your own independent decision(s) regarding any tradable products which may be the subject matter of the technical analysis or any of the said indicators, strategies, columns, articles and all other features.
Please also be reminded that if despite the above, any of the said technical analysis (or any of the said indicators, strategies, columns, articles and other features accessible on/through this site) is found to be advisory or a recommendation; and not merely informational in nature, the same is in any event provided with the intention of being for general circulation and availability only. As such it is not intended to and does not form part of any offer or recommendation directed at you specifically, or have any regard to the investment objectives, financial situation or needs of yourself or any other specific person. Before committing to a trade or investment therefore, please seek advice from a financial or other professional adviser regarding the suitability of the product for you and (where available) read the relevant product offer/description documents, including the risk disclosures. If you do not wish to seek such financial advice, please still exercise your mind and consider carefully whether the product is suitable for you because you alone remain responsible for your trading – both gains and losses.

Long term investments in Take-TwoWith the help of the white trend lines we see how the price had a break out of a triangle formation down to the range of 160$.
I would definitely wait for the shares go further down to levels of 150.69 (what a nice number).
IF we get a quick move upside with a strong candle there are better chances of an turnaround.
Another interesting support I would watch out is the 136$ where we had 2x a strong resistance in the past.
