TAOUSDT 1,984% profits potential 8X leverage —LONG tradeHere comes Bittensor and this is a perfect setup with great timing and huge growth potential. Notice the higher low and rounded bottom. Notice the "easy target." Of course, the very easy target is $390 which opens 656% profits potential with 8X, very, very easy.
The "easy target" is one that cannot be missed since it was the last high where a rejection occurred. On a reversal, this level needs to be tested again, around $540.
This second level opens 1,216% profits potential with 5X. So here you can see how TAOUSDT offers a very strong trade opportunity. High potential for reward with relatively low risk.
The main low after the correction happened 24-December and the higher low 25-January, one month after. Within this month, we have a bullish move followed by a bearish move, miniature version. See how the market fluctuates between bear and bull.
Then we will have a bullish move followed by a bearish move, again, but this time big size. It starts small and then it becomes big. Many people will be expecting a small move because the previous moves were small and will end up selling too early.
A long period of bearish action followed by small moves and people become conditioned to seeing only small growth. But the market surprises, nothing ever stays the same. The small moves were only the preparation, the build-up process for a big move to show up.
Notice how trading volume is very low on the drop. Volume is higher when buyers show up.
Bittensor is about to grow strong. Full trade-numbers below:
_____
LONG TAOUSDT
Leverage: 8X
Potential: 1984%
Allocation: 5%
Entry zone: $202 - $218
Targets:
1) $285
2) $333
3) $373
4) $412
5) $468
6) $539
7) $618
8) $666
9) $745
Stop: Close weekly below $200
_____
Thank you for reading. I hope you enjoy the content.
Trade-numbers fully updated. Huge growth potential. Fast growth expected.
Namaste.
TAOUSDT

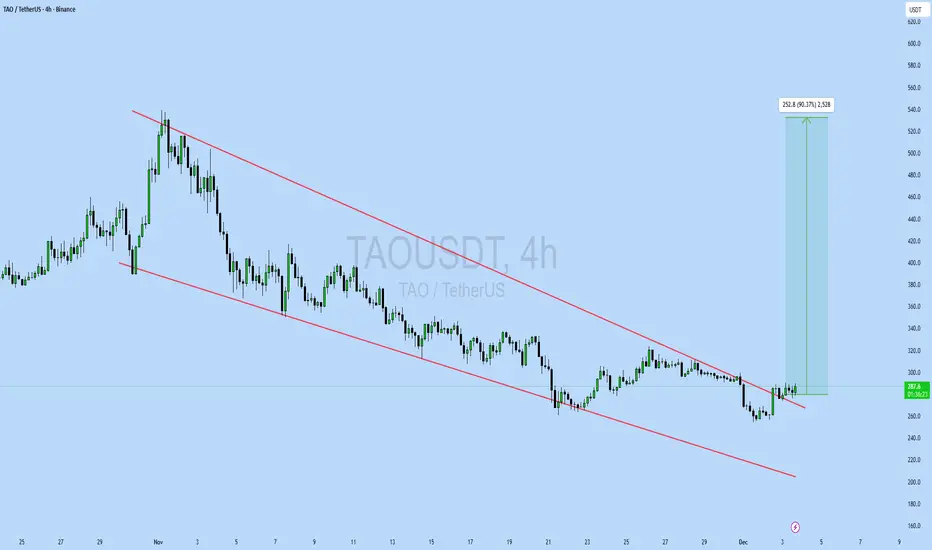
TAOUSDT 1,065% profits potential 5X leverage —LONG tradeHere comes Bittensor and this is a perfect setup with great timing and huge growth potential. Notice the higher low and rounded bottom. Notice the "easy target." Of course, the very easy target is $390 which opens 320% profits potential with 5X, very, very easy.
The "easy target" is one that cannot be missed since it was the last high where a rejection occurred. On a reversal, this level needs to be tested again, around $540.
This second level opens 635% profits potential with 5X. So here you can see how TAOUSDT offers a very strong trade opportunity. High potential for reward with relatively low risk.
The main low after the correction happened 24-December and the higher low 25-January, one month after. Within this month, we have a bullish move followed by a bearish move, miniature version. See how the market fluctuates between bear and bull.
Then we will have a bullish move followed by a bearish move, again, but this time big size. It starts small and then it becomes big. Many people will be expecting a small move because the previous moves were small and will end up selling too early.
A long period of bearish action followed by small moves and people become conditioned to seeing only small growth. But the market surprises, nothing ever stays the same. The small moves were only the preparation, the build-up process for a big move to show up.
Notice how trading volume is very low on the drop. Volume is higher when buyers show up.
Bittensor is about to grow strong. Full trade-numbers below:
_____
LONG TAOUSDT
Leverage: 5X
Potential: 1065%
Allocation: 5%
Entry zone: $215 - $245
Targets:
1) $285
2) $333
3) $373
4) $412
5) $468
6) $539
7) $618
8) $666
9) $745
Stop: Close weekly below $214
_____
Thank you for reading. I hope you enjoy the content.
Namaste.

TAO is near the bottom of a massive rangeTAO is sitting at a critical decision zone on the daily.
Price bounced cleanly from demand and reclaimed short term structure, but the move is now stalling right below a key resistance area from the prior breakdown.
This is a make or break spot.
Acceptance above this range would signal a structure shift and open continuation toward higher value.
Rejection keeps TAO range bound and increases the likelihood of a rotation back into the mid to lower demand zone.
Volume has faded on the push, so buyers need to show up here to flip this level.
Until then, expect chop and reactions around resistance.
Let price confirm.

TAO Finds Its Balance After a Long Pullback - What Comes Next?* TAO has managed to reclaim an important level after a long pullback, which is starting to shift how the chart looks in the short term.
* The price is now moving into an area that could decide whether this bounce has real legs or stalls out.
* Momentum is improving, but the chart is still asking for confirmation before calling this a full trend reversal.
When you zoom out and look at TAO, it’s clear the selling pressure has eased, even if the market isn’t ready to call this a full recovery yet.
After a long pullback, the TAO price has finally found some footing, and that alone changes the tone. Price isn’t racing higher, but the constant push to the downside has slowed.
The move above $290 was an important moment. That level had capped the TAO price for months, knocking back every rally. Clearing it didn’t suddenly flip the chart bullish, but it did show that sellers aren’t in full control anymore. TAO has shifted out of defense mode and is now testing whether it can build something higher.
Lately, the price action has been more of a grind than a surge. Momentum has cooled, volume has thinned out, and attention has drifted. That doesn’t automatically signal weakness. After a solid move, markets often pause like this while expectations reset.
The market cap data fits that picture. Instead of slipping lower during the bounce, TAO’s market cap has been holding steady and inching up. That suggests capital is sticking around and traders are more willing to sit through pullbacks rather than rush for the exit.
From here, structure matters more than sentiment. The $355–$360 zone is still the key hurdle. Until TAO can work through that area, the move remains a recovery, not a confirmed trend change. For now, the TAO price is holding its ground, and that’s a meaningful signal on its own.

Bittsensor TAO price analysis#TAO is still trading in a tight consolidation zone, and honestly — this structure looks very intentional.
There’s a strong feeling that someone is quietly building a large position here.
The price behavior reminds a lot of early-stage CRYPTOCAP:ETH , when it spent months moving sideways before the real expansion phase.
🔹 Minimum scenario:
A clean range trade OKX:TAOUSDT.P between $250 – $500, which already gives nearly 100% volatility without any global trend.
🔹 Maximum scenario:
= wait for a confirmed breakout and consolidation above $470
= continue gradual accumulation
= and then hold mid-term, targeting at least $1800
📈 This scenario only works if the broader market doesn’t break down — but structurally, #TAO looks very healthy.
🤔 Do you believe #Bittensor can become one of the core AI-crypto narratives of this cycle, or is this just another hype phase?
______________
◆ Follow us ❤️ for daily crypto insights & updates!
🚀 Don’t miss out on important market moves
🧠 DYOR | This is not financial advice, just thinking out loud

TAOUSDT | Bullish Cup & Handle..Still in PlayHello traders,
This is a constructive price action. I'm expecting a perfect C&H formation here on TAO. I think price will tap the $305 range, then a small correction will follow.
As long as price holds above the support, structure remains valid.
Projected target = cup depth, which aligns with the $370–375
Good Luck
If you find value in this content, a like supports more than anything🙏📊
Also, leave your comments and thoughts below

$TAO is trading inside a Descending Triangle!! GETTEX:TAO is trading inside a Descending Triangle. It is a decentralized, open source AI network where machine learning models collaborate and earn TAO tokens based on the value they contribute. TAO creates a trustless marketplace for AI, allowing anyone to build, access, and benefit from artificial intelligence in a transparent, incentive driven ecosystem. This positions TAO as a strong contender to lead the AI sector into 2026.
From a price action perspective, TAO is currently trading near a major long term support zone. If price holds the $180 to $170 area and delivers a clear bounce, followed by a decisive breakout above the descending trendline, the structure opens room for a potential 100 percent to 1000 percent upside over the next cycle. The $160 level remains key support, and a clean loss of this level would invalidate the bullish thesis.

TAO - MAGICAL PLAY AGAIN! Congrats patient champs! 🔥 🏆
I know that few of you believed it, but GETTEX:TAO is down -30% ✅
From 300 to 210! ✅
Monthly demand zone is in, but bearish pressure remains very strong 📉
New update coming soon!

$TAO at a Critical Inflection PointBittensor (TAO) continues to lead the AI narrative, with subnet growth accelerating and now exceeding 30 active subnets. On-chain staking rewards are supporting long-term accumulation, while a relatively low float relative to ecosystem expansion creates scarcity during AI-driven rotations.
Technical Outlook
TAO is sitting at a very critical area after losing the $300 level, which is now acting as resistance. The structure remains fragile, with sellers in control and most bounce attempts getting sold into.
A retest of the $200 level looks possible. If that zone holds, a short-term relief bounce toward $250–260 could follow. However, if price rejects again in that area, the risk of further downside increases before a more meaningful bottom forms. A clean break below $200 would significantly weaken the structure and opens the door to a much deeper move, potentially into the $60–50s range.

$Tao Trade Plan 🟢 Entry Zone : 229$ - 225$
🎯 Tps : 237$ - 245$ - 255$ - 270$
🚫 Invalidation :If price closes below $218, consider exiting the position manually to protect capital.
🚨 Market conditions remain uncertain, so avoid over-leveraging and trade with strict risk control. Capital protection comes first.
✅ Trade smart. Stay patient. Manage risk.

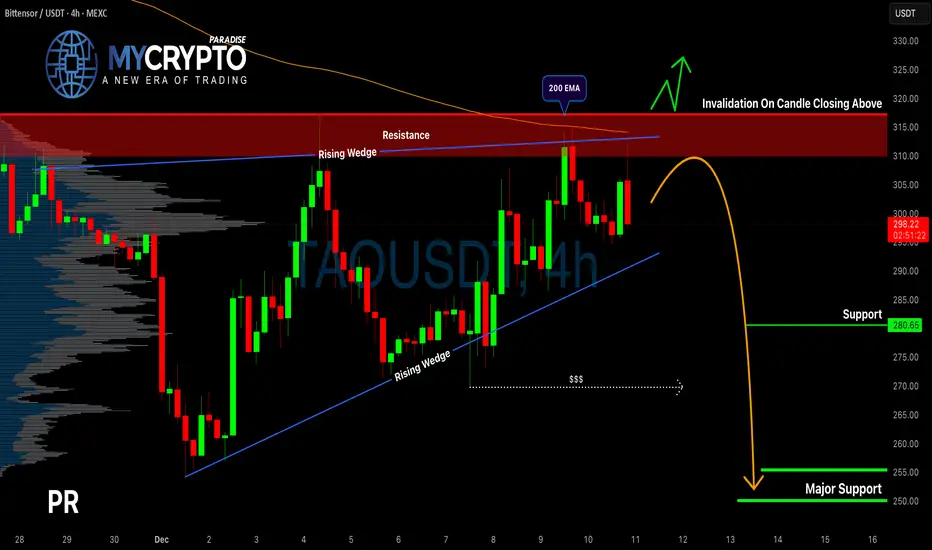
TAO Showing Weakness at Resistance — Is a Breakdown Imminent?Yello Paradisers! Are we about to witness a sharp rejection from resistance… or is this just the calm before the breakout storm?
💎TAOUSDT is currently reacting from a strong resistance zone and what makes things even more interesting is the rising wedge pattern that has formed in this area. This type of structure historically points to a higher probability of a bearish move, and right now, the conditions are lining up for potential downside.
💎But to secure a better risk-to-reward (RR) setup, a small pullback from the current level would be ideal. After that, we’ll look for a clear bearish candlestick formation to confirm entry. The main targets lie below, around the liquidity pools and key support zones, which also align with strong long-term levels.
💎Still, there’s one critical invalidation point:
If the price breaks and closes above the resistance zone, it would invalidate the entire bearish setup. In that case, the smart move is to wait patiently for a cleaner structure and more reliable signals before acting.
🎖This is what trading like a professional looks like, clear setups, no emotional bias, and total commitment to risk management. It's not about predicting every move perfectly, it's about positioning only when the odds are in your favor.
MyCryptoParadise
iFeel the success🌴
TAO - PRICE ANALYSISGETTEX:TAO - Price analysis:
Bearish on the weekly basis 📉
Upper Key levels:
315 | 320 & 340$
Under 340$ momentum remain clearly bearish. 📉
Following my previous HTF outlook, I still think that price will dump lower to visit the monthly demand zone around 225 - 200$.
At the moment PA remain very flat and stuck around the 320 - 270$ box⏳
Very flat chart. No direction on the short term, but still traded under Key levels.
Price could continue to move sideway for many weeks more. That's tipically a chart I avoid to trade on the short term.
🔔 I setted on key demand zone.

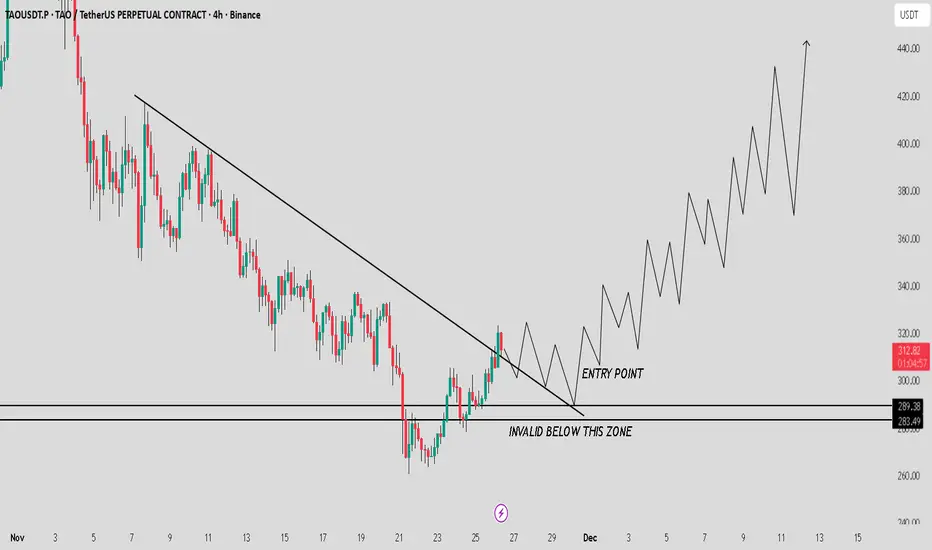
TAO/USDT - Breakout or Deeper Decline?TAO is currently trading in a critical decision zone. Price remains capped below a major descending trendline that has controlled the market for weeks. Every recovery attempt has been rejected, confirming that sellers are still in control.
However, tightening price action signals volatility compression, often preceding a powerful directional move. The market is no longer asking if it will move — only which direction it will choose.
---
Market Structure & Psychology
Repeated Lower Highs → clear bearish dominance
Weak rebounds → lack of strong buyer commitment
Tight consolidation between 295 – 308 → breakout or breakdown zone
This is a classic decision point, where a single impulsive candle can define the next trend.
---
Technical Pattern Analysis
Descending Trendline (Dynamic Resistance)
The descending trendline acts as:
Primary dynamic resistance
Seller control zone
Psychological barrier for buyers
As long as price remains below this line, all upward moves are corrective rallies, not trend reversals.
Compression Zone — “Before the Storm”
The narrowing range suggests:
Volatility is being compressed
Liquidity is being absorbed
A sharp expansion move is approaching
---
Bullish Scenario — Trend Reversal Confirmation
Key Conditions:
Clean breakout and strong 4H close above the trendline
Follow-through above 308 → 332
Bullish Confirmation:
Successful retest of the trendline as support
Impulsive candles (not wick-based breakouts)
Upside Targets:
332 → structural shift
355 – 365 → major supply zone
397 → bullish extension target
Meaning:
> A confirmed breakout would mark TAO as an early trend reversal candidate.
---
Bearish Scenario — Downtrend Continuation
Key Conditions:
Rejection at the trendline
Strong breakdown below 295
Bearish Confirmation:
High-momentum bearish close
Rising volume with no meaningful bounce
Downside Targets:
275 → interim support
254 → major demand zone
Meaning:
> A breakdown below support could trigger a capitulation move toward lower demand.
---
Primary bias remains bearish
Price is at a make-or-break level
Breakout = high-potential opportunity
Breakdown = elevated downside risk
Professional traders wait for confirmation, not predictions.
#TAOUSDT #CryptoAnalysis #MarketStructure #TrendlineBreak #PriceAction
#BearishMarket #BullishReversal #SupportResistance

TAOUSDT UPDATE#TAO
UPDATE
TAO Technical Setup
Pattern: Falling Wedge Pattern
Current Price: $310.90
Target Price: $584.00
Target % Gain: 87.76%
Technical Analysis:
TAO is breaking out of a falling wedge pattern on the 4-hour chart, indicating strong bullish potential. The price has recently surged above the resistance trendline, supported by an increase in volume. This breakout suggests that the setup is validated as the price approaches key resistance levels.
Time Frame: 1D
Risk Management Tip: Always use proper risk management.

TAO Update🚨📊 TAO Update
TAO is testing the red resistance zone 🔴.
If breakout occurs, first target = green line level 🟩🎯.

TAOUSDT UPDATE#TAO
UPDATE
TAO Technical Setup
Pattern: Falling Wedge Pattern
Current Price: $287.9
Target Price: $540.0
Target % Gain: 87.60%
Technical Analysis: TAO is breaking out of a falling wedge pattern on the 4H chart, signaling a bullish reversal after an extended corrective move. Price has successfully pushed above the descending resistance trendline, showing improving market structure and renewed buying momentum. The breakout opens the door for a continuation move toward the projected upside target, as long as price holds above the breakout zone and invalidation support remains intact.
Time Frame: 4H
Risk Management Tip: Always use proper risk management.

TAO – CUP & HANDLE BREAKOUT ALERT!🔥 TAO – CUP & HANDLE BREAKOUT ALERT! 🚀
TAO has formed a clean Cup & Handle pattern, and price is now sitting right at the breakout zone.
This setup often triggers explosive upside moves, and this chart is showing all the right signals:
✅ Perfect rounded Cup formation
✅ Handle forming inside a bullish falling channel
✅ RSI recovering above mid-line
✅ Tight consolidation = momentum loading
✅ Projection aligns perfectly with upside target
📌 Entry: 309.5
📌 Stop Loss: 302
📌 Take Profit: 321.5 🚀
Cup & Handle breakouts usually move fast and aggressively.
TAO is looking primed for a sharp breakout any moment.
⚡ Breakout = Quick Pump Potential
⚡ Add this to your watchlist NOW!

TAO / USDT : Strong above support and Ready for a bullish moveTAO / USDT is looking so good above the $283 – $289 levels…
If we see a clean retest and price holds above this zone, I’m expecting a strong upward movement towards $350 – $400 in the coming days. Momentum is picking up and structure is turning bullish step by step.
Manage risk wisely and follow the chart carefully… Breakdown below this zone will invalidate the setup.
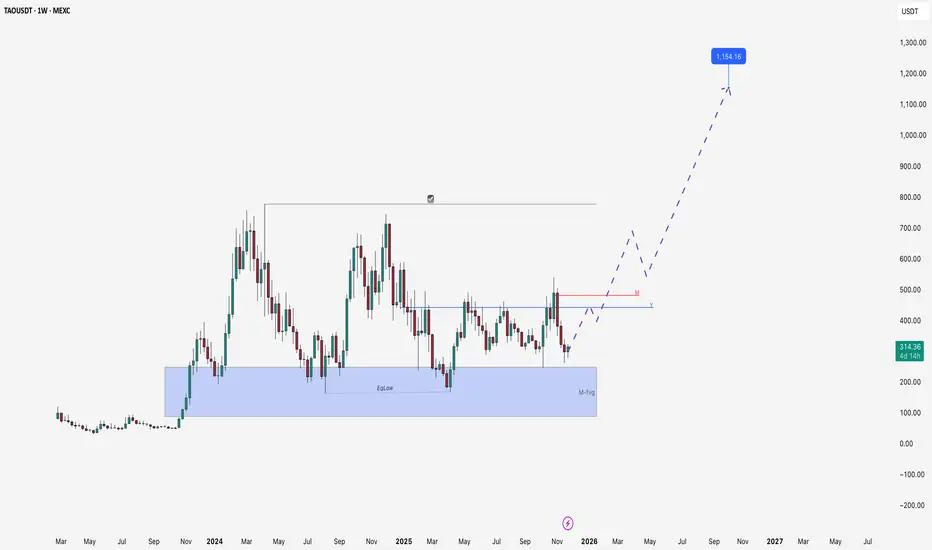
TAO Price Prediction 2026. What will be next with Bittensor?If we do end up seeing continued interest in the AI sector overall around the world, and this sector doesn't burst like the NFT sector did, then I'm expecting continued growth (but not colossal gains)! MEXC:TAOUSDT
We've been in a simple sideways movement for a year and a half now! Essentially, since the listing, it's been following the usual model but on higher timeframes—
impulse - sideways - and there should be another impulse.
Then, in a bearish trend (which will be deeper than the current correction), and once the hype around artificial intelligence fades, we'll see a close and a price retracement back to the levels of first taking out the eqlow and then filling the monthly FVG! At this stage, in December, it would be great to see a test of the yearly open, followed by continuation to taking out the highs and movement toward that indicated price target!
Thanks for supporting this idea
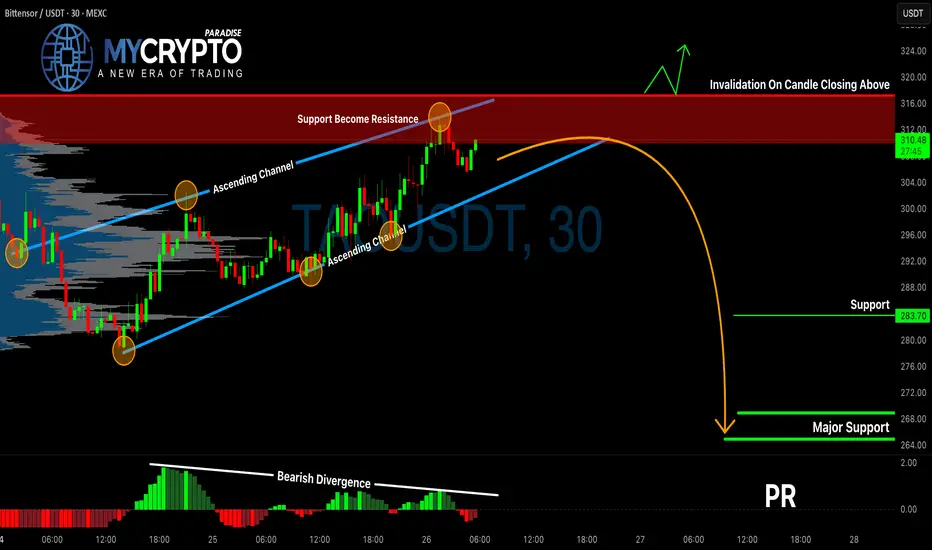
TAOUSDT Is Flashing a Dangerous SignalYello Paradisers, is this the calm before a major move down on TAOUSDT? The current setup is raising multiple red flags, and ignoring them could be a costly mistake.
💎TAOUSDT has formed an ascending channel, but what's critical to note is the bearish divergence on the MACD histogram, aligning perfectly with the previous support-turned-resistance zone. This combination of technical signals often precedes a breakdown, increasing the probability of a bearish move from current levels.
💎If the price pulls back slightly and prints a bearish candlestick pattern near this resistance zone, that would signal a high-probability short opportunity. The confluence of structure and momentum weakness offers a favorable risk-to-reward setup for traders who remain patient and disciplined.
💎However, if TAOUSDT breaks out and closes decisively above the invalidation level, the bearish outlook would no longer be valid. In that case, the best move is to step aside and wait for a stronger, more reliable setup to form before jumping back in.
🎖Strive for consistency, not quick profits. Treat the market as a businessman, not as a gambler. The market rewards patience, discipline, and strategy—never emotion.
MyCryptoParadise
iFeel the success🌴
TAO Update📊 TAO Update
TAO is testing the red resistance zone right now 🔴.
If price manages to break out above this red level,
the first target will be the green line zone 🟢 —
the next major area where buyers may take profit.

TAO — Bearish Continuation Setup📉In my view, TAO continues to show signs of wanting to move lower. The market structure still looks bearish, and sellers remain in control.
🎯 Target 1: 274
🎯 Target 2: 268
❌ Idea cancel zone: 285
❓I also think we may see TAO at 260, but this level is still uncertain for me.
🔔So stay tuned — I’ll post an update once TAO gets closer to 268
