TAO/USDT - Breakout or Deeper Decline?TAO is currently trading in a critical decision zone. Price remains capped below a major descending trendline that has controlled the market for weeks. Every recovery attempt has been rejected, confirming that sellers are still in control.
However, tightening price action signals volatility compression, often preceding a powerful directional move. The market is no longer asking if it will move — only which direction it will choose.
---
Market Structure & Psychology
Repeated Lower Highs → clear bearish dominance
Weak rebounds → lack of strong buyer commitment
Tight consolidation between 295 – 308 → breakout or breakdown zone
This is a classic decision point, where a single impulsive candle can define the next trend.
---
Technical Pattern Analysis
Descending Trendline (Dynamic Resistance)
The descending trendline acts as:
Primary dynamic resistance
Seller control zone
Psychological barrier for buyers
As long as price remains below this line, all upward moves are corrective rallies, not trend reversals.
Compression Zone — “Before the Storm”
The narrowing range suggests:
Volatility is being compressed
Liquidity is being absorbed
A sharp expansion move is approaching
---
Bullish Scenario — Trend Reversal Confirmation
Key Conditions:
Clean breakout and strong 4H close above the trendline
Follow-through above 308 → 332
Bullish Confirmation:
Successful retest of the trendline as support
Impulsive candles (not wick-based breakouts)
Upside Targets:
332 → structural shift
355 – 365 → major supply zone
397 → bullish extension target
Meaning:
> A confirmed breakout would mark TAO as an early trend reversal candidate.
---
Bearish Scenario — Downtrend Continuation
Key Conditions:
Rejection at the trendline
Strong breakdown below 295
Bearish Confirmation:
High-momentum bearish close
Rising volume with no meaningful bounce
Downside Targets:
275 → interim support
254 → major demand zone
Meaning:
> A breakdown below support could trigger a capitulation move toward lower demand.
---
Primary bias remains bearish
Price is at a make-or-break level
Breakout = high-potential opportunity
Breakdown = elevated downside risk
Professional traders wait for confirmation, not predictions.
#TAOUSDT #CryptoAnalysis #MarketStructure #TrendlineBreak #PriceAction
#BearishMarket #BullishReversal #SupportResistance
Taousdttrading

TAO – CUP & HANDLE BREAKOUT ALERT!🔥 TAO – CUP & HANDLE BREAKOUT ALERT! 🚀
TAO has formed a clean Cup & Handle pattern, and price is now sitting right at the breakout zone.
This setup often triggers explosive upside moves, and this chart is showing all the right signals:
✅ Perfect rounded Cup formation
✅ Handle forming inside a bullish falling channel
✅ RSI recovering above mid-line
✅ Tight consolidation = momentum loading
✅ Projection aligns perfectly with upside target
📌 Entry: 309.5
📌 Stop Loss: 302
📌 Take Profit: 321.5 🚀
Cup & Handle breakouts usually move fast and aggressively.
TAO is looking primed for a sharp breakout any moment.
⚡ Breakout = Quick Pump Potential
⚡ Add this to your watchlist NOW!

TAO — Bearish Continuation Setup📉In my view, TAO continues to show signs of wanting to move lower. The market structure still looks bearish, and sellers remain in control.
🎯 Target 1: 274
🎯 Target 2: 268
❌ Idea cancel zone: 285
❓I also think we may see TAO at 260, but this level is still uncertain for me.
🔔So stay tuned — I’ll post an update once TAO gets closer to 268

TAO/USDT — 215–180 Demand Zone Will Decide the Next Major Move?TAO is entering one of the most decisive moments in its multi-month structure. After losing its mid-range support and gradually sliding lower, the price is now approaching the same demand zone that has repeatedly launched strong macro rallies since 2024 — the 215–180 zone.
This zone is not just another support level.
It is a “liquidity engine” where institutions, swing traders, and smart money previously stepped in aggressively, triggering explosive recoveries back toward major resistances (459 → 700 → 777).
Now, the market is once again descending into this energy zone.
The question is: Will TAO bounce one more time, or will this be the first decisive breakdown that shifts the entire macro structure?
---
Market Structure & Price Pattern
Macro range has dominated since 2024 → alternating phases of accumulation and distribution.
Repeated rejections near 700–777 signal a strong supply ceiling.
Lower highs in recent swings indicate sustained short-term bearish momentum.
Demand Zone 215–180 remains the final stronghold for buyers before the macro bias turns fully bearish.
Recent candles show increased sell pressure as price approaches the zone → highlighting how critical buyer reaction will be here.
---
Bullish Scenario (Rebound From TAO’s Strongest Zone)
A highly anticipated scenario among swing traders:
1. Price enters the 215–180 demand zone and forms a clean reversal signal:
Bullish Engulfing
Strong Pin Bar / Hammer
Momentum bullish divergence
2. A confirmed break and close above 313 shifts the mid-term structure back to bullish.
3. Upside targets if the reversal holds:
459 → minor resistance
700 → major supply zone
777 → previous distribution top
This would replicate the market behavior seen multiple times before — TAO “recharging” in this zone before initiating multi-week rallies.
---
Bearish Scenario (Break Below the Strongest Demand Zone)
This scenario would change everything.
1. A 3D candle close below 180
2. Retest of 180 turning into resistance
3. Increasing sell volume → confirming distribution
If confirmed, TAO enters a territory with limited support below, opening the door to deeper markdown levels.
This would officially end the multi-year range structure and begin a major downward phase.
---
Core Conclusion
TAO is not simply “pulling back”.
It is testing the foundation of its entire trend.
The 215–180 demand zone is:
⭐ The highest-probability region for a measured long
⭐ The boundary between a major macro rebound and a macro breakdown
⭐ The zone that will define TAO’s trajectory for months ahead
TAO’s reaction here will act as the catalyst for its next explosive move — up or down.
---
#TAO #TAOUSDT #Bittensor #CryptoAnalysis #DemandZone #SmartMoney #PriceAction #SwingTrading #TechnicalAnalysis #CryptoOutlook

TAOUSDT UPDATE#TAO
UPDATE
TAO Technical Setup
Pattern: Falling Wedge Pattern
Current Price: $320.3
Target Price: $452.1
Target % Gain: 41.16%
Technical Analysis: TAO is breaking out of a falling wedge pattern on the 4H chart, showing bullish potential. The price has recently surged above the resistance trendline, with volume increasing, indicating a possible continuation towards the target price. The upward momentum is supported by the recent breakout.
Time Frame: 4H
Risk Management Tip: Always use proper risk management.

$TAO PlanGETTEX:TAO I put my buy orders in blue box. This is around 300/270 dollars. Also on the montly and weekly chart you can see this is a strong support. With 0.382 fib level around $294, I think this box will hold and we will see a bounce from it.
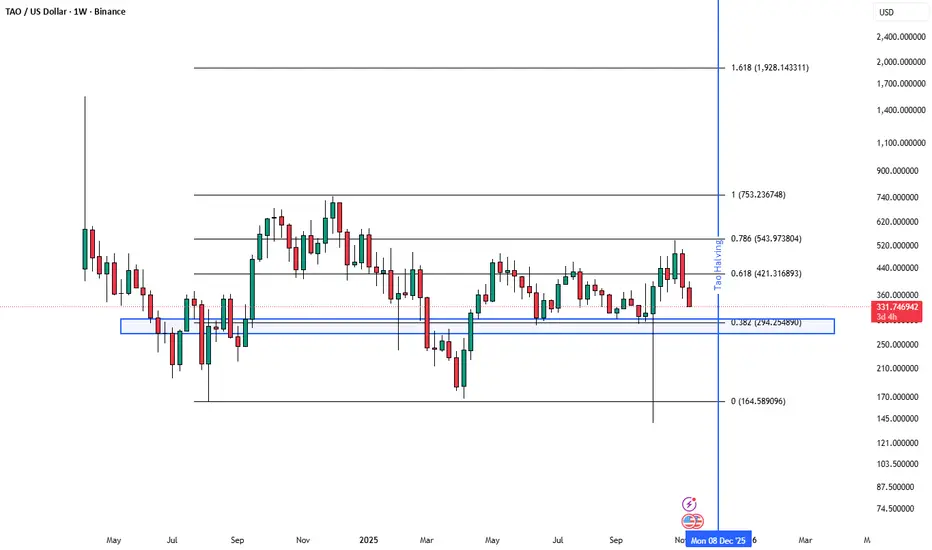
TAO/USDT — Breakout Incoming or Breakdown Imminent?TAO/USDT is now sitting on one of the most critical price zones of its entire mid-term structure.
On the 2D timeframe, price has returned to the Golden Demand Zone at 340–305 — an area that previously acted as accumulation, breakout base, and institutional defense line.
Now the market is testing it again, which means:
> How price reacts here will determine the next major directional wave.
---
🔶 Why the 340–305 Zone Is Extremely Important
A proven demand zone where buyers consistently stepped in with strength.
A flip zone (old resistance → new support).
A region where institutions filled liquidity before previous rallies.
Multiple long wicks were created here → indicating liquidity sweeps and strong buy absorption.
In simple terms:
This zone is the foundation of the current trend cycle.
---
📈 Bullish Scenario — “Institutional Rebound Setup”
If 340–305 holds firmly, the market may form a strong bullish reversal:
1. Bullish confirmation from the zone
Look for:
Strong bullish 2D candle
Long lower wick
Rejection from 305 followed by a close above 340
This would indicate aggressive buy-side defense.
2. Upside targets (layered resistances)
385 → first resistance, local take-profit zone
460 → key supply zone
560 → major resistance from previous distribution
725 → high-range target if bullish continuation strengthens
Bullish narrative:
> If the 305–340 zone is defended again, TAO is likely preparing for a multi-wave bullish move toward upper-range resistances.
---
📉 Bearish Scenario — “Breakdown = Trend Reset”
If price closes below 305 on the 2D chart, the structure shifts into a deeper corrective phase:
1. Breakdown of the Golden Zone
Buyers lose control
A failed retest of 305–340 → confirmation of bearish dominance
2. Downside targets
260–220 → next minor support
163 → major structural low and liquidity magnet in a full breakdown scenario
Bearish narrative:
> Losing 305 is not a simple breakdown — it signals a trend cycle reset and opens the door for deeper distribution.
---
🔍 Market Mood & Pattern: Range, Traps, and Energy Compression
TAO has been forming a large multi-month range
Repeated fakeouts and long wicks → liquidity hunting, not trending
This type of structure usually forms before a major breakout or major dump
Price is sitting at the tail end of compression — the next move out of 340–305 will define the coming trend direction.
#TAOUSDT #TAO #CryptoAnalysis #KeyLevels #MarketStructure #DemandZone #Breakout #Liquidity #SwingTrading #CryptoOutlook
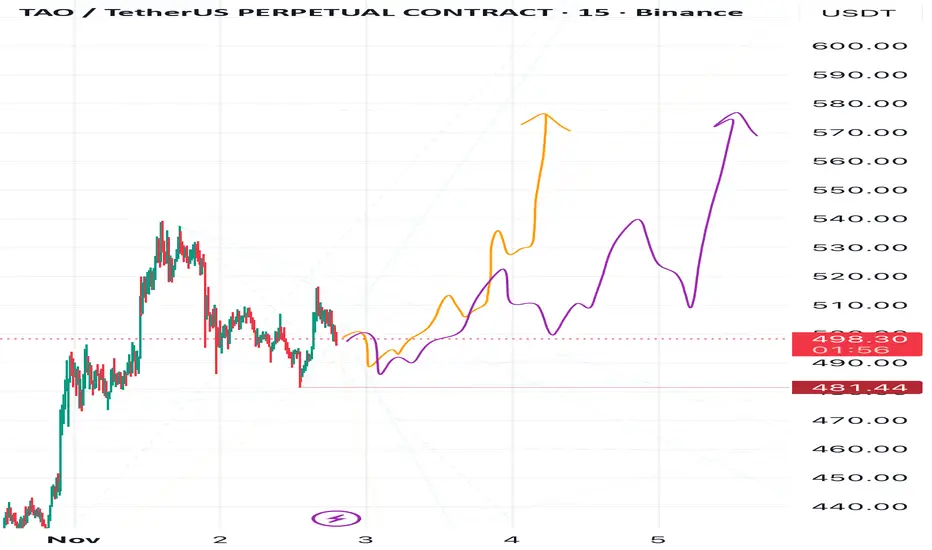
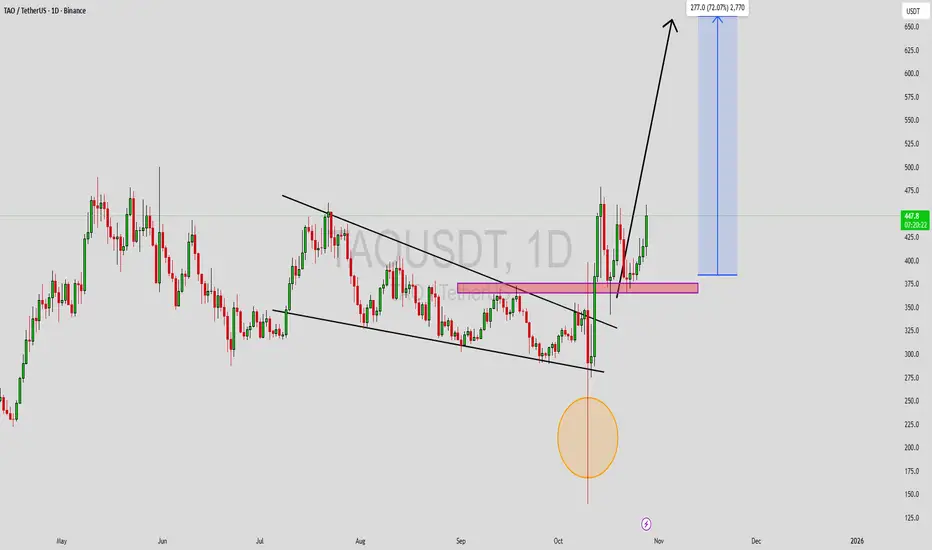
TAO in flow — will it rise or slow? TAO surprised me a bit this time — after it broke the invalidation zone I mentioned in my earlier post about this coin, it’s now hinting at another potential upward move.
As usual, I’m watching a few possible scenarios — marked by the orange and purple arrows on the chart.
🎯For now, my short-term target is around $426, and globally, I’m keeping an eye on $500 🚀
❌The invalidation zone remains at $369.34.
⚠️ Disclaimer: This analysis is not financial advice or a signal to take action.
Always make trading decisions based on your risk management, and never trade without stop-losses.
💬 What do you think — will TAO continue to grow, or is it just a temporary bounce?
Share your thoughts in the comments.
📈 Follow me for updates on TAO and other crypto analyses.

TAO/USDT — Bearish Structure Broken, But Can Support Hold?After months trapped beneath a major descending trendline, TAO finally broke out with strong bullish momentum — hinting at a potential trend reversal.
However, price has now pulled back to retest the golden zone (386–355), which serves as the final defense line for the bulls.
This yellow zone is more than just a support area — it’s the intersection of horizontal support and the old downtrend line, making it the most decisive structure on the current chart.
In simple terms: this is where conviction meets fear — the battlefield between buyers and sellers.
---
🟢 Bullish Scenario
If the price holds firmly above 386–355 and forms a clear bullish rejection or engulfing candle, it would confirm strong buyer presence and likely trigger another leg up.
Bullish confirmation: 2D candle close above 415–430.
Upside targets:
🎯 464 → first resistance & partial profit zone.
🎯 561 → key supply area & mid-range target.
🎯 698–744 → swing target & major resistance zone.
A clean breakout above 430 would signal that the bearish market structure has been fully broken, paving the way for sustained bullish momentum.
---
🔴 Bearish Scenario
If the price fails to hold 355 and closes below it, the bullish structure becomes invalidated, opening room for a deeper retracement toward 330–290.
Such a move would confirm that the previous breakout was just a classic bull trap, where liquidity was swept before resuming the dominant downtrend.
Bearish continuation would be reinforced by increasing sell volume and lack of any strong bullish reaction around the support zone.
---
📈 Technical Structure Overview
Dominant pattern: Descending trendline breakout + retest confluence support.
Mid-term bias: Neutral–bullish while price stays above 386–355.
Momentum: currently consolidating — potentially forming a base for the next expansion phase.
Market psychology: bulls are being tested — holding this zone keeps the bullish structure alive; losing it gives bears back control.
---
⚙️ Trading Plan
Conservative entry: wait for a 2D close above 415 for confirmation.
Aggressive entry: accumulate within 386–355, stop loss below 350.
Targets: 464 / 561 / 698.
Risk-reward: favorable setup (1:3 – 1:5) if the bullish scenario plays out.
---
🧠 Conclusion
TAO stands at a decisive crossroads.
The 386–355 golden zone is not just technical support — it’s the psychological frontier between hope and fear.
As long as this zone holds, the bullish narrative remains alive.
But once it breaks, the bears will take command again.
Whichever direction wins, this is the most important battleground for TAO this quarter.
#TAO #TAOUSDT #CryptoAnalysis #Breakout #SupportResistance #TrendlineBreakout #PriceAction #SwingTrade #TechnicalAnalysis #CryptoTrading

TAO to Glow — Just Like DASH FlowTAO is showing a price structure very similar to DASH, which makes me expect a strong upward move ahead.
I currently see two growth scenarios for TAO — following the purple and orange arrows on my chart.
Both lead to the same target zone:
🎯 Target 1: 580
🎯 Target 2: 640
🎯 Target 3: 720
❌ Invalidation Zone: 481.44
Both scenarios remain valid unless the price closes below that red level.
🚀 If you want more forecasts — leave a reaction!
🔔 Follow me so you don’t miss my daily updates — I post new analyses almost every day!
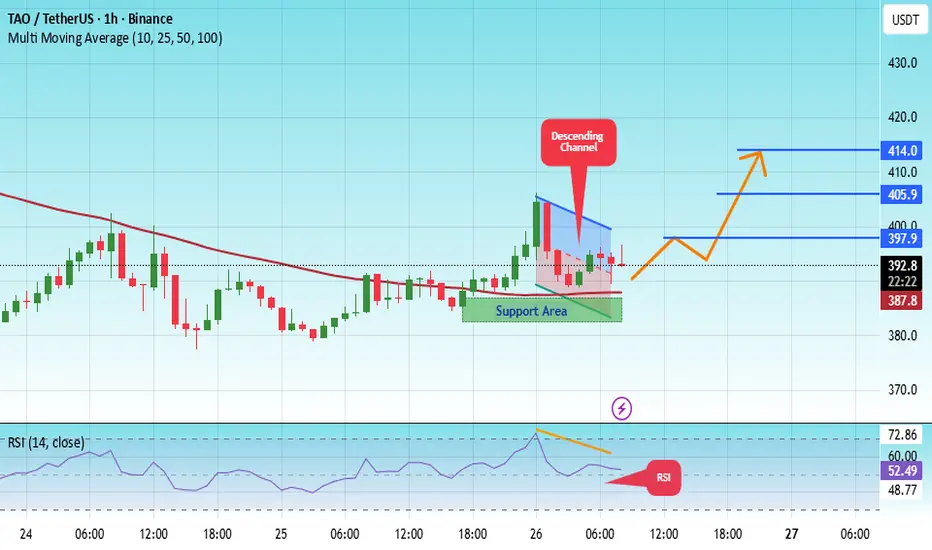
#TAO/USDT ranges for long term break out#TAO
The price is moving within a descending channel on the 1-hour frame, adhering well to it, and is heading for a strong breakout and retest.
We have a bearish trend on the RSI indicator that is about to be broken and retested, which supports the upward breakout.
There is a major support area in green at 385, which represents a strong support point.
We are heading for consolidation above the 100 moving average.
Entry price: 393.3
First target: 397.90
Second target: 405.90
Third target: 414
Don't forget a simple matter: capital management.
When you reach the first target, save some money and then change your stop-loss order to an entry order.
For inquiries, please leave a comment.
Thank you.
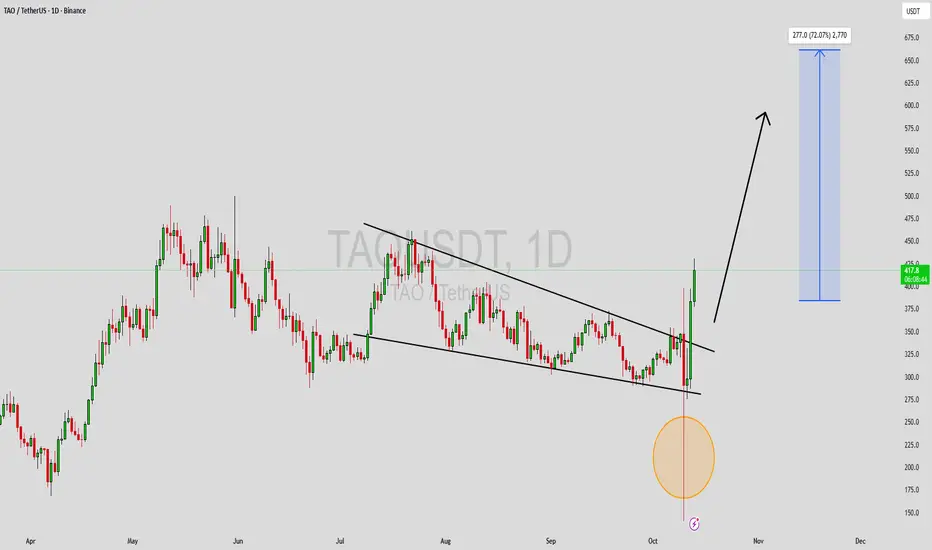
TAO/USDT — Triangle: Ready to Explode After Long Consolidation?TAO is currently standing at one of its most critical crossroads since forming a large structure earlier this year. The 2D chart reveals a Symmetrical Triangle pattern, a classic formation that signals the market is coiling energy for a major move ahead.
Each swing low keeps climbing higher, reflecting growing buying pressure — while the sequence of lower highs shows sellers are still defending strongly. These two forces are now colliding right around the key zone between ₮428 – ₮464.
---
Technical Structure Overview
Pattern: Symmetrical Triangle – pressure building toward an explosive breakout.
Key Resistance: ₮464 (confirmation once 2D candle closes above).
Bullish Targets: ₮563 → ₮614 → ₮701 → ₮744.
Dynamic Support: ascending trendline near ₮350–₮370.
Invalidation Level: daily/2D close below the rising trendline.
---
Bullish Scenario – “Pressure Before Expansion”
If TAO manages to break through the descending resistance and close above ₮464 with strong volume, it will confirm a breakout from this multi-month consolidation.
Such a breakout could trigger an impulsive rally, targeting ₮563 – ₮614, and potentially extending to ₮744, which is the previous major supply zone.
The strength of this setup lies in its duration — the longer the compression, the stronger the expansion.
---
Bearish Scenario – “Rejected and Retraced”
If TAO fails to break through the ₮428 – ₮464 confluence zone and gets rejected at the upper boundary, price may pull back sharply.
A breakdown below the rising support trendline could send TAO back toward ₮300 – ₮250, with extended downside risk to ₮167 if selling momentum accelerates.
This scenario gains validity only if a 2D candle closes below the ascending support with strong volume confirmation.
---
Conclusion
TAO is entering the final accumulation phase within this large triangle pattern — a period of calm that often precedes a powerful move.
At this stage, patience and confirmation matter more than prediction. Smart traders wait for the direction to reveal itself, then follow with discipline and tight risk management.
> “The bigger the base, the higher the breakout — or the harder the fall.”
TAO is now at the edge of its next major decision.
---
#TAO #TAOUSDT #CryptoBreakout #SymmetricalTriangle #TAOAnalysis #CryptoChart #TechnicalAnalysis #BreakoutSetup #TrianglePattern #CryptoTrading #PriceAction #Bittensor #AltcoinSetup #SwingTrade

TAOUSDT - simple and clean chart!TAO has formed a triangle pattern and just broke out on the 4-hour chart.
Don’t expect a major correction here — it’s showing strong momentum.
It’s likely heading above $600 soon, so keep a close eye on it — you’ll see what I mean.
Best regards :
Ceciliones🎯

TAOUSDT Forming Bullish MomentumTAOUSDT is showing a clear bullish momentum pattern on the charts, indicating a strong potential for upward continuation. The price structure suggests that buyers are steadily gaining control, with higher lows forming consistently — a sign of strength and accumulation. As the market maintains positive momentum, this setup could soon trigger a breakout toward higher resistance levels, confirming a strong bullish trend in the short to medium term.
The trading volume for TAOUSDT remains solid, showing that investors are actively engaging with this asset. Increased buying pressure alongside sustained volume often supports trend continuation and helps validate bullish setups like this one. If the momentum persists, the expected gain could range between 60% and 70%, aligning with key technical projections and market sentiment.
Investor confidence in the TAOUSDT project continues to grow, supported by recent positive developments and increased market exposure. With its strengthening momentum and favorable technical outlook, TAOUSDT is emerging as one of the promising pairs to watch closely. Traders may look for potential entry zones near support levels before the next upward impulse begins.
✅ Show your support by hitting the like button and
✅ Leaving a comment below! (What is You opinion about this Coin)
Your feedback and engagement keep me inspired to share more insightful market analysis with you!
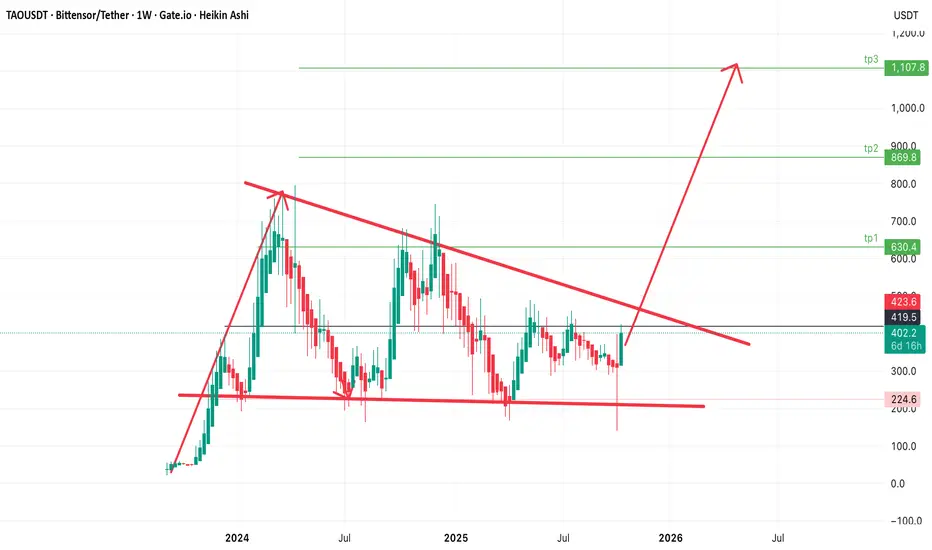
$tao TAO Bittensor Descending Triangle PatternGETTEX:TAO TAOUSDT Bittensor/Tether shows large descending triangle pattern forming on the Weekly timeframe— a classic setup for a major breakout when price breaks the downtrend line.
Current Price: $419
#TAO Chart Structure & Trend
Strong horizontal support between $224–230
Price recently bounced strongly from around $315 to $401, signaling momentum building toward a potential breakout of the triangle.
A decisive breakout above $450–470 would likely confirm a bullish reversal.
Key Levels
* Short-term: between $450–470 (trendline resistance and breakout zone)
* Medium-term: $630 (tp1)
* Extended: $870 (tp2) and $1,108 (tp3)
Invalidation of this Bullish bias is under $315
TAOUSDT: Bullish Breakout From Symmetrical TriangleTAO is showing a strong breakout setup on the 4H timeframe after consolidating within a symmetrical triangle pattern. Price has been forming higher lows while testing descending resistance multiple times - a classic sign of bullish pressure building up.
The breakout candle is now pushing above the trendline with increasing volume and EMAs (50/100/200) acting as dynamic support, indicating potential continuation to the upside.
Cheers
Hexa

TAOUSDT Forming Falling WedgeTAOUSDT is currently forming a falling wedge pattern, a classic bullish reversal setup that often signals the end of a downtrend and the beginning of a potential uptrend. This pattern indicates that bearish momentum is gradually weakening, while buying pressure is starting to build. With a good trading volume accompanying the setup, the breakout potential becomes stronger, suggesting that TAOUSDT could soon witness an upward surge. Based on the current technical outlook, an expected gain of 60% to 70%+ appears achievable once the breakout confirmation occurs.
The falling wedge pattern typically represents market consolidation before a significant breakout, where price action narrows down between converging trend lines. For TAOUSDT, this formation highlights a tightening price range with lower highs and lower lows, creating ideal conditions for a bullish breakout once resistance levels are breached. Traders are watching closely for a decisive candle close above the wedge line, which could confirm the reversal and trigger strong bullish momentum.
Investor interest in TAOUSDT is on the rise as accumulation patterns become evident across different timeframes. The improving volume profile adds further validation to the bullish setup, reflecting growing market confidence in this asset. With investors showing strong engagement and momentum indicators aligning positively, TAOUSDT could be positioned for a substantial breakout phase in the short to medium term.
✅ Show your support by hitting the like button and
✅ Leaving a comment below! (What is You opinion about this Coin)
Your feedback and engagement keep me inspired to share more insightful market analysis with you!
TAOUSDT Forming Falling WedgeTAOUSDT is currently displaying a strong falling wedge pattern, a bullish technical setup that often signals the end of a downtrend and the beginning of a major upward reversal. The price has been consolidating tightly within the wedge structure, suggesting that sellers are losing momentum while buyers are gradually stepping in. Volume remains steady and healthy, indicating growing accumulation and potential preparation for a breakout. With improving market sentiment, TAO could soon see a significant rally of around 60% to 70%+ once it breaks above the wedge resistance.
The structure of this falling wedge highlights a classic pattern seen before large bullish moves — declining highs and lower lows compressing toward a breakout point. This compression phase often precedes explosive upward movement, as traders and investors anticipate a reversal backed by solid technical signals. The recent market behavior and sustained volume further reinforce the bullish outlook for TAOUSDT in the short to mid-term.
Investor interest in this project is increasing as the broader market begins to recover and capital rotates toward fundamentally strong assets. TAOUSDT has shown resilience even during broader market corrections, making it a coin to watch for traders seeking breakout potential. A confirmed breakout with volume could mark the start of a new bullish leg, opening the door for higher price targets and strong momentum continuation.
✅ Show your support by hitting the like button and
✅ Leaving a comment below! (What is You opinion about this Coin)
Your feedback and engagement keep me inspired to share more insightful market analysis with you!
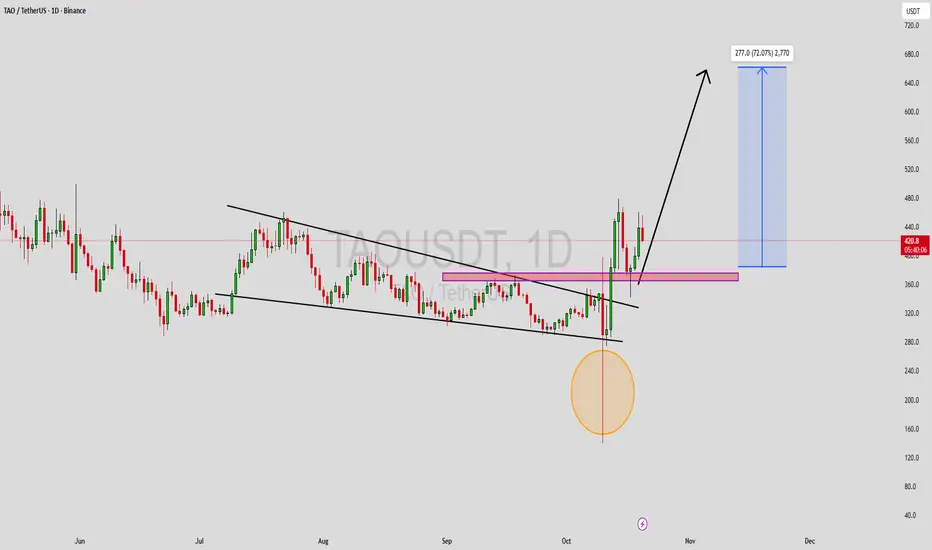
TAOUSDT UPDATE#TAO
UPDATE
TAO Technical Setup
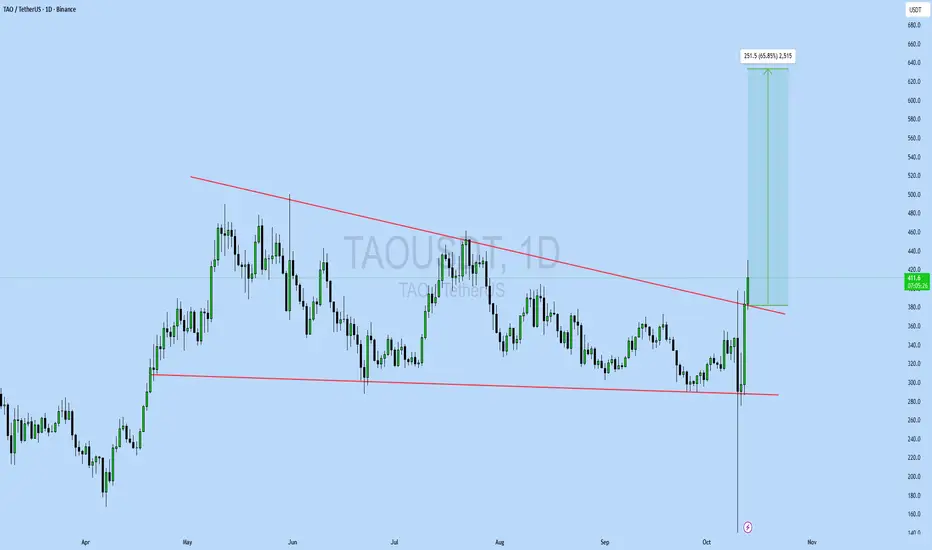
Pattern: Bullish falling wedge pattern
Current Price: $412.2
Target Price: $663.7
Target % Gain: 65.85%
GETTEX:TAO is breaking out of a falling wedge pattern on the 1D timeframe. Current price is $412.2 with a target near $663.7, indicating around 65% potential upside. The breakout suggests renewed bullish strength and continuation potential. Always use proper risk management.
Time Frame: 1D
Risk Management Tip: Always use proper risk management.
TAO Surging Towards $415WRITE ANALYSIS
ChatGPT said:
TAO is approaching a critical resistance level near $415 after breaking above the descending trendline. This could lead to a test of the key zone, which has been a significant resistance in the past.
A successful break above this level might fuel further upside potential, while rejection could push the price back toward the support zone around $350–$375.
Keep an eye on price action around the key levels for potential breakout or pullback.
DYOR, NFA

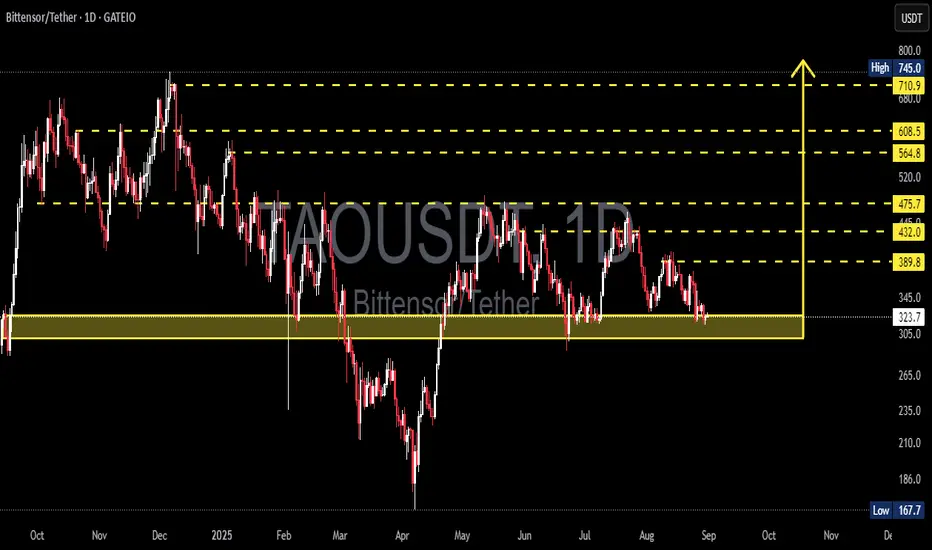
TAO/USDT – Demand Zone: Potential Double Bottom or Breakdown🔎 Market Overview
TAO/USDT is currently trading around 324 USDT, sitting right inside the key demand zone (305–345) that has been tested multiple times since late 2024. This area has repeatedly acted as a strong defensive wall for buyers, and once again the market is waiting for a big decision: bounce or breakdown.
From April to August 2025, the chart shows a series of lower highs, reflecting continued selling pressure. However, the repeated defense of this demand zone suggests accumulation is possible if a strong bullish reaction appears.
---
🧩 Price Structure & Pattern
Current pattern: Consolidation within the demand zone (305–345).
Key characteristics:
Buyers have successfully defended this level multiple times → potential accumulation area.
Larger structure still shows minor downtrend (lower highs).
A confirmed breakdown could trigger deeper sell-offs.
In short, this is the battle zone between bulls and bears that will determine the medium-term direction.
---
📈 Bullish Scenario
If price holds and bounces from the demand zone:
Confirmation: Daily bullish candle closing above 345–350 with strong volume.
Upside targets:
🎯 TP1: 389.8 (first resistance & short-term supply zone)
🎯 TP2: 432.0 (mid-term supply zone)
🎯 TP3: 475.7 (major resistance – key to shift medium-term trend)
🎯 Extensions: 564.8 – 608.5 – 710.9 – 745.0
➡️ A successful bounce could form a double bottom / base formation.
---
📉 Bearish Scenario
If price fails to hold the demand zone (daily close below 305):
Confirmation: Breakdown candle with strong volume + failed retest.
Downside targets:
🎯 265 – 235 (nearest supports)
🎯 167.7 (historical low – potential final target if strong selling pressure continues)
➡️ This would form a major support breakdown, potentially triggering a larger distribution phase.
---
⚖️ Technical Conclusion
Current bias: Neutral to Bearish – downtrend structure remains, but bulls are still defending.
305–345 is the make-or-break zone.
Bounce → potential rally towards 389–475.
Breakdown → possible drop to 235 or even 167.
---
🛡️ Risk Management Notes
Clear stop-loss levels:
Bullish setup: SL below 305.
Bearish setup: SL above 345–350 after breakdown.
Scale into positions rather than going all-in.
Watch for volume confirmation & momentum indicators (RSI/MACD) to avoid false breakouts.
---
📌 Extra Insights
The 305–345 zone is not only a technical level but also a psychological price floor, tested multiple times.
The structure of lower highs vs. strong support often resolves with a major breakout — meaning the next move could be very aggressive.
Patience is key: traders should wait for a clear daily close confirmation before entering to avoid being trapped in a fake move.
#TAO #Bittensor #TAOUSDT #CryptoAnalysis #TechnicalAnalysis #SupportResistance #Breakout #CryptoTrading #SwingTrading #PriceAction
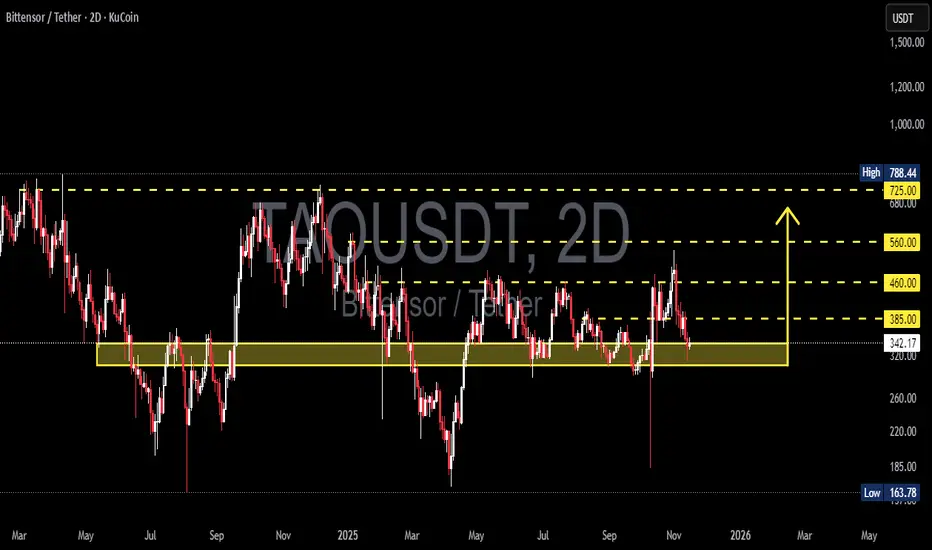
TAO/USDT Potential Reversal Zone – Major Bounce OpportunityTAO/USDT is currently testing a critical support zone (highlighted in yellow) between $220 – $280, which has historically acted as a strong accumulation area. The price has shown multiple reactions from this region throughout 2024 and 2025, signaling that bulls may be preparing for a reversal.
🔍 Key Technical Levels:
Major Support Zone: $220 – $280
Immediate Resistance Levels:
$350.9
$462.9
$560.8
$600
$719.1
Long-Term Resistance: $780 (local high)
🔄 Scenario: If TAO successfully holds this support zone, a bullish reversal could be triggered with a potential rally toward the $350 level first. A break and retest above this could open the door for a sustained move towards $560 and beyond. The bullish projection is illustrated with the yellow arrow path, showing a potential multi-stage rally through key Fibonacci and structural levels.
📉 Invalidation: A confirmed break below $220 would invalidate this bullish setup and could push TAO toward lower lows, potentially retesting $170 or even $127 support levels.
📌 Summary: TAO is approaching a historically strong support base. If the structure holds and volume supports the reversal, we could see a powerful leg up toward $560 and possibly $719 in the medium term. Risk management is essential, especially with volatility around macroeconomic events and Bitcoin price movements.

$TAO/USDT Eyes 18%$TAO/USDT is bouncing off a strong support zone around $340–$350.
It’s trading inside a descending channel and could target $420, an 18.60% potential move if support holds and momentum builds.
DYRO, NFA
