TCS – Momentum Shifting Upwards?1. Key Zones
Demand Zone: ₹2,850 – ₹3,000
Supply Zone: ₹3,600 – ₹3,720
2. Structure
Price has bounced strongly from the major weekly demand zone.
The descending trendline is broken, indicating a potential shift in momentum.
Price is now retesting the breakout zone for support.
3. Possible Move
If buyers hold above the ₹3,000–₹3,100 region:
→ Upside targets: ₹3,450 → ₹3,600 → ₹3,720
If price loses the ₹2,850–₹3,000 demand zone, weakness can resume.
4. Summary
TCS is showing early signs of a trend reversal after breaking the falling trendline.
Holding above the retest zone may lead to a push toward the upper supply area.
⚠️ Disclaimer
This analysis is for educational purposes only and not financial advice. Always do your own research and manage risk.
Tataconsultancy

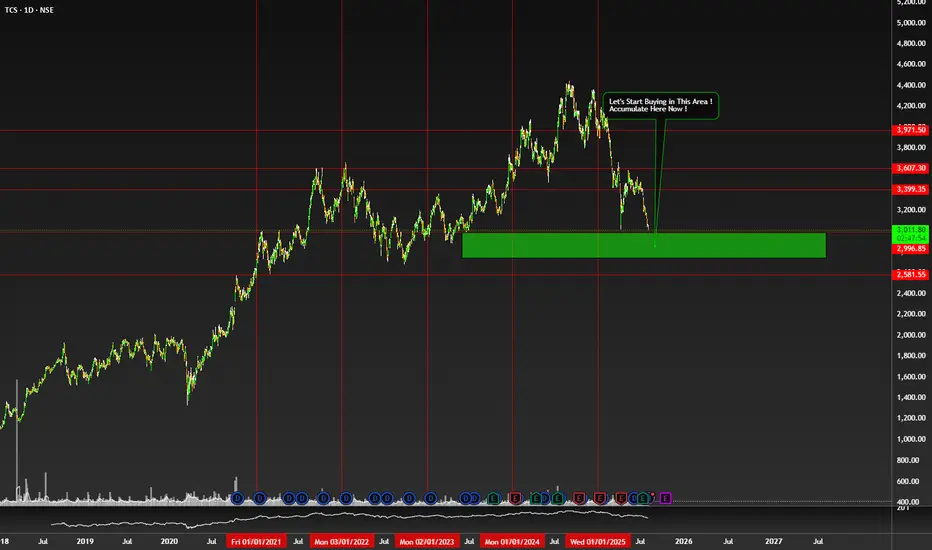
Time To Accumulate $NSE:TCS NSE:TCS
My Trade Opinion
Let's Accumulate here in Green area.
Best time to Buy here.
Don't Buy if Some One Think IT will Dead in india. :D
Future is at Some Time Ahead.
Don't Listen Just Observe it.
Company is Going to Aggressively Progress in Future.
Tata Consult. should target 4733 after crossing resistanceDaily chart, the stock is trading in an uptrend.
The technical indicators RSI and MACD are showing higher probability to cross the Resistance line (blue) at around 4020 - 4025
After crossing, the target will be 4733
Stop loss below 3830 should be considered

TATA CONSULTANCY STOCKS.Weekly analysisHello ladies and gentleman,according my analysis To TATA CONSULTANCY STOCK .there is agreat probability long to 3862 INR.

TCS - POSSIBLE BEARISH MOMENTUM ON THE KEY LEVEL FORMED
For more updates, please follow my TradingView page, and if you find the content useful, kindly hit the "thumbs up" button to show your support. If you have any queries regarding trading, please feel free to send me a direct message on TradingView. Additionally, please share this content with your friends who may find it beneficial.
Please note that any trading updates provided here are for educational purposes only, and it is always advisable to conduct your own research before making any investment decisions. It is important to ensure that all conditions are met before following any trade plan suggested in this update.

TATA CONSULs HEADING TO A NEW HIGH CLOSE TO Rs 3400Price of TCS is breaking above the support with a breakout and pullback formation.
Here we are expecting the prices to revisit the highs close to Rs 3397 with the next move.

INDIAN IT INDEX & STOCKSHELLO ALL, GOOD EVENING,
VERY INTERESTING MARKET CLOSED DEEPLY NAGATIVE,
DESPITE OF GLOBAL & INDIAN MARKET, IT SECTOR IN POSSITIVE.
Accenture results good, but guidance given some low comparitively less than
last quarter. it sector going to anounce jan 12 start with infy.
just check TCS, INFY & HCL THESE
1.Closed above moving avg
2. fibb retracement done & going up ward direction
volume supporting
keep on eye IT STOCKS

#TCS Weekly Major Support & Resistance Levels.Providing Weekly Support and Resistance levels for next coming week based on Central Pivot Range and its major support & resistance levels of week, where price can take support and face resistance. Three black lines indicating weekly Central Pivot Range. Previous week high & low also performs as a major support and resistance levels. Can take long & short positions according to how price perfoms at particular given support & resistance levels.

TCS touched its bottom, NOW go bull!!tcs has touched its bottom, as you can clearly see in the chart.
i have even said about macd which is also saying to go bullish.
previously i had posted on nifty IT, saying that it also has bottom itself, and will now move up.
tcs consists of about 25% of nifty it.
TARGET- 3800, TAKE A LONG SWING TRADE.

TATA Consultancy (TCS) May Fall, It can be Shorted 24/02/2021 Tata Consultancy Services Limited (TCS) is engaged in providing information technology (IT) services, digital and business solutions. The Company's segments include banking, finance and insurance services (BFSI); manufacturing; retail and consumer packaged goods (CPG); telecom, media and entertainment, and others, such as energy, resources and utilities, hi-tech, life science and healthcare, s-Governance, travel, transportation and hospitality, and other products. Its services portfolio consists of IT and assurance services, business intelligence and performance management, business process services, cloud services, connected marketing solutions, consulting, engineering and industrial services, enterprise solutions, IT infrastructure services, mobility products and services and platform solutions. Its software offerings include Digital Software and Solutions, TCS BaNCS and TCS MasterCraft, among others. It serves industries, including insurance, healthcare, retail, telecom and others.
Technical:
as we can see the price was in a bullish channel and it has now broken the lower boundary of the same channel
there exist bearish Divergence with MACD and MACD Histogram which is the sign of trend reversal and we can be sure after some candle confirmation that this Ticker is going to fall if the Channel break is confirmed by some candle pattern.
as of now we can have an eye on it for shorting it after some confirmation

TCS TCS took resistance at 3327 that is good rejection point. I think it will retest or fall up to the supply zone that is 3262 to 3247 ( resistance zone )

BUY at current levelmoving averages are converging and
supertrend positive and macd is signalling buy


Tata Consultancy services shares - possible drop to 2950Tata Consultancy services shares - possible drop to 2950

TCS: moving upward 🚀 swing setup TCS breaks all resistance and moving upward... short-term setup at buy (3130-3160).

TCS-INTRADAY Inverse H&STCS bounced from FIB 23.6 and still can go up anytime after retesting short term resistance. Also it is making an inverse H&S should bounce perfectly if everything goes as planned.

TCS - Reverse Head and ShouldersTCS has been respecting the range proposed in the last idea. Still waiting to see closing above 2744 for a significant upside.
However, we can see formation of a reverse head and shoulders pattern at the resistance line of 2744. This means a breakout on closing basis shall take the stock up fast.

TCS - December of Sideways MovementAfter a commendable run post good results and buy back. TCS has moved back into its upwards channel and is not consolidating with support of the gap created on Buyback news.
December month is good option to sell calls of 2750 and take long positions on closing above 2750 for 3000 levels.

TCS - Breakout & Retesting (Bull Flag & Double Bottom) - SwingThis analysis is purely based on price action and chart pattern.
Analysis is done on daily TF hence it may take several days to couple of weeks to reach its target. Traders can also take advantage of this analysis in intraday trades.
Trade Strategy along with logic is explained in image itself.
Always plan your trade & trade your plan
Keep trailing SL accordingly once entered into the trade.
This analysis is purely for education purpose. Kindly do your own study before entering into any trade .
Feel Free to comment for any query and suggestion.


TCS - Bullish H&S pattern in making - Short Term Swing TradeThis analysis is purely based on price action and chart patterns.
The analysis is on One Hour (60min) TF hence target can be achieved in a couple of days to a week or so.
Trade strategy is explained in image itself.
Don't run after the price.
Always plan your trade & trade your plan
Keep trailing SL accordingly once entered into the trade.
Trade at your own risk and money management
Feel free to comment for any queries & suggestion


TCS - Cup & Handle Pattern - Intraday/Very short term swingThis analysis is purely based on price action
The analysis is on 15min TF hence target can be achieved in intraday trade or in couple of days
Trade strategy is explained in image itself (Entry above high of breakout with SL in range of 2675-2672)
Always plan your trade & trade your plan
Keep trailing SL accordingly once in trade
Trade at your own risk and money management
Feel free to comment for any queries & suggestion
