Tata Power Can Give 20–30% Upside Move in Short Term🚀 One Stock That Can Give 20–30% Upside Move
Stock: Tata Power Company Limited ⚡ - NSE:TATAPOWER
🔥 Why This Stock Is On The Radar
• Power and energy transition capex cycle remains strong
• Renewable, transmission, and distribution exposure in one platform
• Execution visibility remains healthy across segments
This Is Not A Fresh Breakout.
This Is A Re-accumulation Setup.
📊 What The Chart Is Showing
• Strong rally already played out earlier
• Price corrected through time, not price
• No major structural breakdown
That Is The Key Observation.
📈 Current Price Behaviour
• Price consolidating around the 385–400 zone
• Candles overlapping tightly
• Volatility compression visible
• Higher lows still intact
Price Is Holding Strength.
It Is Not Distributing.
⏳ Why A 20–30% Move Is Possible
• Power stocks tend to move in momentum legs
• Supply has been absorbed during consolidation
• Breakout from a tight range can be swift
🎯 Trade Idea Framework
• Entry: Sustained hold above 402
• Stop-Loss: Below 375
• Targets:
– Target 1: 460
– Target 2: 510
👀 Confirmation Rule
• After breakout, price should not fall back below 395
• Volume should expand on the breakout
Back Below The Range = No Trade.
Hold Above The Range = Momentum Active.
🧠 Final Line
Strong Trends Often Resume After Quiet Consolidation.
Tata Power Is Currently In That Phase.
That Is The Edge.
Keep Learning. Keep Earning.
TATAPOWER

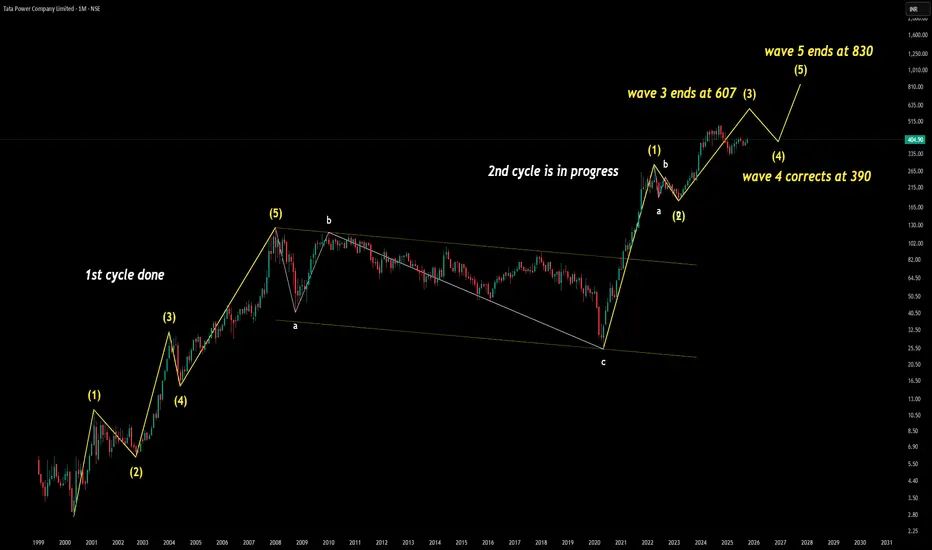
2 Elliot Wave Cycle candidate 1st Cycle – Completed
Impulse Waves: (1) → (5)
Corrective Waves: A → B → C
Classic wave symmetry with post-correction breakout
2nd Cycle – In Progress
Wave (1) and (2) formed strong base
Wave (3) extended sharply, ends at 607
Wave (4) correction expected near 390
Wave (5) projected target: 830+
Analyst Learning Takeaways
Wave 3 typically shows strongest momentum—confirmed here with a sharp rally to 607
Wave 4 often retraces 38–50% of Wave 3, making 390 a logical support zone
Wave 5 tends to mirror Wave 1 or exceed it if sentiment and volume align
Analyst View The current wave structure suggests a healthy impulsive cycle with textbook symmetry. Wave 3 has shown strong directional conviction, and the expected Wave 4 correction toward 390 aligns with Fibonacci retracement norms. If price stabilizes above 390, it confirms buyer strength and sets the stage for Wave 5. The projected target of 830+ is based on proportional extension logic and prior cycle behavior. This setup resembles the 2014 rally, where a similar Wave 4 held and led to a breakout. Traders should monitor volume and sentiment near 390—any breakdown below this level would invalidate the bullish continuation and call for reassessment.
TATA POWER – Reversal Setup Near Key Support | Cup & Handle TATA POWER – Reversal Setup Near Key Support | Cup & Handle Retest
For Study Purpose Only
🕒 Timeframe: Weekly & Daily
💡 Pattern: Cup & Handle (trendline retest + neckline breakout)
📈 Current Zone: ₹400–₹410
🎯 Targets: ₹418 / ₹430
⏳ Duration: 10–15 Days
🧭 Technical View:
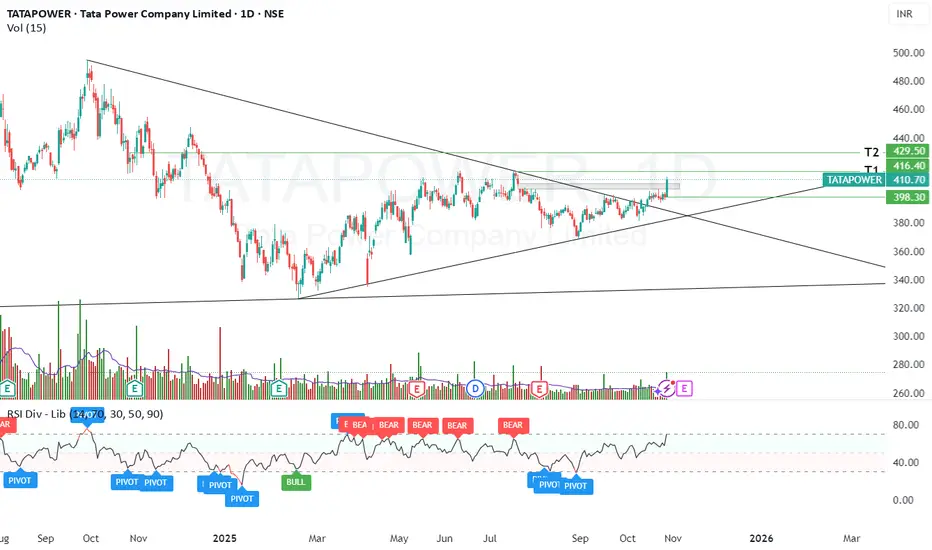
On the weekly chart, Tata Power has taken support along the previous cup-and-handle trendline, right near the lower boundary of the handle, and has reversed upward from this level — suggesting a continuation of the larger bullish structure.
On the daily chart, the stock has delivered a clean neckline breakout while also filling the earlier runaway gap in the ₹400–₹410 zone. This gap fill acts as a successful retest of support and builds a foundation for the next leg up.
The price has shown healthy consolidation just below ₹400, forming a base with stable volume. A sustained close above ₹400 could trigger a short-term reversal move toward ₹418 and ₹430 levels in the coming sessions.
📊 Study Highlights:
Weekly support confirmation at previous trendline
Neckline breakout with retest on daily chart
Gap fill adds confidence to structural strength
Consolidation phase ending near ₹400
Momentum recovery visible on short-term indicators
⚠️ Disclaimer:
This analysis is purely for educational and study purposes. Not a buy/sell recommendation. Always conduct your own due diligence.
Tata Power – Coiling Tight for a Potential BreakoutTata Power Company Ltd – Coiling Tight for a Potential Breakout
#TATAPOWER
📈 Pattern & Setup:
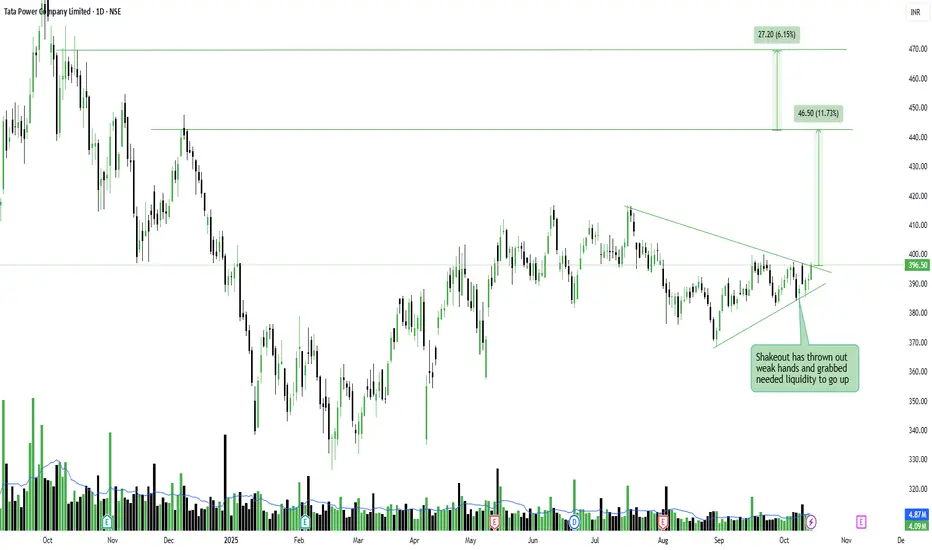
Tata Power is currently forming a beautiful symmetrical triangle pattern after months of sideways consolidation. The repeated shakeouts near 380 have helped absorb supply, while higher lows over the past few sessions indicate silent accumulation.
The stock is now approaching the tip of the triangle around 398–400, where a decisive breakout with volume could trigger a swift rally toward 440–460 levels. The volume profile is gradually expanding, confirming that quiet accumulation may be taking place under the surface.
📝 Trade Plan:
✍Entry: Above 401 (breakout confirmation)
🚩Stop-Loss: 384 (below recent swing low)
🎯Targets:
Target 1 → 445 (11% potential move)
Target 2 → 470 (17% potential move)
💡 Pyramiding Strategy:
1. Enter with 60% position above 401
2. Add 40% more once price sustains above 410 with volume expansion
3. Trail stop-loss to 392 after price crosses 425
🧠 Logic Behind Selecting this Trade:
This setup represents classic pre-breakout compression, where volatility contracts before expansion. The shakeouts have flushed out weak hands, creating a base of strong holders ready for a momentum move. If volume confirms, Tata Power could lead the next leg in the energy sector rally.
Keep Learning. Keep Earning.
Let’s grow together 📚🎯
🔴Disclaimer:
This analysis is for educational purposes only. Not a buy/sell recommendation. Please do your own research or consult your financial advisor before trading.
NSE:CNXENERGY
SENSEX 1D Timeframe📉 SENSEX Daily Overview (as of July 25, 2025)
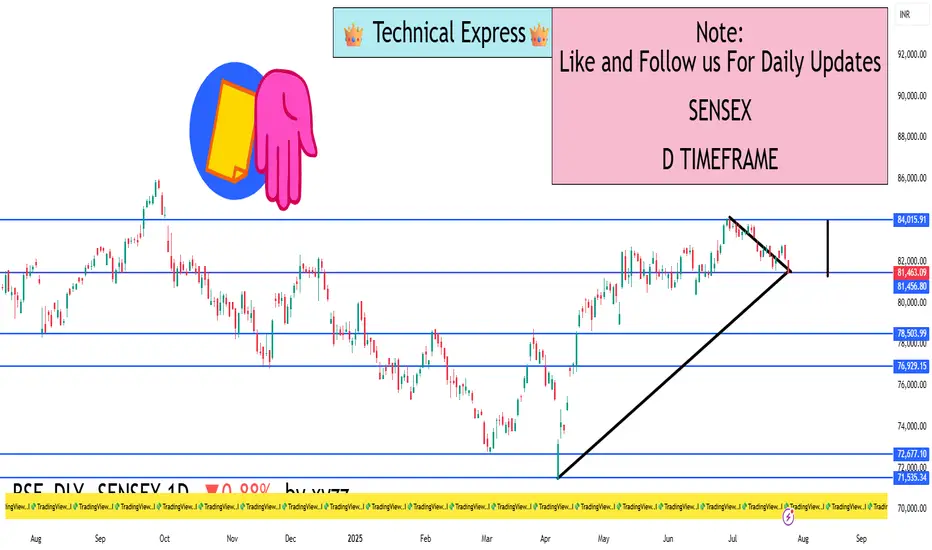
Current Price: Around 81,460
Daily Change: Down by approximately 720 points (–0.9%)
Day’s High: About 82,070
Day’s Low: About 81,400
Previous Close: Around 82,184
📊 1-Day Candlestick Analysis
The candle for today is bearish, indicating strong selling pressure.
The price opened near previous levels but faced resistance at around 82,000.
Sellers dominated most of the day, pushing the index toward the 81,400 support zone.
🔍 Key Support and Resistance Levels
Level Type Price Range
Resistance 82,000 – 82,200
Support 81,400 – 81,000
If Sensex breaks below 81,400, the next target could be around 80,500 or 79,900.
If it holds above support and bounces, it could retest 82,200.
🧠 Technical Trend Analysis
Short-Term Trend: Bearish
Medium-Term Trend: Neutral to mildly bullish (as long as above 80,000)
Market Structure: Lower highs forming, suggesting pressure building on bulls
Indicators (assumed):
RSI may be approaching oversold
MACD likely showing bearish crossover
Volume increasing on red candles—indicating strong sell interest
📌 Sentiment & Market Context
Financial stocks (like banking, NBFCs) are under pressure.
Global cues (such as interest rate uncertainty and geopolitical concerns) are impacting investor confidence.
FII outflows and weak earnings in key sectors are adding to bearish momentum.
The broader trend remains range-bound, but with short-term downside bias.
✅ Strategy Suggestions (For Traders & Investors)
Swing Traders: Wait for a reversal candle (like a bullish engulfing or hammer) before considering long positions.
Breakout Traders: Watch for breakdown below 81,000 for continuation of the fall.
Positional Traders: Can wait to enter near 80,000–79,500 if the market holds that key level.
🔄 Summary
SENSEX is under pressure with a drop of 720+ points.
Technical structure suggests caution, especially if 81,000 breaks.
Support: 81,000 – 80,500
Resistance: 82,000 – 82,200
Tata Power is showing strengthTata Power's technical indicators suggest a strong buy signal based on moving averages and oscillators. Here’s a quick breakdown:
- Relative Strength Index (RSI): 65.04 (indicating bullish momentum)
- MACD: 3.38 (positive crossover, signaling upward trend)
- Moving Averages: All major SMAs and EMAs indicate a buy
- Pivot Points: Key support at ₹388.64, resistance at ₹398.69
Close Above 400 mark will be positive
- Short-Term Forecast: Technical analysis suggests support around ₹390 and resistance near ₹626, with a potential price target of ₹417.23 in the next two weeks.

Tata power, good buy for long term and short term Tata power one of the best best fundamental stock now available at good demand zone one can add in portfolio if not added yet
Can add at levels of 380-405
Sl mclbs 365
Tgt atleast:1:2 & 25% to 100% expecting a blast before a Indian budget
Ask your financial advisor and broker before buying
Only for educational purposes

TATAPOWERNSE:TATAPOWER
One Can enter now!
Or Wait for a retest of the trendline(BO)!
Or Wait for a better Risk:Reward Ratio!
Note :
1. One should go long with a StopLoss, below the Trendline or the Previous Swing Low.
2. Risk :Reward ratio should be minimum 1:2.
3. Plan your trade as per the Money Mangement and Risk Appetite.
Disclamier : You are responsible for your profits and loss.
The idea shared here is purely for Educational purpose.
Follow back, for more ideas and thier notifications on your email.
Support and Like incase the idea works for you.

TATAPOWER Trading within tested Demand Zone of ₹419.15 to ₹411.3TATAPOWER's current price is ₹417.7, positioning it within a demand zone between ₹419.15 and ₹411.3. This zone is tested, and may act as a support level. Investors should keep an eye on the stock's performance in this range, looking for signs of a potential price bounce or consolidation, which could indicate a favorable buying opportunity.

Tata Power Co. Ltd. - Technical OverviewTarget Price: ₹560 (As per Nomura's analysis)
Price Action: The stock is currently trading at ₹456.90 (+3.54% for the day). It has been in a steady uptrend, following a clear rising channel since early 2024, supported by both the 50-day and 200-day moving averages, which indicates long-term bullish momentum.
Key Levels:
Support: ₹435.50 (currently a strong support level near the lower trendline)
Resistance: ₹507.40 (the recent upper boundary of the trend channel)
Target Price : ₹560 (suggested by Nomura)
Trend Channels:
The stock has formed a well-defined ascending channel , where the price tends to respect both the upper and lower boundaries.
Recent pullbacks toward ₹435.50 suggest that the stock is consolidating before a potential bounce toward ₹507.40, and possibly ₹560 in the medium term.
Price Momentum:
RSI: The Relative Strength Index (RSI) suggests that the stock is not in overbought or oversold territory, signaling healthy price momentum.
Volume : Notice the spike in volume during price rallies, reflecting strong market interest and confirmation of price movements.
Outlook:
Given the current market setup, Tata Power is showing signs of continued bullish momentum within its trend channel. A move beyond ₹507.40 could trigger further buying, pushing the stock towards ₹560 in the medium term. Any price retracements to the ₹435 level can be seen as a potential buying opportunity, given the channel support.
Chart Details:
Green Lines : Support and resistance levels.
Blue Channels : The stock’s rising trend, representing medium-term bullish momentum.
Volume: Key volume spikes highlight investor activity during price jumps.

TATA Power Breaks Out of Consolidation Range!➡️ Bullish breakout above ₹471.05
➡️ Next target: ₹500 on the upside


BAYERCROP LONGThis stock fundamentally too strong also its agri product
it will go upto 8-9k 6month-1year
if its retrace 5k-4k-3k is entry
no stoploss only for investment
dividend is Rs.100+/year

TATAPOWER: Bullish Breakout with Key Indicators
Bullish breakout from resistance
RSI approaching overbought levels
Trading within a range since April

Tata PowerVery Good Run up... in recent times....
But Some profit booking anticipates...
Below 433.. (ON CB)
419 and 399 good Support Zone to Enter

#RALLIS 288 TGT 525 #Investment #TataChem #TATASons #TATAMOTORSRALLIS 288
TGT 525
SL 224
RR ~4
Timeframe <8M
Return > 80%
Risk < 25%
NSE:RALLIS
Buy Recommended
Can hold for long term
Shared with 💚
By Rachit Sethia

Tata Power
Tatapower :
1. Super Breakout above 363....
2. Some profit booking seen on last trading day...
3. One of my favorite stock..
4. Evey investor should have this in their portfolio...
5. I have marked price road map on the chart...
6. Every dip you can add near green lines...
7. Traders can use to plan their trades based on the levels...
Happy Trading
Like.. Share.. Follow

TATA POWER showing bullish divergence breakout of raising wedgetata power showing bullish signs as previous weekly gave bullish close and daily RSI showing convergence strength.
according to breakout it can reach 475 target.

TATA POWERTATA POWER has successfully broke the weekly resistance.
currently waiting for pullback for entry.

Longbullish above 91.95
swing for target of 100 if maintain above 91.95
t1 93.65
t2 100
buy only above resistance
ryt now accumulation in progress


Tata Power getting readyHello Friends,
Your favorite Tata Power getting ready for rally. Above 215 , good move expected.

TATAPOWERwe are looking TATAPOWER bullish move.
Disclaimer:
Kind regards to all friends and members ,
Stock market investment is subject to 100% market risks. Our company is not a SEBI registered company. Please consult your financial advisor before investing. This is for learning and training purposes only. Market Traps administrators are not responsible for any financial gains or losses resulting from your decisions. You acknowledge that stock market investments are highly risky and that you understand the market risks involved. Hence any legal action is void.
