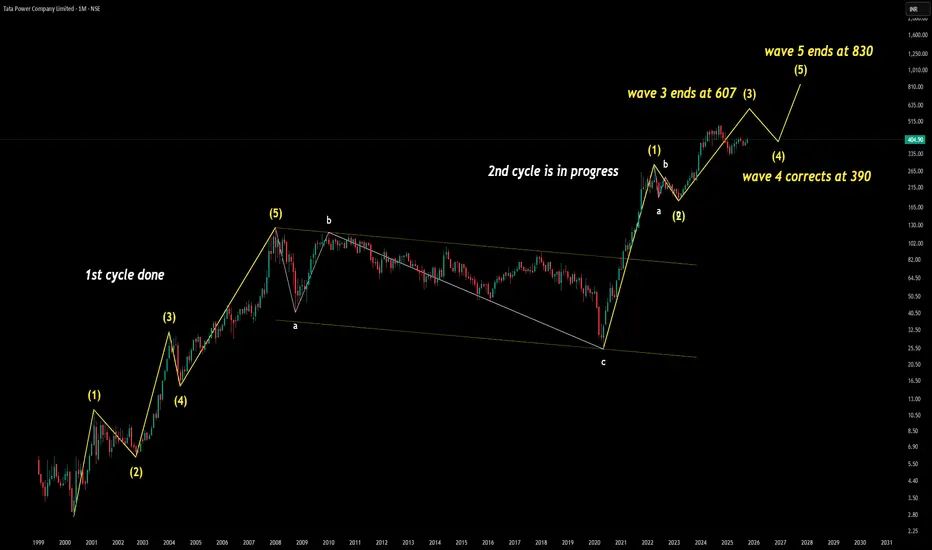
2 Elliot Wave Cycle candidate 1st Cycle – Completed
Impulse Waves: (1) → (5)
Corrective Waves: A → B → C
Classic wave symmetry with post-correction breakout
2nd Cycle – In Progress
Wave (1) and (2) formed strong base
Wave (3) extended sharply, ends at 607
Wave (4) correction expected near 390
Wave (5) projected target: 830+
Analyst Learning Takeaways
Wave 3 typically shows strongest momentum—confirmed here with a sharp rally to 607
Wave 4 often retraces 38–50% of Wave 3, making 390 a logical support zone
Wave 5 tends to mirror Wave 1 or exceed it if sentiment and volume align
Analyst View The current wave structure suggests a healthy impulsive cycle with textbook symmetry. Wave 3 has shown strong directional conviction, and the expected Wave 4 correction toward 390 aligns with Fibonacci retracement norms. If price stabilizes above 390, it confirms buyer strength and sets the stage for Wave 5. The projected target of 830+ is based on proportional extension logic and prior cycle behavior. This setup resembles the 2014 rally, where a similar Wave 4 held and led to a breakout. Traders should monitor volume and sentiment near 390—any breakdown below this level would invalidate the bullish continuation and call for reassessment.
Tatapowerview
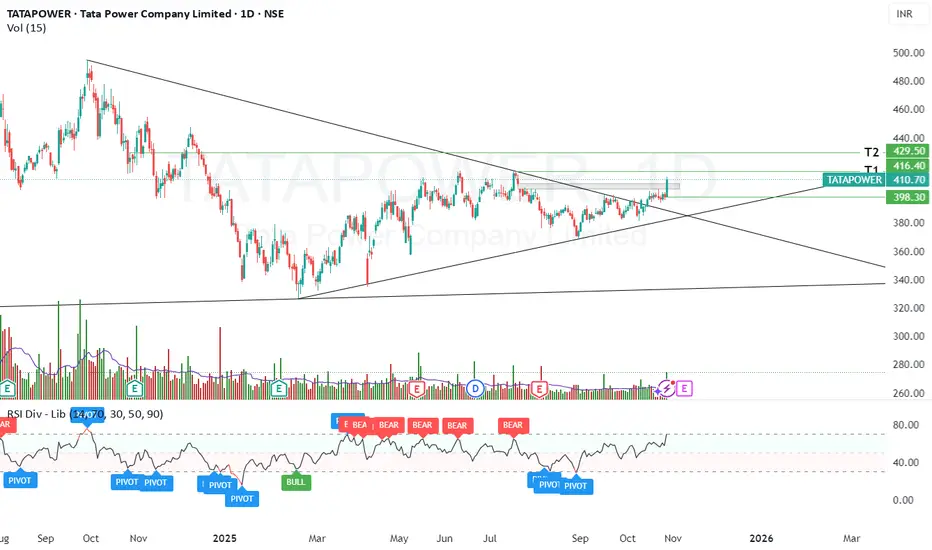
TATA POWER – Reversal Setup Near Key Support | Cup & Handle TATA POWER – Reversal Setup Near Key Support | Cup & Handle Retest
For Study Purpose Only
🕒 Timeframe: Weekly & Daily
💡 Pattern: Cup & Handle (trendline retest + neckline breakout)
📈 Current Zone: ₹400–₹410
🎯 Targets: ₹418 / ₹430
⏳ Duration: 10–15 Days
🧭 Technical View:
On the weekly chart, Tata Power has taken support along the previous cup-and-handle trendline, right near the lower boundary of the handle, and has reversed upward from this level — suggesting a continuation of the larger bullish structure.
On the daily chart, the stock has delivered a clean neckline breakout while also filling the earlier runaway gap in the ₹400–₹410 zone. This gap fill acts as a successful retest of support and builds a foundation for the next leg up.
The price has shown healthy consolidation just below ₹400, forming a base with stable volume. A sustained close above ₹400 could trigger a short-term reversal move toward ₹418 and ₹430 levels in the coming sessions.
📊 Study Highlights:
Weekly support confirmation at previous trendline
Neckline breakout with retest on daily chart
Gap fill adds confidence to structural strength
Consolidation phase ending near ₹400
Momentum recovery visible on short-term indicators
⚠️ Disclaimer:
This analysis is purely for educational and study purposes. Not a buy/sell recommendation. Always conduct your own due diligence.
Tata Power
Tatapower :
1. Super Breakout above 363....
2. Some profit booking seen on last trading day...
3. One of my favorite stock..
4. Evey investor should have this in their portfolio...
5. I have marked price road map on the chart...
6. Every dip you can add near green lines...
7. Traders can use to plan their trades based on the levels...
Happy Trading
Like.. Share.. Follow

TATA Power Buy SetupIn weekly chart NSE:TATAPOWER has been given a breakout above level of 230.40 and closed above resistance level. In this situation buyer can wait for some price retracement up to level of 225 which could be best entry level to take buy entry with stop loss of 215 (-10 Points risk).
My expected upside target would be 235 (+10), 243 (+18) & 247 (+22).
This could be more that 1:2 risk reward opportunity.
Note: This is my personal analysis, only to learn stock market behavior. Thanks.

TATA PowerRefer my below linked study for TATA Power
Price action perfectly respected...
But the cart is still weak on a daily horizon.
have marked important price action levels.
Happy trading...
Like & Share...
Follow for more updates....

tata power SHORT Short- TATA POWER for the given below targets -
shown in fibo
it took too long to break the trendlibne - but now when the trendline is broken - it is gone-
AVOID any longs

TATAPOWER Best Risk & Reward Buy IdeaNSE:TATAPOWER is trading at best entry point. My idea is to take entry at 224.50 with small stop loss of 220.50 (-4 Points). My expected upside target will be 231 & 233.
Note: This is my personal analysis, only for learning. Thanks.

TATAPOWER- WEEKLY TIME FRAME SETUPThe Structure looks good to us, waiting for the this to correct and then give us these opportunities as shown on this instrument (chart).
Note: its my view only and its for educational purpose only. only who has got knowledge in this strategy will understand what to be done on this setup. its purely based on my technical analysis only (strategies). we don't focus on the short term moves, we look for only for Bullish or Bearish Impulsive moves on the setups after a good price action is formed as per the strategy. we never get into corrective moves. because it will test our patience and also it will be a bullish or a bearish trap. if fundamentals are really positive and good we can anticipate this move.
we do not get into bullish or bearish traps. we anticipate and get into only big bullish or bearish moves (Impulsive moves).
Just ride the bullish or bearish impulsive move.
buy low and sell high concept. buy at cheaper price and sell at expensive price.
Keep it simple, keep it Unique.
please keep your comments useful & respectful.
Thanks for your support....

Tata Power Short TermLong Above 236.95, T1 - 252.25, T2 - 270.35, T3 - 285.40...... SL 220.45
Short Below 217.15, T1 - 210.45, T2 - 203.70-200.60, T3 194.40, T4 185.50, T5 177.70......... SL 228.50

Tata Power - For educational purpose - Positional
Importat:
Only way to succeed in market is to protect your capital
Give more importance to risk and reward
Always take trade on setup.

3TATAPOWER CO. LMT Descending Triangle#TATAPOWER Hello trader, I hope are good and safe. Today I opened the chart of #TATAPOWER for 4 hours and analyzed it then I see that this chart has made a #DESCENDING TRAINGLE, So I hope Tata Power will go up,
When price retest the resistance line then Nice opportunity for Buying.
If you have any query then leave a comment.
Keep Supporting And Thank You..


Tata Power levels for long termTata power long term view
This view is for educational purpose only. Do not take trades based on our view.

TataPower Channel BreakoutTata power is coming out of the channel now. Looking good for medium term. All levels on the chart for the reference purpose. One can add it around 126 - 127 levels.

TATA POWER After a consolidation of 1 month , the stock has formed an triangular structure & has given
a breakout, assuming wave (e) to be complete around 120 area , stock is all set to complete an upthrust move, one should buy the stock on cmp and add on dips upto 120 to 123 zones if you get chance, and maintain the stoploss of 118.20 and look for the target of 128 & 134 levels and more.
Key Levels
Disclaimer
I am not sebi registered analyst
My studies are Educational purpose only
Consult with your Financial advisor before trading or investing

Breakout in TATAPOWER (Weekly Time Frame)This analysis is for short-term swing trading opportunities (ranging from few days to few weeks). The analysis is purely based on price action on weekly time-frame.
As can be seen in the image, the trend-line has been acting as good resistance till it was broken on 10th August 2020 with increased volume . The stock touched its life-time bottom and then from there, it started an up-trend (higher-highs and higher-lows). As this uptrend continued, large increase in volume can be seen on charts (stock never saw such huge volumes in its lifetime).
After the breakout with volume confirmation, the price went up little and came down to retest that support level (same trend-line). As can be seen from the charts, price has got good upward rejection from that support. Also, if we use Fib-Retracement tool, we find that the support level is at 0.382 level which shows strength in on-going uptrend.
Trade strategy can be - to enter on the high of next green candle (entry can be made on daily time-frame as well on the high of previous-day candle). SL can be taken below 0.382 level = 49 or preferably below 48-47.5 level.
For Targets, there are two options - Either take previous swing highs as targets (marked with horizontal rays in red colour). Or target can be deduced with help of Trend-based Fib Extension tool (as shown in image). Target-1 as per that tool will be 72, Target-2 = 78 and Target-3 = 83 level.

Breakout in TATAPOWERThis analysis is for short-term swing trading opportunities (ranging from few days to few weeks). The analysis is purely based on price action on weekly time-frame.
As can be seen in the image, the trend-line has been acting as good resistance till it was broken on 10th August 2020 with increased volume. The stock touched its life-time bottom and then from there, it started an up-trend (higher-highs and higher-lows). As this uptrend continued, large increase in volume can be seen on charts (stock never saw such huge volumes in its lifetime).
After the breakout with volume confirmation, the price went up little and came down to retest that support level (same trend-line). As can be seen from the charts, price has got good upward rejection from that support. Also, if we use Fib-Retracement tool, we find that the support level is at 0.382 level which shows strength in on-going uptrend.
Trade strategy can be - to enter on the high of next green candle (entry can be made on daily time-frame as well on the high of previous-day candle). SL can be taken below 0.382 level = 49 or preferably below 48-47.5 level.
For Targets, there are two options - Either take previous swing highs as targets (marked with horizontal rays in red colour). Or target can be deduced with help of Trend-based Fib Extension tool (as shown in image). Target-1 as per that tool will be 72, Target-2 = 78 and Target-3 = 83 level.

