TradeCityPro | Bitcoin Daily Analysis #220👋 Welcome to TradeCity Pro!
Let’s move on to the Bitcoin analysis. The market continues its downward movement, and yesterday it recorded another bearish leg.
⏳ 1-Hour Timeframe
If you remember, yesterday we drew a bearish structure for Bitcoin with a bottom at 10,1302, which we could use as a trigger for a short position.
⭐ After that level was broken, a new downward move began, and the RSI entering the oversold zone added even more bearish momentum to the market.
✔️ As a result, the price managed to drop below the 9,9631 level in its first move. After a pullback to this zone, Bitcoin has now started another downward leg.
📊 Volume has been increasing throughout this bearish movement, and the RSI is once again approaching the oversold area, meaning that if it enters this zone, the current leg is likely to continue.
⚡️ We can also draw a curved trendline on Bitcoin’s chart, from which the price was rejected yesterday. The price is currently far from that line, but if a correction occurs, this trendline could act as a dynamic resistance. The static resistance zone is at 9,9631.
🎲 For today’s trading setup, the short trigger is at 9,7117, though it’s quite risky and has a high chance of being a fakeout. However, if market momentum remains bearish, this trigger can still be suitable for a short entry.
💡 If you already have open short positions, there’s no need to open new ones using this trigger — your entry is already at a good point. For profit-taking, you can use Dow Theory’s trend reversal signals to guide your exits.
❌ Disclaimer ❌
Trading futures is highly risky and dangerous. If you're not an expert, these triggers may not be suitable for you. You should first learn risk and capital management. You can also use the educational content from this channel.
Finally, these triggers reflect my personal opinions on price action, and the market may move completely against this analysis. So, do your own research before opening any position.
TCP

TradeCityPro | Bitcoin Daily Analysis #219👋 Welcome to TradeCityPro!
Let’s dive into the Bitcoin analysis. A bearish structure has formed in the market, so let’s review today’s key triggers together.
⏳ 1-Hour Timeframe
Yesterday, Bitcoin made another bearish leg after being rejected from the 10,5043 level, dropping all the way down to 10,1302.
🔔 The corrections during this downtrend that started from 10,6644 have been quite deep, and yesterday, after reaching the 10,1302 zone, the price made a short-term correction up to 10,3855.
✔️ Today, after reaching that level again, Bitcoin has started forming red candles and is now moving back toward the 10,1302 support.
💡 If the 10,1302 level breaks, we can open a short position.The main confirmation of a continued bearish trend will come with the break of 10,0308.
📊 For a long position, the first trigger is at 10,3855, and the main long trigger is at 10,5043.The main confirmation of a bullish reversal will come with a break above 10,6644.
❌ Disclaimer ❌
Trading futures is highly risky and dangerous. If you're not an expert, these triggers may not be suitable for you. You should first learn risk and capital management. You can also use the educational content from this channel.
Finally, these triggers reflect my personal opinions on price action, and the market may move completely against this analysis. So, do your own research before opening any position.

TradeCityPro | Bitcoin Daily Analysis #218👋 Welcome to TradeCity Pro!
Let’s dive into the Bitcoin analysis. Today, the market has started another upward move.
⏱ 1-Hour Timeframe
Yesterday, after breaking the support zone, Bitcoin made a downward move to the 10,2489 level. Now, it has started another upward movement.
The price is currently facing resistance at the 10,5020 level, and as you can see, it has experienced a strong rejection from this level, which has caused the bullish momentum to fade from the market.
This rejection at the 10,5020 level makes it a very important zone. If this level is broken, it will act as a strong trigger for a long position.
The first trigger for a long position:
The first trigger for a long position is the 10,5020 level. The next main trigger, which is our primary long trigger, is at 10,6644.
For a short position:
If the downward momentum continues, we can open a short position when the 10,2489 level is broken.
However, as long as the price is ranging between 10,2489 and 10,5020, I prefer not to open any new positions.

TradeCityPro | FETUSDT Analysis AI Coins Ready to Take Off?🚀 FETUSDT Analysis — Are AI Coins Ready to Take Off? 🤖
Let’s move on to the analysis of FET (Fetch.ai) — one of the leading projects in the AI and data category, which could soon attract significant capital inflow. It’s worth keeping an eye on this one, as momentum might be building up in the AI sector.
🌐 Overview of Bitcoin
Before starting the analysis, let me remind you once again that we’ve moved the Bitcoin analysis section to a dedicated daily report at your request — allowing us to discuss Bitcoin’s trend, dominance, and overall market sentiment in greater detail each day:
📊 Technical Structure (4H Timeframe)
After losing the key 0.5213 support, FET experienced a sharp drop toward the daily support at 0.2037, where it finally found strong buying pressure.
From that level, the coin made an impressive rebound up to 0.3830, followed by a rejection and a pullback to 0.2936, where buyers once again stepped in to defend the zone.
💎 Bullish Scenario (Long Setup):
If price breaks above 0.3830, it would confirm renewed bullish momentum — signaling a potential long entry opportunity, with the main target at 0.5213. This move would indicate that AI-related coins are gaining strength again.
🔻 Bearish Scenario (Short Setup):
While there are better short setups available on coins like SUI and APE, if FET fails to print a higher high and instead breaks below 0.2936, a short-term correctional short trade could still be considered — though with lower conviction compared to other charts.
📈 Summary:
FET is currently showing signs of accumulation after a deep correction, and the AI narrative could fuel the next breakout. Keep an eye on 0.3830 as your early trigger zone — a breakout there might just mark the start of the next leg up for AI tokens.
📝 Final Thoughts
Stay calm, trade wisely, and let's capture the market's best opportunities!
This analysis reflects our opinions and is not financial advice.

TradeCityPro | POL Faces Crucial Resistance Test👋 Welcome to TradeCity Pro!
In this analysis, I’m going to review POL, one of Ethereum’s Layer 2 projects, currently ranked #48 on CoinMarketCap with a market capitalization of $1.87 billion.
⌛️ 4-Hour Timeframe
On the 4-hour chart, after finding support around 0.1590, this coin formed a high at 0.1724 and has since made its first bullish move after breaking that level.
✔️ Right now, price is facing resistance around 0.1836, a zone it has already tested twice—each time getting rejected.
✨ If 0.1836 breaks, we can look for a long position, with the next resistance area sitting around 0.2046.
📊 یFor short positions, I’ll wait until the structure turns bearish before acting. At the moment, the short trigger is at 0.1724, but the main confirmation of a downtrend would only come after a break below 0.1590.
📝 Final Thoughts
Stay calm, trade wisely, and let's capture the market's best opportunities!
This analysis reflects our opinions and is not financial advice.
Share your thoughts in the comments, and don’t forget to share this analysis with your friends! ❤️

TradeCityPro | Bitcoin Daily Analysis #217👋 Welcome to TradeCity Pro!
Let’s dive into the Bitcoin analysis. The market has finally started an upward move, and the triggers we set yesterday have been activated.
⏳ 1-Hour Timeframe
Yesterday, Bitcoin created a smaller range box between the 10,601 and 10,2489 levels, and after breaking the upper range of the box, the price moved up to the upper boundary of the main box at 10,3855.
📊 Volume increased throughout this move, and the strength of the green candles grew significantly. The 10,3855 resistance was also broken, and with the RSI entering the overbought zone, a sharp upward move began.
⚡️ This upward move continued to 10,6412, and after reaching this level, momentum started to slow down, and RSI exited the overbought zone. The price is now ranging below 10,6412.
📈 Today’s trigger:
The key trigger for Bitcoin today is breaking the 10,6412 level. If this level is broken, the upward move will continue.
✔️ In case of a correction, if the price forms a higher low above 10,3855, the bullish trend will remain intact, and the next upward leg could start.
🔽 For a short position, I don’t think we should pursue it yet. We should wait for the trend to turn bearish again. The confirmation for a bearish trend will come if the price stabilizes below 10,3855.
❌ Disclaimer ❌
Trading futures is highly risky and dangerous. If you're not an expert, these triggers may not be suitable for you. You should first learn risk and capital management. You can also use the educational content from this channel.
Finally, these triggers reflect my personal opinions on price action, and the market may move completely against this analysis. So, do your own research before opening any position.

TradeCityPro | Bitcoin Daily Analysis #216👋 Welcome to TradeCity Pro!
Let’s dive into the Bitcoin analysis. The market has finally started an upward move, and the triggers we set yesterday have been activated.
⏳ 1-Hour Timeframe
Yesterday, Bitcoin created a smaller range box between the 10,601 and 10,2489 levels, and after breaking the upper range of the box, the price moved up to the upper boundary of the main box at 10,3855.
📊 Volume increased throughout this move, and the strength of the green candles grew significantly. The 10,3855 resistance was also broken, and with the RSI entering the overbought zone, a sharp upward move began.
✅ This upward move continued to 10,6412, and after reaching this level, momentum started to slow down, and RSI exited the overbought zone. The price is now ranging below 10,6412.
🚀 Today’s trigger:
The key trigger for Bitcoin today is breaking the 10,6412 level. If this level is broken, the upward move will continue.
🔽 In case of a correction, if the price forms a higher low above 10,3855, the bullish trend will remain intact, and the next upward leg could start.
⚖️ For a short position, I don’t think we should pursue it yet. We should wait for the trend to turn bearish again. The confirmation for a bearish trend will come if the price stabilizes below 10,3855.
❌ Disclaimer ❌
Trading futures is highly risky and dangerous. If you're not an expert, these triggers may not be suitable for you. You should first learn risk and capital management. You can also use the educational content from this channel.
Finally, these triggers reflect my personal opinions on price action, and the market may move completely against this analysis. So, do your own research before opening any position.

TradeCityPro | WLFI Coin: Eyes on Trump’s Project for Big Moves👋 Welcome to TradeCity Pro!
In this analysis, I want to review the WLFI coin.
✔️ Before we dive into the analysis, let me tell you that this coin is part of the World Liberty Finance project.
🔔 This is a DeFi project linked to Trump, which hasn't fully launched yet, and its token was recently listed. Given Trump's significant influence on social media, it might be worth keeping an eye on this coin, as it could potentially make sharp moves.
📅 Daily Timeframe
Since its listing in September, this coin has been trading in a range below the 0.2423 resistance level for about a month. After that, it experienced a sharp drop in line with the overall market downturn on October 10th.
📊 Currently, the main support level for this coin is at 0.1127, and the price is facing resistance at 0.1518.
🧩 One thing to note is that this chart is only two months old, so all the support and resistance levels in it have been formed within this short period. Therefore, don't view these levels as extremely strong and unbreakable. The token hasn't fully discovered its real value yet.
🧮 Moving on with the analysis:
If the price breaks 0.1518, the next resistance levels are 0.1804 and 0.2423. I will personally start buying this coin once the 0.2423 level is broken. The earlier trigger would be the break of 0.1518.
💡 For a bearish scenario, it’s quite clear:
A break of 0.1127 would confirm the start of a downward move.
📝 Final Thoughts
Stay calm, trade wisely, and let's capture the market's best opportunities!
This analysis reflects our opinions and is not financial advice.
Share your thoughts in the comments, and don’t forget to share this analysis with your friends! ❤️

TradeCityPro | JUP Bearish Bias Near Key Support Zones👋 Welcome to TradeCity Pro!
In this analysis, I want to review the JUP coin,one of the projects in the Solana ecosystem, with a market cap of $1.09 billion, currently ranked 64th on CoinMarketCap.
⏳ 1-Hour Timeframe
On the 1-hour timeframe, this coin has formed a structure between the 0.3357 and 0.3591 levels, and has already faked out the range once to the upside and once to the downside.
🔍 After the fakeout to the upside, the price made a downward move toward the 0.3357 support, and as you can see, the selling volume in the red candles has been very strong.
🎲 At the moment, I believe the sellers have much more control in the market compared to the buyers, so the probability of a further downward move is higher for now.
📈 In that case, we can open a short position if the 0.3357 level breaks. One important thing to note is that the zone between 0.3260 and 0.3357 is a very strong support area where many buyers are active.
📊 So if buying volume enters this range, we may see a shift in market strength. In that case, breaking the 0.3488 level could give us a long position.
📈 The main long trigger for this coin is at 0.3591. However, since the price has already faked this level once, it's better to wait for a reaction to refine the exact breakout point.
📝 Final Thoughts
Stay calm, trade wisely, and let's capture the market's best opportunities!
This analysis reflects our opinions and is not financial advice.
Share your thoughts in the comments, and don’t forget to share this analysis with your friends! ❤️

TradeCityPro | Bitcoin Daily Analysis #215👋 Welcome to TradeCity Pro!
Let’s move on to Bitcoin analysis. Today is Sunday, and the price is ranging inside a new box it has formed. The breakout from this box is critical and could be the start of the next move.
⏳ 1-Hour Timeframe
On the 1-hour timeframe, Bitcoin has formed a large ranging box between the 100,308 and 103,855 levels, and the price has already faked out once to the downside.
🔔 After this fakeout, a bullish move began, pushing the price up to 103,855.
✅ However, since this move happened on Friday and we entered the weekend afterward, the market's momentum has faded, and now, the price is ranging within a much smaller box.
🎲 This range is forming between 101,601 and 102,489, and breaking either of these levels could give us a position.
💡 A key point to remember is that volume must increase in the direction the price breaks. If volume diverges from the price, the move is likely to be a fakeout.
☘️ The main triggers are still 100,308 and 103,855. Breaking either of these zones will set off the next major move in the market.
❌ Disclaimer ❌
Trading futures is highly risky and dangerous. If you're not an expert, these triggers may not be suitable for you. You should first learn risk and capital management. You can also use the educational content from this channel.
Finally, these triggers reflect my personal opinions on price action, and the market may move completely against this analysis. So, do your own research before opening any position.

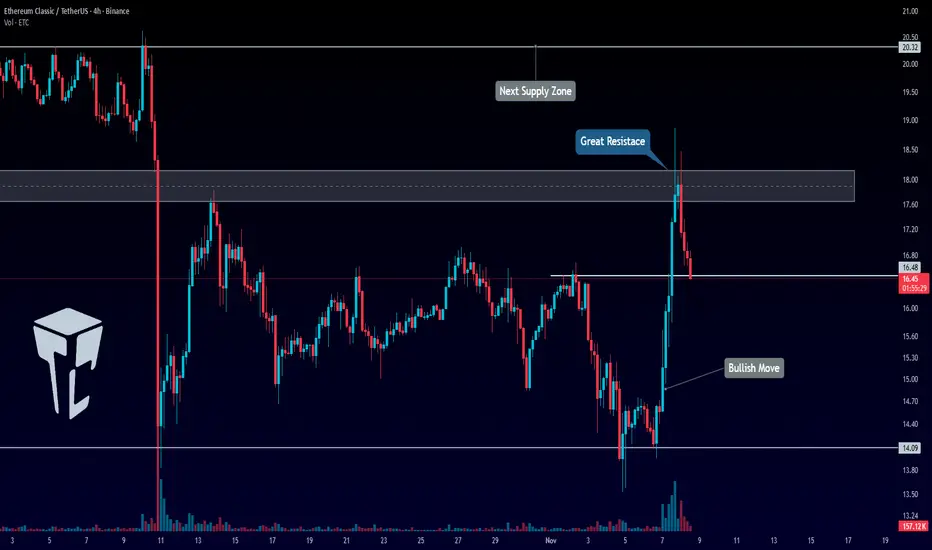
TradeCityPro | ETC: Key Levels and Trend Analysis👋 Welcome to TradeCity Pro!
In this analysis, I want to review the ETC coin—one of the Layer 1 projects with a market cap of $2.57 billion, currently ranked 39th on CoinMarketCap.
⏳ 4-Hour Timeframe
On the 4-hour timeframe, this coin made an upward move after being supported at the 14.09 level and was able to reach around the $18 zone.
✅ Currently, the price has had a minor correction, dropping to near the 16.48 level.
🎲 If the 18$ level is broken, the continuation of the move will begin, and we can use this as a trigger for a long position.
✨ If the correction continues and the 16.48 level is broken, the price could undergo deeper corrections.
📊 Currently, the volume is in favor of the buyers, and the volume has been decreasing during the correction. Therefore, if the price moves towards the 18$ zone with increasing volume, we can open a long position.
⭐ The main confirmation for a bullish trend on this coin will be breaking the 18$ zone and setting a higher high and low beyond this level. The next resistance level for the price is at 20.32$.
📝 Final Thoughts
Stay calm, trade wisely, and let's capture the market's best opportunities!
This analysis reflects our opinions and is not financial advice.
Share your thoughts in the comments, and don’t forget to share this analysis with your friends! ❤️
TradeCityPro | Bitcoin Daily Analysis #214👋 Welcome to TradeCity Pro!
Let’s dive into the Bitcoin analysis. The market is finally showing signs of turning bullish. Let's do a complete analysis of Bitcoin.
⏳ 1-Hour Timeframe
Yesterday, Bitcoin faked the low it had formed, which helped the bullish momentum enter the market.
✨ Currently, after reacting to the 103,855 level, Bitcoin has entered a correction and is now attempting to form a higher low.
✅ If this higher low is formed and the price moves towards 103,855 again, we can open a long position when this level is broken.
⭐ This trigger is the first for a long position and, naturally, it will be a bit risky. However, I prefer to keep this position open because if the market decides to move upward in the future, we can more easily open new positions.
📊 For a short position, I am currently waiting for the market to create more structure and new triggers to emerge. For now, the only trigger we have is the 100,308 level.
🎲 The volume has slightly decreased compared to yesterday, which is normal because today is Saturday. We need to observe how the buyer and seller volume compares today, and based on that, we can determine the strength of the buyers and sellers.
❌ Disclaimer ❌
Trading futures is highly risky and dangerous. If you're not an expert, these triggers may not be suitable for you. You should first learn risk and capital management. You can also use the educational content from this channel.
Finally, these triggers reflect my personal opinions on price action, and the market may move completely against this analysis. So, do your own research before opening any position.

TradeCityPro | Bitcoin Daily Analysis #213👋 Welcome to TradeCity Pro!
Let’s dive into the Bitcoin analysis. The market has been calm for a few days, but we need to stay alert in case a new move starts, so we don’t miss out.
⏳ 1-Hour Timeframe
After reacting to the 0.382 Fibonacci level, Bitcoin started to drop again and reached the 100,308 support.
✨ Currently, after a minor bullish correction, the price is heading back towards the 100,308 support.
✅ Breaking this support still seems like a strong trigger for a short position. Even yesterday, when the price briefly reached this zone with a shadow, we saw clear buying interest in this area, with a significant increase in buying volume as the price touched the support.
🔑 The key point is that every time the price reacts to this level, the buying pressure is getting weaker. Fewer and fewer buyers are willing to buy at this level.
🎲 If this pattern continues, the psychological level of 100,000 will lose its impact, and breaking it will become easier.
⚖️ So, if the price touches this support a few more times, I anticipate a higher chance of the level breaking.
⭐ However, if the buyers show more strength at this level and can push the price above 104,000 with significant volume, we could expect Bitcoin to turn bullish.
📝 Final Thoughts
Stay calm, trade wisely, and let's capture the market's best opportunities!
This analysis reflects our opinions and is not financial advice.
Share your thoughts in the comments, and don’t forget to share this analysis with your friends! ❤️

TradeCityPro | Bitcoin Daily Analysis #212👋 Welcome to TradeCity Pro!
Let’s dive into the Bitcoin analysis. The market has entered a corrective phase and is preparing for the next wave of movement.
⏳ 1-Hour Timeframe
On the 1-hour timeframe, Bitcoin started correcting after reaching the support at 100,308 and has now retraced to the 0.382 Fibonacci level.
📊 Market volume significantly increased around the 100,308 support, indicating that this zone is very sensitive and important, with price reacting to it.
✨ Currently, volume has decreased slightly, and the price is in a corrective phase. If this correction continues, the next resistance zones will be at the 0.5 and 0.618 Fibonacci levels.
⭐ However, if the price continues its downward movement, we can open a position with a candlestick setup when the volume increases towards 100,308, or wait for the break of the 100,308 support to open a position.
✅ For a long position, if buying volume increases, the break of the 0.382 Fibonacci level would be a good trigger for a long entry.
❌ Disclaimer ❌
Trading futures is highly risky and dangerous. If you're not an expert, these triggers may not be suitable for you. You should first learn risk and capital management. You can also use the educational content from this channel.
Finally, these triggers reflect my personal opinions on price action, and the market may move completely against this analysis. So, do your own research before opening any position.

TradeCityPro | HBAR: Support Zone and Key Resistance Levels👋 Welcome to TradeCity Pro!
In this analysis, I want to review the HBAR coin,one of the RWA (Real-World Asset) coins, with a market cap of $7.22 billion, currently ranked 19th on CoinMarketCap.
⏳ 4-Hour Timeframe
On the 4-hour timeframe, this coin is sitting on a very important support level. Unlike most altcoins that have lost their support levels, HBAR has managed to stay above its support zone.
🔔 A double top pattern formed below the 0.20789 level, and after the trigger activated at 0.19028, it made a downward move until it reached its support level and hit the pattern's target.
💥 Currently, after the price reached this zone, the market has reacted to it, showing a small bullish correction with low volume.
✨ The price has corrected to 0.17532. If the price gets rejected from this zone, we can consider entering a short position if the support breaks.
✅ If the price stabilizes above 0.17532, it may undergo deeper corrections up to 0.19028.
📊 For a long position, the 0.17532 break is not a very strong trigger because the market's momentum is still bearish. I believe the main long trigger is breaking 0.20789. We can take earlier triggers if a new structure forms.
💡 The main confirmation for a bullish trend will come with a break of 0.23093. For a short position, as mentioned, our trigger is the break of the support zone.
📝 Final Thoughts
Stay calm, trade wisely, and let's capture the market's best opportunities!
This analysis reflects our opinions and is not financial advice.
Share your thoughts in the comments, and don’t forget to share this analysis with your friends! ❤️

TradeCityPro | Bitcoin Daily Analysis #211👋 Welcome to TradeCity Pro!
Let’s dive into the Bitcoin analysis. The market is still in a downtrend and has reached its next support!
⏳ 4-Hour Timeframe
Bitcoin finally broke the important support at 106,396 yesterday, and with a very high selling volume, it managed to start its new downward wave.
💥 The RSI oscillator also entered the oversold zone at the same time as the 106,396 break, which was another reason for the market's drop.
⚡️ This downward move has reached the 100,308 support, and the price has calmed down a bit now.
✅ The psychological level of 100,000 is extremely important. Despite the massive selling volume and bearish momentum in the market, buyers haven’t allowed the price to stabilize below this level, and now the market is in a corrective phase.
🧩 After the price reacted to this zone, the volume has significantly decreased, which favors the sellers. If the buying volume remains low, the price will likely start falling again with the entrance of new selling volume.
🔔 However, since the RSI has faked the 30 level and the market momentum could turn bullish, we could see a reversal. If the volume starts to increase and considering the bullish trend on higher timeframes like the weekly chart, we could open a position.
🔍 For now, the first long trigger we have in this timeframe is 111,789. If the price can sharply recover to this level, a very strong bullish trend could begin.
💡 The main resistance zone we have is 115,771, and breaking this level will confirm the start of Bitcoin's new upward wave. We can look to enter the trend after breaking 111,789. If the price builds further structure, we can enter earlier with smaller triggers.
❌ Disclaimer ❌
Trading futures is highly risky and dangerous. If you're not an expert, these triggers may not be suitable for you. You should first learn risk and capital management. You can also use the educational content from this channel.
Finally, these triggers reflect my personal opinions on price action, and the market may move completely against this analysis. So, do your own research before opening any position.

TradeCityPro | ZEC: Bullish Trend & Key Resistance Levels👋 Welcome to TradeCity Pro!
In this analysis, I want to review the ZEC coin—one of the privacy coins, with a market cap of $7.12 billion, currently ranked 19th on CoinMarketCap.
⏳ 4-Hour Timeframe
This coin is moving completely independently from the market, and while Bitcoin and other altcoins are experiencing significant declines, ZEC continues its bullish trend.
🔔 Currently, the price is within a steep ascending channel, which was formed after breaking the 292 level.
✅ The resistance the price is currently facing is the 474.83 level, and I believe that if this level is broken, we can look for the next long position.
🎲 If this resistance is broken, a bullish leg towards the upper boundary of the channel could form.
💥 The RSI oscillator is moving within a box between 50 and 70, and the 50 level serves as a strong momentum support for this coin.
✨ As long as the RSI stays above 50, the bullish wave will continue, and we can open positions with broken triggers. If the 70 level breaks and enters the overbought zone, the bullish move will become even sharper.
📊 This coin is not suitable for short positions. There are plenty of altcoins that are in a downtrend and have short triggers, so it’s better to focus our attention on ZEC for long positions only.
📝 Final Thoughts
Stay calm, trade wisely, and let's capture the market's best opportunities!
This analysis reflects our opinions and is not financial advice.
Share your thoughts in the comments, and don’t forget to share this analysis with your friends! ❤️

TradeCityPro | Bitcoin Daily Analysis #210👋 Welcome to TradeCity Pro!
Let's dive into the Bitcoin analysis. The bearish movement of Bitcoin has begun, so it's best to analyze the market together.
⏳ 1-Hour Timeframe
On the 1-hour timeframe, Bitcoin is in a downtrend, and after breaking the 105,780 level yesterday, it continues its downward movement.
📈 The next low point the price reached was 104,488, which has also been broken, and the price is still moving downward.
💥 The RSI oscillator is at a very important support level around 30, and from both a momentum and candlestick perspective, we can say there is no weakness in the trend.
✨ Therefore, a break below the 30 level and into the oversold zone significantly increases the likelihood of a sharp downward move.
✔️ Currently, we don’t have a short trigger because the price has moved very sharply, and no specific trigger has been formed. However, once RSI enters the oversold zone, we can use candlestick setups for entries.
🎲 As long as the price doesn’t create a lower low and lower high below 104,488, I won’t consider the break of this level valid, and there’s a possibility of this bearish move being a fakeout.
🧮 If the price stabilizes above 105,780, it would confirm the fakeout. However, if the price stabilizes below 104,488, the next wave of the drop will begin.
❌ Disclaimer ❌
Trading futures is highly risky and dangerous. If you're not an expert, these triggers may not be suitable for you. You should first learn risk and capital management. You can also use the educational content from this channel.
Finally, these triggers reflect my personal opinions on price action, and the market may move completely against this analysis. So, do your own research before opening any position.

TradeCityPro | Bitcoin Daily Analysis #209👋 Welcome to TradeCity Pro!
Let's dive into the Bitcoin analysis. The market momentum is bearish, so it's better we make a proper price analysis together.
⏳ 1-Hour Timeframe
Yesterday, Bitcoin made a downward move and was rejected from the peak it created at the 111,365 zone.
📈 The long trigger we had at 111,365 didn’t get activated, and now the price has started its downward movement after breaking the 108,844 level.
🔔 The support level that the price has reacted to is 105,780. The price has hit this level with a very large volume and is reacting to it.
💥 If this level breaks, a huge sell volume will enter the market, and a new downward wave could start.
✨ We will confirm the start of this new wave with a break below the 104,488 level. We can also use the 105,780 and 104,488 triggers as entry points for positions.
✔️ As for a long position, I am currently waiting for this bearish momentum to dissipate before looking for a long trigger.
❌ Disclaimer ❌
Trading futures is highly risky and dangerous. If you're not an expert, these triggers may not be suitable for you. You should first learn risk and capital management. You can also use the educational content from this channel.
Finally, these triggers reflect my personal opinions on price action, and the market may move completely against this analysis. So, do your own research before opening any position.

TradeCityPro | Bitcoin Daily Analysis #208👋 Welcome to TradeCity Pro!
Let's take a look at Bitcoin's analysis — the market is still ranging.
⏱ 1-Hour Timeframe
In the 1-hour timeframe, Bitcoin is still below the 111365 level. Today, it moved close to this level once, but it is currently still trading below it.
⛏ Good buying volume has entered the market, while the volume of red candles has been decreasing. In case 111365 is broken, we can open a long position.
🧮 If the price gets rejected from this level, the first short trigger we have is 108844. The next support levels are 107486 and 106319.
📊 Overall, I still believe that as long as the price is between 106319 and 115808, the market movements are temporary and not very exciting. As long as the price stays in this zone, I will open short-term positions and take profit quickly.
❌ Disclaimer ❌
Trading futures is highly risky and dangerous. If you're not an expert, these triggers may not be suitable for you. You should first learn risk and capital management. You can also use the educational content from this channel.
Finally, these triggers reflect my personal opinions on price action, and the market may move completely against this analysis. So, do your own research before opening any position.

TradeCityPro | Bitcoin Daily Analysis #207👋 Welcome to TradeCity Pro!
After a short break, let's get back to the daily Bitcoin analysis. The market is still in a very large range box.
⏳ 1-Hour Timeframe
Currently, Bitcoin is recovering after the drop to the 106319 level and has moved up to 110803.
✅ Today is Saturday, and as you can see, the market volume has dropped significantly. It seems that the market may range until tomorrow afternoon and won't move much upwards, with the main movement starting next week.
⚡️ The triggers we have for opening positions right now are:
For long: 110803
For short: 108844 and 106319
💥 Overall, Bitcoin is in a very large range box between 106319 and 115808, and as long as the price stays between these two levels, I will open my positions with very low risk.
❌ Disclaimer ❌
Trading futures is highly risky and dangerous. If you're not an expert, these triggers may not be suitable for you. You should first learn risk and capital management. You can also use the educational content from this channel.
Finally, these triggers reflect my personal opinions on price action, and the market may move completely against this analysis. So, do your own research before opening any position.

TradeCityPro | Bitcoin Daily Analysis #206👋 Welcome to TradeCity Pro!
Let’s move on to Bitcoin’s analysis, the market is still moving upward, so let’s review it together.
⏳ 1-Hour Timeframe
Yesterday, Bitcoin formed a resistance zone around 111463, which it touched once, and on the next attempt, it managed to break through this level.
⭐ In this bullish leg that started after the fake-out of 107486, the RSI is strongly supporting the trend and is now close to the Overbought area.
✔️ However, volume is still very low and doesn’t confirm the trend, which isn’t ideal. Since today is Saturday, overall market volume is weak, and there’s a high chance that with the start of the new weekly candle, this entire upward move could turn out to be a fake-out in the next couple of days.
✨ Still, I believe it’s worth the risk to keep the positions open that were entered at 108943 and 111463, because if the 113429 level breaks, price could start a very strong bullish move.
💥 If this upward move turns out to be fake and price stabilizes below 111463, we can consider that as a temporary bearish confirmation — in that case, price could again drop back down toward the 107486 level
📝 Final Thoughts
Stay calm, trade wisely, and let's capture the market's best opportunities!
This analysis reflects our opinions and is not financial advice.
Share your thoughts in the comments, and don’t forget to share this analysis with your friends! ❤️

TradeCityPro | Bitcoin Daily Analysis #205👋 Welcome to TradeCity Pro!
Let’s analyze Bitcoin today, as the market is making an upward move, so it's important to have a solid analysis to stay ahead of future movements.
⏳ 1-Hour Timeframe
Bitcoin's upward movement continues, and after yesterday's correction, the price is now moving upwards again toward the 111645 level.
This movement is accompanied by weak momentum, and the volume is decreasing, so opening a long position right now is a bit risky.
However, if 111645 breaks, we can open a long position with a very low risk. The break of this level will be our next trigger for a long position.
The main long trigger is 113429. Breaking this resistance can initiate the next upward movement for Bitcoin.
But the volume needs to increase. Any movement accompanied by decreasing volume is a strong sign of trend weakness and won’t last long.
If you already have a long position from 108943, you can take profits if the trend confirms and the price gets rejected at 111645.
For short positions, we should wait for the market structure to change and for a short trigger to appear.
❌ Disclaimer ❌
Trading futures is highly risky and dangerous. If you're not an expert, these triggers may not be suitable for you. You should first learn risk and capital management. You can also use the educational content from this channel.
Finally, these triggers reflect my personal opinions on price action, and the market may move completely against this analysis. So, do your own research before opening any position.
